Del 1
The Management of the Government Pension Fund
1 Introduction
The Government Pension Fund comprises the Government Pension Fund Global (GPFG) and the Government Pension Fund Norway (GPFN). The two parts of the Fund are managed by Norges Bank and Folketrygdfondet, respectively, under mandates set by the Ministry of Finance.
In this report, the Ministry of Finance presents results and assessments relating to the management of the Government Pension Fund in 2011. Plans for the further development of the Fund’s investment strategy are also presented, as announced in Report No. 15 (2010–2011) to the Storting – The Management of the Government Pension Fund in 2010. An account is also given of the efforts made to develop the management framework.
Long-term, good management of Norway’s petroleum resources
When the Bratteli Government presented the first comprehensive report to the Storting on the integration of the petroleum sector into the Norwegian economy in 1974, an ambition was adopted which stated that the oil revenues should primarily be used to develop «a qualitatively better society»; see Parliamentary Report No. 25 (1973–74) – Petroleum Industry in Norwegian Society. The report stated that «A rapid and uncontrolled growth in the use of material resources should be avoided, unless the social structure is otherwise substantially changed».
Moreover, it was recognised early on that the large revenues from the petroleum sector are not income in the normal sense, but to a large degree involve the extraction of a non-renewable resource. Accordingly, to ensure long-term balance in the economy, it was important to limit the use of state oil revenues. This implied that, at times, it would be necessary to invest some of the revenues from the petroleum sector outside Norway.
Until the mid-1990s, a large proportion of the revenues from the petroleum sector were used over the national budgets, and to repay national debts. The State Petroleum Fund was established by legislation in 1990, and the first allocation to the Fund was made in 1996. In 2006, the Fund was renamed the Government Pension Fund Global (GPFG).
The prospects of large revenues from the petroleum sector and a strong increase in fund capital since the year 2000 indicated a need for guidelines to ensure a long-term and systematic use of oil income. Report No. 29 (2000–2001) to the Storting – Economic policy guidelines, introduced the fiscal policy guideline.
The value of the GPFG is now in the same order of magnitude as the present value of the expected future revenues from the petroleum sector. The extraction and sale of Norway’s petroleum resources generates large revenues to the state on an ongoing basis. The part of these revenues which is not used in the national budget is invested in financial assets held by the GPFG. Over time, therefore, the state’s wealth will become less dependent on developments in oil and gas prices.
Experience shows that Norway has succeeded in facilitating long-term, good management of the country’s petroleum wealth, so that it can benefit both current and future generations. A third of the total value of the state’s net income from the petroleum sector consists of residual petroleum resources on the Norwegian continental shelf, one third is invested abroad through the investments held by the GPFG, and the remaining third has either been used over the national budget or saved in some other form. At the end of the year, the fund capital amounted to over NOK 3,300 billion. The Government is emphasising safe, long-term management of the Norwegian people’s joint savings, so that Norway can realise its vision of a qualitatively better society that protects individuals and delivers inter-generational solidarity.
The strategy for the management of the Fund is designed based on the expected long-term effects of different investment choices. The return on the Fund will depend on sustainable development in economic, environmental and social terms, and on well-functioning, legitimate and efficient financial markets.
Fluctuating markets
In 2011, the return on the GPFG’s investments was -2.5 percent before the deduction of management costs, measured in the Fund’s currency basket. Measured in Norwegian krone, the return was -1.4 percent. The development of the Norwegian krone does not, however, influence the Fund’s international purchasing power. Norges Bank’s management costs reduced the return by 0.08 percentage points. The return on the investments of the GPFN was -3.9 percent before the deduction of management costs. The management costs of Folketrygdfondet reduced the return by 0.08 percentage points.
Norges Bank achieved a return that was 0.1 percentage points lower than the benchmark index against which the management of the GPFG is measured. Folketrygdfondet achieved a return that was 1.3 percentage points higher than the benchmark for the GPFN.
The results for 2011 are characterised by considerable uncertainty in the financial markets regarding the growth prospects of the global economy. The sovereign debt crisis in Europe also had a negative effect on the amount of risk which investors were willing to take on. This resulted in a drop in the European equity market in particular.
Since 1998, the GPFG’s annual return has varied between -23.3 percent and 25.6 percent, and the GPFN’s return has varied between -25.2 percent and 33.5 percent. The results achieved by active management also vary from year to year. Over time, both Norges Bank and Folketrygdfondet have generated value in their operational management.
The results emphasise that we must be prepared for the value of the Government Pension Fund to vary significantly from year to year. Figures from Norges Bank show that we should normally expect the value of the GPFG’s investments to fluctuate by around 10 percent (at present, around NOK 300 billion), from one year to the next. Corresponding figures from Folketrygdfondet show that annual fluctuations in the value of the GPFN of around 17 percent (currently around NOK 22 billion), are normal.
The Government Pension Fund has a considerable capacity to absorb such fluctuations. The investment strategy does not aim to minimise fluctuations in the value of the Fund. A strategy with this objective would produce a considerably lower expected return over time. Furthermore, there is little risk that the owner of the Fund will need to withdraw large amounts on short notice. This gives the Fund a greater ability to bear risk than many other investors.
Since 1997, the annual real return on the GPFG’s investments has averaged 2.7 percent. This is lower than the Ministry’s estimated long-term real return of 4 percent, but nevertheless well within the margin of uncertainty which must be expected. The real return on the Fund is discussed in greater detail in chapter 2; see box 2.1.
The importance of transparent management which enjoys widespread support
It is important that we succeed in maintaining a long-term investment strategy during periods of unrest in the financial markets. Broad support for how the Government Pension Fund is managed provides a solid foundation for long-term management. The Storting’s consideration of the annual report on the management of the Government Pension Fund is part of this.
Transparency is a prerequisite for securing widespread confidence in the management of the Government Pension Fund. The risk which is assumed in management activities must be presented properly. This report, along with the ongoing reporting by Norges Bank and Folketrygdfondet, is meant to contribute in this regard.
Good long-term management demands continuous efforts…
The Ministry wants to ensure that the Government Pension Fund is the best managed fund in the world. This requires us to identify international best practice with regard to all aspects of fund management, and strive to implement it.
The objective for the investments of the Government Pension Fund is to achieve the highest possible return over time, given a moderate level of risk. The investment strategy is based on the principle that taking risk gives a pay-off in the form of higher expected returns, or risk premium, over time. The Ministry is giving emphasis to exploiting the Fund’s ability to bear risk by building on its special characteristic as a large, long-term investor.
Government bonds are normally considered to be among the safest investments in the world. However, the sovereign debt crisis in some European countries has shown that investors believe that the selection of government bonds which can play this kind of role is currently more limited than before. It is difficult to uncover all forms of risk in advance. A good diversification between individual countries and regions will reduce the Fund’s exposure.
In Report No. 15 (2010–2011) to the Storting, the Ministry concluded that the exchange rate risk appears smaller than previously expected, and that there is no longer a basis for such a strong concentration of the investments in Europe. In addition, the report stated that a geographical distribution in accordance with market values is a natural starting point for the composition of the Fund’s equity portfolio, but that factors such as investability, concentration risk and expectations regarding risk and return in different markets would also be relevant considerations. Moreover, the Ministry wrote that a relevant question is whether the proportion of the Fund which is invested in emerging markets should be increased by more than the amount indicated by market trends and a reduction in Europe’s weight.
As notified last year, this report sets out the following plans for changes to the GPFG’s investment strategy:
A new benchmark for the GPFG’s fixed income investments that incorporates GDP-weighting of government bonds and a simplification of the benchmark through the removal of some sub-markets. The implementation of these changes has commenced. Further, there are plans to expand the benchmark index to include government bonds from emerging economies.
A new geographical distribution for the GPFG’s equity investments, which will be based more on market weights than before. The plan is to reduce the European proportion by around 10 percentage points. The emerging markets proportion increases by about 2 percentage points.
Plans are also presented for a change to the system for rebalancing of the Fund’s equity portion.
Sections 2.2 to 2.4 of this report discuss the planned changes to the benchmark for the GPFG’s fixed income investments and to the geographical distribution of the benchmark for equities.
Section 2.5 explains the GPFG’s rebalancing rules. The values of the equity and fixed income portfolios will develop differently, even if Norges Bank does not purchase or sell securities. The Ministry of Finance has therefore set rules for Norges Bank’s management, which ensure that the equity portion does not deviate too much from the chosen equity portion of 60 percent. These rules are important for the Fund’s total risk. Good experiences have been made with the Fund’s rebalancing rules. Among other things, they contributed to particularly large equity investments in periods of falling stock prices at the beginning of the 2000s, and during the financial crisis in 2008–2009. At the same time, it is natural to consider whether the rules can be improved. The new geographical distribution of the Fund’s investments and the changes to the fixed income benchmark also indicate that the rebalancing rules should be adjusted.
.. based on long-term assessments of risk and return
The Fund’s investment strategy is based on assessments of expected risk and return in the long run. Changes to the strategy must be considered within a long-term perspective. It is not desirable to amend the strategy quickly or too often. The strategy cannot be formulated based on current issues in the financial markets.
The Ministry seeks to facilitate a broad-based debate on important aspects of the Fund’s investment strategy. Material changes are submitted to the Storting. A thorough decision-making process is a strength of the investment strategy. At the same time, it limits the kinds of strategy-related decisions which the Ministry can make. For example, it will hardly be possible to make quick decisions to increase or reduce investment in equities depending on whether the equities appear «cheap» or «expensive».
In any event, the size of the Fund imposes limitations on the possibility of undertaking major shifts in the Fund’s composition.
Over time, the return on the Government Pension Fund will depend on a sustainable development. The Fund is to make a contribution in this regard by adopting responsible investment practices based on good corporate governance and respect for environmental and social considerations related to its investments. Work on responsible investment practices, including the Fund’s exclusion mechanism and the exercise of ownership rights, are an integral part of the management of the Fund. However, the Government Pension Fund is not suited for safeguarding all types of obligations, and is not to be used as a foreign policy instrument. The Norwegian authorities have other measures at their disposal, which will often be more targeted than guidelines for the Fund’s investments can be.
A good governance structure is a prerequisite for good management
In future work on the development of the investment strategy, the Ministry will give particular emphasis to exploiting the Fund’s special characteristic as a large, long-term investor with relatively small liquidity needs. This will further improve the risk-return ratio.
The Fund’s governance structure must reflect the investment strategy. In some areas, the governance system will have to be adapted to new forms of investment. One example in this regard is the introduction of real estate investments in the GPFG. In the case of such investments, it makes no sense to distinguish between active and passive management, and decisions relating to the investment strategy must be delegated to the manager to a greater degree.
At the same time, important decisions concerning the risk assumed in the course of management must have the support of the Fund’s owners, represented by the Ministry, the Government and the Storting. An effort has been made to achieve the appropriate balance by requiring decisions which are of material importance to the risk level of the Fund to be submitted to the Storting before being implemented, while the management mandates set by the Ministry to Norges Bank and Folketrygdfondet are based on principles.
Summary
The transition of Norway’s wealth from petroleum resources in the ground to foreign assets through the investments of the GPFG helps to improve the diversification of the state’s petroleum wealth. When oil and gas are sold and the state invests in equity and fixed income through the GPFG, this reduces the fluctuations in the total wealth, comprising petroleum and the Fund.
The investment strategy for the Government Pension Fund is based on assessments of expected returns and risk in the long run. A key assumption underpinning the strategy is that a higher average return over time will be achieved on equity investments than on fixed income investments. However, the size of this additional return, or equityrisk premium, is uncertain, and will vary from decade to decade.
Developments in the period since 1996 were special. The increase in oil prices was strong. The return on the fixed income investments was historically high, whereas the return on equities was low. Overall, the developments were favourable. The value of the GPFG has become significantly higher than envisaged in 2001, when the fiscal policy guideline was introduced. In the Revised National Budget for 2001, it was estimated that the GPFG would reach a size of around NOK 2,100 billion in 2010, while the actual value was close to NOK 3,100 billion. This reflects the fact that the oil price has risen sharply since 2001.
Norway’s management of its petroleum wealth has been a positive experience so far. The management of the Government Pension Fund is part of this. By continuing to pursue long-term, good management of the Fund, we can ensure that all generations benefit from Norway’s petroleum income.
2 Investment strategy of the Government Pension Fund Global
2.1 Background to the investment strategy
2.1.1 Introduction
The Government Pension Fund shall support government saving to finance the National Insurance Scheme’s expenditure on pensions and support long-term considerations in the use of state petroleum revenues. Long-term, safe management of the Fund helps to ensure that both present and future generations can benefit from Norway’s petroleum wealth.
The Government Pension Fund is an instrument for general saving. The Fund does not have clearly defined future liabilities. The investment objective is to maximise the purchasing power of the fund capital, given a moderate level of risk. The adoption of responsible investment practices supports this objective.
This chapter discusses the GPFG investment strategy. The GPFN investment strategy is discussed in chapter 3.
2.1.2 The main features of the investment strategy
The GPFG investment strategy is derived from the Fund’s special characteristics and assumptions regarding the functioning of the financial markets. Over time, the Ministry of Finance and Norges Bank, in their respective capacities as the owner and manager of the Fund, have developed an investment strategy with the following characteristics:
harvesting risk premiums over time,
diversification of investments,
exploitation of the Fund’s long-term horizon,
responsible investment practices,
cost efficiency,
a moderate degree of active management, and
a clear governance structure.
The management of the GPFG is based on the principle that risk must be accepted to secure a satisfactory expected return over time. In the financial markets, investors who are willing to take risks are rewarded with higher expected returns. This expected additional return is referred to as a risk premium. The aim for the management of the GPFG is thus not to minimise fluctuations in the Fund’s returns. Such a strategy would produce a significantly lower expected return.
The GPFG has a higher ability to bear risk than many other investors. Among other things, this is because the Fund has no clearly defined future liabilities, and a long investment horizon. The appropriate risk level for the Fund will depend on the risk tolerance of the owners, represented by the political authorities. The support given by the Storting in 2007 to the Government’s plan to increase the equity portion to 60 percent has helped to define the acceptable level of risk for the Fund.
When investmentsarediversified across many securities, the total risk may become smaller than the risk associated with each individual investment. The risk which cannot be eliminated by diversification is referred to as systematic risk. An important insight from financial theory is that risk premiums are linked to systematic risk. This means that the expected return on an investment is largely determined by the contribution of the investment to the systematic risk of a portfolio, and not by the risk associated with the individual investment. Accordingly, diversifying risk can reduce portfolio risk without reducing the expected return. This improves the ratio between expected return and risk.
The GPFG’s investments are spread across several asset classes. The investment strategy means that around 60 percent of the fund capital is invested in equities. The remaining capital is invested in fixed income, with the exception of a share of up to 5 percent invested in real estate.
The Fund’s equity and fixed income investments are spread across markets in many countries. In each market, the investments are distributed among a series of individual companies and issuers.
Sections 2.2 and 2.3 respectively discuss changes to the GPFG’s fixed income benchmark and plans to amend the geographical distribution of the equity benchmark. Together, these changes will help to ensure that the GPFG’s investments are spread even more widely across different countries and regions.
The GPFG has a very long time horizon. It is unlikely that the state will need to withdraw large sums from the Fund in the short term. Moreover, the Fund does not depend on short-term financing, and is not subject to regulations which could force sales at undesirable points in time. Broad support for the long-term investment strategy strengthens the Fund’s ability to maintain the strategy even in periods of great unrest in the markets.
The long horizon makes it easier to endure fluctuations in the return of the Fund from year to year. This long-term nature supports the decision to invest 60 percent of the Fund in equities. The equity investments are expected to provide substantial contributions to the return over time, but they also entail increased fluctuations in Fund performance.
The Fund’s rules for rebalancing mean that the equity portion is maintained also in periods when equity prices have fallen a great deal. The discussion on the rebalancing rules in section 2.5 indicates that also this part of the long-term investment strategy is a way in which to benefit from the Fund’s long time horizon.
The investment strategy is based on assessments of expected risk and return in the long term. Expected real return for the Fund in the long-term is discussed in more detail in box 2.1
Boks 2.1 Real return on the Government Pension Fund Global
The fiscal policy guideline means that the use of oil revenues in the national budget will increase gradually over time, approximately in line with the real return on the Government Pension Fund Global (GPFG). The fiscal policy guideline will guide the use of the state’s petroleum revenues for many decades to come. Accordingly, the expectation of a 4 percent real return is intended to apply for a period which is long enough to contain many upturns and downturns in the financial markets.
Real return since 1997
For the period 1997 to 2011, the real return on the GPFG was 2.7 percent per annum on average. If we also include the real return so far in 2012 (up to the middle of March), the average real return increases from 2.7 percent to just above 3 percent. The average return over this 15-year period is well within normal fluctuations if the expected return is 4 percent.
Figure 2.1 shows average annual real returns during rolling 15-year periods from 1900 to 2011, on a portfolio comprising 60 percent equities and 40 percent long-term government bonds. The average real return was 4.8 percent over the period 1900 to 2011, although the average during 15-year periods has varied considerably.

Figur 2.1 Average annual real returns during rolling 15-year periods from 1900 to 2011, for a globally diversified portfolio comprising 60 percent equities and 40 percent long-term government bonds.1 The horizontal line shows the Ministry’s estimate of the expected long-term real return on the GPFG. Percentages
1 The country distribution is largely identical to the distribution in the GPFG’s benchmarks for equities and fixed income.
Kilde: Dimson, Marsh and Staunton, Global Returns Data (2011), and Ministry of Finance.
Fixed income
In previous reports to the Storting, the Ministry of Finance has presented analyses of the long-term real return on the GPFG; see Report No. 10 (2009–2010) to the Storting – The Management of the Government Pension Fund in 2009, Report No. 20 (2008–2009) to the Storting – On the Management of the Government Pension Fund in 2008 and Report No. 16 (2007–2008) to the Storting – On the Management of the Government Pension Fund in 2007. The Ministry’s estimate of the long-term real return has been slightly above 4 percent. Estimates of future real return are subject to substantial uncertainty. The estimate is based on an unconditional expected real return on government bonds of 2.5 percent. An unconditional expectation is not based on current market prices and interest rates, but rather on what can be expected in a normal situation, that is in a situation in which the economy is in equilibrium.
If the real interest rate in such a situation is lower than the economic growth rate, economic theory points out that the capital stock in the economy can be too high, and consumption too low. If a state can borrow at such a low interest rate, it can maintain a budget deficit before interest without increasing its debts as a proportion of GDP. This may tempt countries to increase their borrowing, which in turn will reduce the savings available for productive investments, and thus increase the capital return. It can therefore be questioned whether a situation in which the real interest rate is lower than economic growth represents long-term equilibrium. However, the assumptions on which such arguments rest are uncertain; see Bliss (1999).
Historical analyses show that the real interest rate level may deviate considerably from the economic growth rate over long periods. A study by Escolano et al. (2011) has shown that, during the period 1966–2010, the real interest rate on government bonds in developed countries was around 1 percentage point higher than the average economic growth rate.
Many factors can influence the real interest rate, including economic growth and savings behaviour. Over time, economic growth will depend on population growth and productivity growth, and on changes in resource access and environmental factors. Future savings behaviour is uncertain, and will be affected by many factors, including demographic trends like ageing. McKinsey (2010) expects reduced willingness to save, combined with large global investment needs in the years ahead, to push the real interest rate up in the long term. Turner and Spinelli (2011) have written that the real interest rate must be expected to rise in the future, to a level above the economic growth rate. On the other hand, other studies, including Ikeda and Saito (2012)and Descoches and Francis (2007), have concluded that the real interest rate will stay relatively low in the long term, amongst other things because of ageing.
A significant proportion of the GPFG’s fixed income investments are renewed every year, as loans mature and money is reinvested in new fixed income. In the short to medium term, however, the expected real return on the Fund’s fixed income portfolio will be affected by current observed interest rates. At the end of 2011, real interest rates in the bond market were very low, both compared to the historical average since 1900 and compared to the level in 2010, when the Ministry last presented an estimate of the expected real return.
Olsen (2012) has pointed out that a real interest rate of between 0 and 1 percent indicates an expected real return for the GPFG of less than 4 percent.

Figur 2.2 Real interest rate on US 10-year government bonds, from 1900 to 2011. Nominal interest rate less an estimate of expected inflation. Percentages
Kilde: Antti Ilmanen, AQR Capital Management.
Figure 2.2 shows the development in the real interest rate on US 10-year government bonds from 1900 to 2011. The figure shows that real interest rates have varied considerably over time, but also that one has to go back to 1949 to find a real interest rate on US government bonds as low as at the end of 2011.
The low interest rate levels at the end of 2011 were due to several special circumstances:
Since 2007, the global economy has undergone the strongest downturn since the Second World War. Investors have reacted by selling risky investments like equities and buying government bonds. This has resulted in very low yields on bonds.
To stimulate economic growth, central banks have reduced their policy rates to almost zero. In addition, they have bought bonds to press down long term interest rates. It is reasonable to assume that this has increased demand for bonds and reduced bond yields.
Under these circumstances one should be cautious in drawing conclusions about the future real interest rate based on the current, low interest rate level. For a discussion of the uncertainty concerning the future real interest rate; see, for example, Turner (2011).
Equities
60 percent of the GPFG’s capital is invested in equities. Risk is higher in the equity market than in the fixed income market. Investors will normally demand a premium for the extra risk in the form of a higher expected return on equity investments. However, the size of this equity premium is uncertain.
The Ministry has defined the equity premium as the return on equities in excess of the return on long term government bonds. The Ministry has previously estimated the expected equity premium at 2.5 percent in the long term. Over the period from the Fund’s first equity investments in 1998 to the end of February 2012, the realised equity premium has been negative. During this period, the GPFG’s equity benchmark has provided an annual return which is, on average, 0.6 percentage points lower than the return on the fixed income benchmark. The realized historical equity premium over the period from 1900 to 2011 shows large fluctuations.
The size of the expected equity premium has been the subject of debate in both academic circles and among investors. Ibbotson (2011) distinguishes between four different methods for estimating the expected equity premium:
Historical returns
Consensus estimates
Demand models
Supply models
The historical returns show the additional return investors in the equity market have actually earned. According to data from Dimson, Marsh and Staunton (2011), the annual equity premium on the global index was 3.8 percent in the period 1900-2011. A weakness of the historical return is that the time period over which the return is measured may not be representative of future returns. However, Goyal and Welch (2008) have found that predictions of future premiums based on the historical equity premium are as good as predictions produced by other, more complicated methods.
Several studies have presented consensus estimates of the expected equity premium based on surveys. In their study, Fernandez (2011) et al. asked academics, analysts and companies in 56 countries about what equity premium they estimate that investors required on their equities investments in 2011. With the exception of Malaysia (4.5 percent) and Japan (5.0 percent), an average equity premium above 5 percent was reported in all of the countries. In the US, the average equity premium specified by the respondents was 5.5 percent. The study asked what risk premium was required to invest in equities today, not what the expected equity premium will be in a long-term, normal situation. It is therefore most correct to view the reported equity premium as a conditional risk premium given the current situation. In a study by Welch (2008) from 2007, 400 finance professors in the US estimated that the annual expected equity premium would lie around 5 percent for the next 30 years. In March 2012, the average expectation among chief financial officers in the US was an annual return on the S&P-500 index of 6.9 percent in the next 10 years.
Demand models try to determine the expected equity premium based on what investors demand for taking on extra risk, while supply models estimate the expected equity premium based on what companies give investors in the form of cash flows. The return on a share can be split into dividends, growth in company earnings and repricing of the company. Dividends and growth in company earnings have been the most important factors underpinning historical returns. Historically, the long term real growth in companies’ earnings has been close to per capita GDP growth; see, for example, Arnott and Bernstein (2002).
The realised equity premium has been very high compared to observed fluctuations in consumption and normal estimates of investors’ risk aversion. In the economic literature, this phenomenon is referred to as the «equity premium puzzle». One possible explanation for this puzzle is that the realised return has been significantly higher than what investors actually expected. Several studies have used a supply model to estimate what equity premium investors had reasons to expect over time, given the information available at the time an investment was made; see Fama and French (2002). The analyses indicate that positive shocks have dominated during the period, particularly since the Second World War. These results suggest that the expected equity premium should be lower than the historical equity premium. This is one reason why the Ministry has estimated that the expected equity premium will be 2.5 percent. Dimson (2011) et al. assume that the long-term expected equity premium for a global equity index is around 3 to 3.5 percent, relative to bills. The expected equity premium is lower than the historical equity premium because the expected earnings growth is assumed to be lower than the historical average.
In chapter 6 of this report, the components of the supply model are used to analyse the most important causes of the relatively low return on equities since the Fund began investing in equities in 1998. The analysis shows that the growth in earnings has been higher than the historical average during the period, while dividend yields have been somewhat lower. The low return can largely be ascribed to changes in the valuation of equities. The ratio between price and earnings has fallen. This may indicate that investors are demanding a higher expected return in the equity market now than in 1998.
Other sources of returns
Around 10 percent of the Fund is invested in bonds issued by companies. This is expected to raise long term real return. Five percent of the Fund will gradually be invested in real estate. The return on the property portfolio is expected to lie between the return on equities and the return on fixed income. In addition, active management is expected to make a positive contribution to returns over time.
Summary
The average annual real return achieved by the GPFG, 2.7 percent, lies well within normal fluctuations around an expected figure of 4 percent.
Currently, real interest rates are very low, also in a historical context. This is partly due to the strong downturn in the world economy since 2007, and partly to the desire of central banks to stimulate economic growth. In the Ministry’s view, the extraordinary circumstances in the current situation indicate that caution should be exercised about amending the estimates of the expected real return on the GPFG based exclusively on current, low real interest rates. An analysis of expected returns in the equity market supports this conclusion.
1 In this box, all return figures are calculated as geometrical averages (growth rates).
2 Dimson, Marsh and Staunton, Global Returns Data (2011).
3 It is unclear whether the reported equity premiums in this questionnaire are calculated as arithmetic or geometric averages.
The GPFG also exploits its long-term nature by investing in assets which are less liquid. The Fund’s investments in real estate are an example of this.
The GPFG shall adopt responsible investment practices that promote good corporate governance and take social and environmental factors into account, in accordance with international best practice. Responsible investment practices support the goal of achieving a good return over time. Responsible management is also important to secure the support of the Norwegian people for the management of the Fund. The Fund’s role as a responsible investor is expressed, for example, in the guidelines for observation and exclusion of companies which do not comply with minimum ethical standards. The Council on Ethics for the GPFG advises the Ministry on the observation and exclusion of companies based on these guidelines.
Norges Bank manages the Fund’s ownership interests in various companies in order to promote greater alignment of interests between the companies and the GPFG as a long-term investor. The work done in relation to the exercise of ownership rights, exclusion and observation in 2011 is discussed in more detail in section 4.4.
Both the Ministry of Finance and Norges Bank, in their respective capacities as the owner and manager of the Fund, participate in international forums in which best practice for responsible investment is discussed and further developed. In 2011, the Ministry joined other large investors in participating in an international research project focused on the long-term consequences of climate change for global capital markets. The project investigated the potential consequences of climate change for the GPFG’s investment strategy; see the discussion in Report No. 15 (2010–2011) to the Storting – The Management of the Government Pension Fund in 2010 and in section 2.6 of this report.
Priority is given to ensuring that the management of the Fund is cost efficient. Comparisons with other large funds show that Norges Bank’s management costs are relatively low. The size of the Fund allows the exploitation of economies of scale. Over time, management costs as a proportion of the fund capital have fallen; see the discussion in section 4.1. The economies of scale will probably be even greater in unlisted markets, as Norges Bank can build up its own expertise and secure access to the most efficient investment structures. Norges Bank’s investments in real estate in collaboration with leading, established bodies are one example of this.
The mandate for the GPFG contains general frameworks for management activities, in the form of benchmarks indices for equities and fixed income and limits for deviating from these benchmarks. Within these frameworks, Norges Bank is to seek to achieve the highest possible return after costs. The frameworks imply a moderate degree of active management of the Fund.
The Fund’s benchmarks are based on leading, easily accessible indices. They largely reflect the investment opportunities in the global equity and fixed income markets. The return on the benchmarks reflects the general trend in the financial markets. In the large, well-functioning global financial markets, new public information is quickly reflected in prices. The management of the Fund is therefore based on the principle that, over time, the risk of the Fund will generally reflect developments in the benchmarks set by the Ministry. The space given to active management must be viewed in light of this fact.
Norges Bank has three types of active management strategy. The Fund must be invested in accordance with the benchmarks in an efficient manner. This includes the efficient transfer of new capital into the Fund and the minimisation of unnecessary transaction costs as a result of changes in the benchmark. Moreover, Norges Bank expects its managers to analyse individual equities and bonds to identify investments they consider to be underpriced, and which they expect to deliver good returns over time. Industry knowledge and knowledge about individual companies are important components of this strategy. Finally, Norges Bank makes investment decisions after analysing systematic risk factors. Such risk factors are described in more detail in sections 2.7 (for equities) and 2.2 (for fixed income). Section 4.1 describes the role systematic risk factors play in the active management of the Fund.
In its efforts to develop the operational management of the Fund further, Norges Bank is giving emphasis to improving the ratio between risk and return. This includes making greater use of the Fund’s size and long-term nature. Norges Bank aims to exploit the long-term nature of the Fund, for example by investing in companies in which it may take a long time for the underlying value to appear and to produce the expected return. A further objective is to ensure that the Fund’s managers analyse fewer companies than before, and rather conduct more thorough studies to identify good long-term investments. A new tool for Norges Bank’s management of the Fund is operational benchmark portfolios. These are discussed in more detail in sections 2.7 (for equities) and 2.2 (for fixed income).
The management of the GPFG is based on a clear governance structure in which the Storting, the Ministry of Finance, Norges Bank’s executive board and Norges Bank Investment Management (NBIM) have different roles and responsibilities. Duties and authorisations are delegated downwards in the system, while reports on results and risk are made upwards; see the more detailed discussion in Report No. 15 (2010–2011) to the Storting. The management of the GPFG should be organised to ensure the greatest possible:
facilitation of professional, cost-effective management,
specification of clear guidelines and predictable framework conditions,
alignment of interests between the owner and the manager,
facilitation of good communication with the public about the management of the Fund,
robustness in the face of future challenges (ever-larger fund, larger ownership interests in individual companies, possible trend towards illiquid assets presenting greater governance challenges, etc.),
focus on the Fund’s role as an instrument of fiscal policy,
focus on factors that have been important in the international debate concerning sovereign wealth funds, including transparency about the purpose of the investments, and
compliance with what is internationally regarded as best practice.
Establishing and maintaining a governance structure which safeguards all of these considerations is challenging. In the view of the Ministry, the current structure has functioned well thus far.
Boks 2.2 New letters and reports concerning the GPFG investment strategy which are discussed in this report
Letter from Norges Bank of 26 January 2012 concerning rules for rebalancing of the benchmark index.
Letter from Norges Bank of 1 February 2012 concerning emerging bond markets.
Letter from Norges Bank of 2 February 2012 concerning a strategic benchmark index for equity investments.
Report by MSCI on global equity allocation.
Report by Professor C. Harvey on the allocation to emerging market equities.
Norges Bank has also prepared several discussion notes as background information for the advice it has given. These are available on www.nbim.no.
The letters are appended to this report. The reports are available on the Ministry’s website (www.government.no/gpf).
2.2 New strategic fixed income benchmark
2.2.1 Introduction
The management of the fixed income investments of the Government Pension Fund Global (GPFG) has been based on a strategic benchmark containing around 11,500 bonds. The benchmark has been composed of nominal and inflation-linked treasuries, government-related bonds, corporate bonds and securitised bonds in a total of 11 currencies. The currency weightings have been fixed in the proportions 60 percent European currencies, 35 percent North American currencies and 5 percent currencies from Asia/Oceania1.
Within each of the three currency regions, different segments of the fixed income market, and individual bonds, have had an index weight corresponding to their share of the value of the total fixed income benchmark. This method is called market value weighting, and means that the benchmark has an equally high stake in all bond issues within the same geographical region.
The Ministry already wrote in Report No. 10 (2009–2010) to the Storting – The Management of the Government Pension Fund in 2009 that there were several weaknesses in the fixed income benchmark. In Report No. 15 (2010–2011) to the Storting – The Management of the Government Pension Fund in 2010, the Ministry stated that, in light of, inter alia, the experiences gained during the financial crisis, it had conducted analyses of the risk and return properties of various segments of the bond market in order to re-evaluate the management of these investments. Among other things, the review was based on a report by Professor Stephen Schaefer and consultant Jörg Behrens, which was published along with the Report to the Storting.
The analyses showed that fluctuations in returns on broadly composed fixed income indices can be explained by developments relating to a few systematic risk factors. The opportunity to diversify risk is thus more limited in a portfolio of bonds than in an equity portfolio.
In Report No. 15 (2010–2011) to the Storting, the Ministry also described a proposal by Norges Bank to simplify the benchmark by eliminating the sub-segments government-related bonds and securitised bonds. Norges Bank recommended a benchmark comprising 70 percent treasuries and 30 percent corporate bonds. The Ministry wrote that the proposal to simplify the benchmark could be implemented without material changes to expected risk and return, and that consideration would be given to implementing such changes in the course of 2011.
Last year’s Report to the Storting also contained a new assessment of the GPFG’s distribution across geographical regions. Until now, the GPFG has invested over half of its capital in European equities, fixed income and real estate. The reason given for the high European portion was that it reduces the Fund’s exchange rate risk. As Norway imports most from Europe, it was initially assumed that Norway could protect the purchasing power of the Fund by investing considerable amounts in European markets. In the Report to the Storting, the Ministry concluded that the long-term exchange rate risk appears to be smaller than previously expected. It was considered that the portion invested in Europe should therefore be reduced over time in favour of larger portions in the rest of the world.
The Ministry wrote that it would continue to work on establishing a new geographical distribution, and also consider starting to implement such changes in 2011.
This Report to the Storting presents the result of the Ministry’s work on a new benchmark for the fixed income portfolio, and the consequences of the adjustments for the regional distribution. The Ministry has given emphasis to the need to highlight the purpose of the different parts of the fixed income investments. As a result, certain market segments have been removed from the benchmark. The new benchmark for the Fund’s fixed income investments is largely consistent with Norges Bank’s proposed simplifications, but does not, however, remove as many market segments from the benchmark as recommended by the Bank. The changes are discussed in section 2.2.2. Section 2.2.3 discusses the work done to evaluate principles for the weighting of bonds issued by different countries and companies. The starting point for this evaluation has been that weighting based on gross domestic product (GDP weighting), appears to be a natural alternative to the current market value weighting of government bonds. In the case of bonds issued by corporations, the Ministry has proceeded on the basis that market value weighting remains the best starting point. The changes to the weighting principles result in a different currency distribution for the fixed income benchmark and entail, inter alia, that the share of European bonds will be reduced over time.
The adjustments to the benchmark for fixed income have already commenced. The Ministry has changed the benchmark for fixed income in the GPFG in accordance with the discussion in section 2.2.2 such that the benchmark now has a government sub-portfolio of 70 percent and a corporate sub-portfolio of 30 percent. The Ministry has also started a gradual adjustment towards the new currency composition that follows from applying GDP weights for the government part of the benchmark and market weights for the corporate part. See the discussion in section 2.2.3. In section 2.2.4, a plan to include emerging markets in the benchmark for fixed income is presented. The implementation of such an extension of the benchmark has not started. In line with what has been the practice in previous changes of the benchmark, the Ministry will inform in more detail about the implementation when the changes have been carried out.
Section 2.2.5 contains a comparison of the old and new benchmarks. The need to amend Norges Bank’s mandate and the relationship between the strategic benchmark and Norges Bank’s operational benchmark portfolio are discussed in greater depth in section 2.2.6.
2.2.2 Clarifying the role of fixed income in the overall portfolio
The aim of the GPFG’s investment strategy is to maximize the international purchasing power of the fund capital, given a moderate level of risk. Through the GPFG’s investments in equity, fixed income and real estate, the Fund participates in global value creation. Fixed income investments primarily play two roles in the management of the GPFG:
They improve the ratio between expected risk and return in the Fund. This is because the value of many bonds – primarily government and corporate bonds with a very high credit rating – largely does not fluctuate in line with the return on the equity portfolio. Although such bonds have a relatively low expected return, they play an important role because they reduce the Fund’s risk. In addition, they are often easy to trade. This can contribute to maintaining a fixed equity portion of 60 percent over time.
They harvest risk premiums in addition to the risk premium linked to interest-rate risk. This is particularly true of the credit and liquidity risk factors. The report by Schaefer and Behrens showed that these risk factors are associated with long periods of small, but stable, positive contributions to the Fund’s return. However, they are also linked with periods featuring significant drops in value. The long time horizon on which the GPFG’s investments are based means that the Fund is well-positioned to absorb such fluctuations in value.
In Report No. 10 (2009–2010) to the Storting, the Ministry wrote that while the Fund’s equity benchmark represents the equity market well, the fixed income benchmark covers only a limited part of the investment opportunities for fixed income instruments. In accordance with Norges Bank’s advice, the Ministry has chosen to remove additional sub-segments from the Fund’s benchmark to clarify the two roles of the fixed income investments described above.
Norges Bank has analysed the fixed income market in a separate note.2 The note contained a comparison of the fixed income investments of four other large funds. The review showed that the funds have adopted different approaches to making strategic allocations to the fixed income market, but that they typically base their decisions regarding the selection of allocations and portfolio structures on the role of the fixed income investments.
Boks 2.3 More about the bond market
A bond is a tradable loan with a maturity of more than one year. Bond issuers (borrowers) may include public authorities, banks, and other large private enterprises. The bond is redeemed by the issuer upon maturity, and during the period between issue and maturity, the holder of the bond is paid interest (called a coupon). A bond is traded in the primary market when a borrower issues a bond that may be purchased by many investors. Bonds are freely tradeable, and can therefore be bought and sold in the secondary market. Most bonds have a fixed nominal interest rate, i.e. the coupon is an amount agreed in advance. There are also other types of bond, including bonds featuring floating interest rates, zero coupons or gradual redemptions. Many bonds are backed by different forms of collateral. Bonds may also offer options, such as the right to repay the loan earlier than at maturity.
Treasuries
Treasuries in developed markets are the largest market segment in the case of both inflation-linked bonds (close to 100 percent of the market), and nominal bonds (around 50 percent of the market).
The market for government bonds is dominated by a few currencies. Almost 95 percent of nominal government bonds in developed markets are issued in Japanese yen, US dollars, Euros or British pounds. Government bonds issued in local currencies by states in emerging markets account for around 5 percent of the market for nominal bonds.
Government related bonds
The treasury segment is often limited so as only to include treasuries issued in the state’s own currency. The government related bond sub-segment encompasses, among other things, government bonds issued in foreign currency, bonds issued by municipalities and other public-sector bodies, bonds issued by businesses that are partly owned by, or that receive support from, the public sector, and bonds issued by supranationals such as the World Bank.
Inflation-linked bonds (real interest rate bonds)
Inflation-linked bonds protect investors against changes in the purchasing power of invested capital. In addition to compensation for the development of a price index, investors receive a real return which has been agreed in advance.
Securitised bonds
Securitised bonds account for 15 percent of the market for nominal bonds. Such bonds are backed by a portfolio of underlying loans, most commonly residential mortgages. The largest sub-group of securitised bonds in the US is bonds secured by a charge over residential mortgages arranged and guaranteed by federal agencies like Fannie Mae and Freddy Mac. In the US, the securitised bond market is almost as large as the treasury market. In Europe, covered bonds constitute a large market in several countries, but this market remains relatively small in comparison to the market for treasuries.
Investment-grade corporate bonds
The market for investment-grade corporate bonds is about equal in size to the market for securitised bonds.
The US is the largest, most liquid and well-functioning market for such bonds. The size of the European corporate bond market varies from country to country. For example, the French market for corporate bonds is considerably larger than the market in Germany, where private enterprises make greater use of bank loans as a source of financing.
High-yield corporate bonds
High-yield bonds account for 3 percent of the market for nominal bonds, and are dominated by bonds issued in US dollars. Such bonds are not currently included in the GPFG’s benchmark, although Norges Bank’s mandate does allow for investing parts of the fixed income portfolio in such bonds. This ensures, among other things, that Norges Bank is not forced to sell bonds which are downgraded and fall below the investment-grade threshold.
In its letter of 18 March 2011, Norges Bank proposed that the benchmark for nominal bonds should comprise 70 percent government bonds and 30 percent corporate bonds. Until now, corporate bonds have made up around 18 percent of the strategic fixed income benchmark. In isolation, therefore, an increase in the proportion of corporate bonds to 30 percent would increase the credit risk of the bond portfolio. At the same time, Norges Bank proposed removing other market segments featuring credit risk, such as securitised bonds. At the end of 2011, the market segments whose removal was proposed comprised about 23 percent of the Fund benchmark.
Inflation-linked government bonds were included in the GPFG benchmark in 2005; see the discussion in the National Budget for 2005. Since then, the proportion of inflation-linked government bonds has been about 5 percent. The Ministry considers it appropriate to retain inflation-linked government bonds as part of the fixed income benchmark. This is consistent with the conclusion in Norges Bank’s letter of 18 March 2011, where the Bank wrote:
«The proportion of nominal bonds in the Fund’s strategic asset allocation should be calculated as 40 percent less the net value of the Fund’s property investments and the market value of the Fund’s strategic benchmark for real interest rate bonds.»
In a letter to the Ministry of Finance of 6 July 2010, Norges Bank gave notice that it would return to the question of investments in real assets.
In its letter of 18 March 2011, Norges Bank proposed removing the securitised bonds sub-segment from the benchmark. The US market for securitised bonds is dominated by bonds secured on residential mortgages guaranteed by agencies like Fannie Mae and Freddy Mac. Borrowers are entitled to redeem their loans and refinance them at a lower interest rate when the interest rate level drops. This is one reason why such bonds have risen less in value than, for example, government bonds, during periods featuring falling interest rates. If interest rates fall at the same time as equity market prices fall, such bonds will be less effective at curbing the fall in the Fund’s value.
Covered bonds are primarily issued by European banks, and secured on residential mortgages or loans to the public sector. These bonds do not carry the same right to refinance at a lower interest rate, and will normally be better suited to reducing fluctuations in a portfolio of equity and fixed income. Covered bonds are more comparable to corporate bonds with the highest credit rating than with US securitised bonds.
In its letter, Norges Bank also proposed removing government related bonds because this sub-segment contains widely differing bonds, including government bonds issued in foreign currencies and bonds issued by international organisations, municipalities and companies which are partly state-owned or controlled by the state.
The Ministry has analysed the various parts of the market for government related bonds. The review shows that foreign-currency government bonds issued in developed economies and bonds issued by supranationals are sub-segments with properties similar to those of government bonds. Of these two market segments, only bonds issued by supranationals account for a significant proportion of the total bond market.
The Ministry shares Norges Bank’s view that the fixed income benchmark can be simplified somewhat, and that a 70/30 split between the government and corporate parts appears appropriate. Such a split will result in approximately the same credit risk for the fixed income benchmark as for the old benchmark before bonds in emerging markets were included. Following an overall assessment, the Ministry has chosen to exclude securitised bonds, with the exception of covered bonds. The latter sub-segment primarily relates to European bonds. The Ministry is of the opinion that it is sensible to include covered bonds in the corporate part of the benchmark. Correspondingly, government-related bonds have also been removed from the benchmark, with the exception of the sub-segment supranationals. In the Ministry’s view, the latter is a natural component of the government part of the benchmark.
Until now, the benchmark has not included corporate bonds issued in the currencies of countries in Asia/Oceania. This position will be maintained in the new benchmark. The number of currencies included in the fixed income benchmark issued by companies will therefore continue to be seven.

Figur 2.3 Sub-segments included in the new benchmark for fixed income investments. Excluded sub-segment are marked by a red line
* MBS stands for «Mortgage Backed Securities».
** ABS stands for «Asset Backed Securities».
*** CMBS stands for «Commercial Mortgage Backed Securities».
Kilde: Ministry of Finance and Norges Bank.
Figure 2.3 illustrates the sub-segments included in the Fund’s benchmark as at the end of 2011, as well as the sub-segments which have been excluded from the new benchmark. Segments which have been excluded are marked with a red line. Figure 2.4 shows the distribution of sub-segments in the old and new benchmarks.

Figur 2.4 Segment breakdown of old and new benchmark. Percent of index measured by market values as of the beginning of 2012. Emerging market bonds are included in line with the discussion in section 2.2.4
Kilde: Barclays Capital, Ministry of Finance and Norges Bank.
2.2.3 Market value weighting and GDP weighting
The benchmark has largely employed market value weighting within each geographical currency region.
The global fixed income market is highly concentrated on a small number of currencies, and on government bonds issued by the largest countries. The market value weighting principle means that these properties are also reflected in the benchmark. The Fund’s high proportion invested in Europe has also resulted in a concentration on the largest European currencies.
In its letter of 18 March 2011, Norges Bank wrote that the market value weighting of government bonds implies an increase in the Fund’s exposure to countries with growing national debt burdens. According to the Bank, a better approach may be to weight the portfolio of government bonds based on the production capacity (gross domestic product – GDP), which is to finance the national debt.
A general lesson learned from the development of the government bond market in recent years is that risk also needs to be diversified widely in this part of the market. The use of market value weighting means that the states with the largest debts are given the greatest weight in the benchmark. Strong increase in public borrowing in many countries, and increased uncertainty about certain states’ ability to service their debts, underline the need to reconsider the principles governing the proportions of different government bonds in the benchmark.
The Ministry agrees with Norges Bank that the size of national economies, measured using GDP, appears to be a relevant starting point for the weighting of government bonds. GDP expresses a country’s income and tax basis. Compared to market value weights, GDP weights may be a better measure of states’ ability to pay. However, the size of an economy is not a precise measure of the ability or willingness to service government debt. Indicators such as the debt/GDP, budget balance and current account balance are often used to measure a country’s fiscal strength. Nevertheless, these measures are also not entirely precise measures of the ability or willingness to service national debts.
The Ministry will include a requirement in Norges Bank’s mandate stating that the management of government bonds must be designed to take account of differences in fiscal strength. This requirement is intended to highlight that one purpose of the Fund’s investments in government bonds is to reduce fluctuations in the Fund’s total return over time.
In its letter of 18 March 2011, Norges Bank suggested using market value weights for corporate bonds, mirroring their extensive use in relation to the Fund’s equity investments. There is no direct link between GDP and companies’ ability to service their debts. Large structural differences between the markets for corporate bonds in different currencies mean that GDP weights are not particularly appropriate for this part of the benchmark. The Ministry shares this view.
Until now, the fixed income benchmark has been based on market value weights, albeit with fixed regional weightings and a reweighting rule for, inter alia, securitised bonds in the US. As a general rule, all benchmarks which deviate from the market weights principle will increase the number of transactions needed to keep the actual portfolio close to the benchmark. Therefore, if Norges Bank manages the fixed income portfolio close to the benchmark, the new benchmark will mean an increased transaction volume and increased transaction costs.
In practice, the actual portfolio will deviate from the benchmark set by the Ministry. The National Budget for 2010 set out several reasons why such deviations will arise. Among other things, it was pointed out that it may be appropriate to purchase newly issued securities before they are included in the benchmark. Equally, it may be appropriate to sell securities with maturity less than one year or with reduced credit ratings later than the date when they are removed from the benchmark.
Since the use of GDP weighting for the government part, and market value weighting for the corporate part, of the benchmark is being introduced, a rule is needed regarding how the two sub-indices are to be combined. The Ministry agrees with Norges Bank that the distribution between the sub-indices should be fixed. A fixed distribution between the government and corporate parts of the benchmark will make the Fund somewhat more counter-cyclical, in that the Fund will invest more in corporate bonds after they have performed more poorly than government bonds, and vice versa. The rules on rebalancing towards fixed weightings between equities and bonds require the Fund to purchase equities and sell bonds when equity markets are falling. Floating weightings between the government and corporate parts would mean the sale of both government and corporate bonds when equity markets fall. Since the return on corporate bonds correlates to some degree with the return on equity, this would mean the sale of many corporate bonds which have fallen in value. A fixed weight between the government and corporate sub-portfolios, by means of monthly full rebalancing, may help to reduce the need for the sale of corporate bonds in such an environment.
2.2.4 Government bonds in emerging markets
In Report No. 15 (2010–2011) to the Storting, the Ministry pointed out that global production capacity is increasingly located elsewhere than in Europe. The Ministry also wrote that it would consider whether investments in emerging markets should be increased.
The proportion invested in the four largest currencies (US dollars, Euros, British pounds and Japanese yen), in the GPFG fixed income benchmark amounted to over 95 percent at the beginning of 2012. The changes described in sections 2.2.2 and 2.2.3 will ensure the inclusion of a higher proportion of bonds issued in yen and US dollars, while the proportion of bonds issued in Euro and British pounds will fall. This will result in a more even distribution and better diversification of risk between the largest currencies and bond issuers. At the same time, the fixed income benchmark will remain concentrated on a few currencies and individual countries, as bonds issued in these four currencies will together account for around 90 percent of the benchmark.
Expansion to include several additional currencies will require the inclusion in the benchmark of government bonds issued in local currencies in emerging markets. Such an expansion was considered in 2008. At that time, the Ministry, based not least on advice received from Norges Bank, decided not to include such bonds in the benchmark. Both the Ministry and Norges Bank stated at the time that it would be natural to return to the issue at a later date.
In a letter of 1 February 2012, Norges Bank provided advice on emerging bond markets. It recommended that the government part of the benchmark should be expanded from the present 11 currencies to include all currencies included at any given time in the GDP weighted benchmark provided by Barclays Capital (the Barclays Capital Treasury GDP Weighted by Country Index), with the exception of the Norwegian krone. Such a change would currently mean an increase in the number of currencies in the benchmark from 11 to 21. All 10 of the new currencies belong to emerging economies. Norges Bank also wrote that it did not recommend expanding the number of currencies in the corporate part of the benchmark, since a number of the emerging markets for corporate bonds remain underdeveloped. Moreover, these markets are small and account for less than 1 percent of a market-weighted global index of corporate bonds and covered bonds.
Among other things, Norges Bank wrote the following:
«The objective for the management of the Fund is to achieve the highest possible international purchasing power with moderate risk. Risk is limited by diversifying investments. A benchmark index for bond investments that includes more currencies is in line with the strategic role that nominal bonds should play in the Fund.»
Norges Bank analysed the effect on risk and return of including new currencies in Barclays Capital’s global index for government bonds, from a 10-year perspective. It commented as follows:
«It can be seen there that the inclusion of emerging markets would have resulted in a somewhat higher return and helped improve the trade-off between return and risk when the analysis is performed in a common currency such as Norwegian kroner.
However, the Fund’s return is measured in international currency. A better starting point is therefore the return in local currency and in the currency basket defined by the index. In Enclosure 1, we show that introducing investments in emerging markets would have resulted in a substantially higher return with reduced volatility during this period. The improvement in the trade-off between return and risk now appears to be greater.»
Although the inclusion of emerging markets would mean a lower concentration on the largest global issuers of government bonds, Norges Bank pointed out that, overall, the government part would face slightly higher credit risk. It wrote:
«Expansion of the Fund’s benchmark index for bond investments to include all currencies included in the BCGA index will improve diversification across issuers but will entail a certain weakening of the benchmark index’s credit quality as currently rated by the large credit rating agencies. In a GDP-weighted portfolio of government bonds, the proportion of bonds with a credit rating of A or below will, in the event of such expansion, rise from 6.5 percent to 14.6 percent, and 3 percent of government bonds will have a credit rating of BBB.»
The Ministry’s assessment of government bonds in emerging markets
The Ministry has given particular consideration to the degree to which the inclusion of new markets may be expected to improve the ratio between risk and return and in the benchmark in the long-term.
Analyses of historical returns indicate that it may be advantageous for the Fund’s long-term results to include new emerging bond markets in the benchmark. However, the measurable effect on risk and return appears to be small. One reason for this is that the new currencies only account for around 10 percent of the government part of the fixed income benchmark. When measuring the effect on the entire Fund’s risk and return, therefore, it is reasonable to expect small effects on risk and return.
Returns in emerging bond markets vary more than in developed markets, and are more strongly correlated with the equity markets, particularly during weak periods. At the same time, an expansion of the benchmark will spread the investments across more bond markets. This may in itself reduce the effect on the Fund’s returns of a crisis in an individual country or group of countries. The effect of such events is difficult to estimate, as there are no available time series for historical returns over periods of several decades.
The emerging markets whose inclusion in the benchmark Norges Bank has proposed carry a slightly higher credit risk than most of the developed markets in the government part of the benchmark. The credit rating of the fixed income portfolio will therefore be weakened somewhat by the expansion. Accordingly, it is not obvious that the inclusion of emerging markets will reduce the risk associated with the fixed income benchmark or the Fund overall.
An expansion of the benchmark to include 10 new emerging markets may also be regarded as a natural further development of the Fund’s investment strategy. All 10 of the new currencies belong to countries which are already included in the GPFG’s equity benchmark. Another relevant consideration is that the government related segment has been excluded from the new benchmark, with the exception of bonds issued by supranationals. Government bonds issued by emerging economies in foreign currency have, until now, been included in the benchmark as part of this market segment. Consequently, until 31 January of this year, government bonds issued by these countries were included in the fixed income benchmark if they were issued in one of the approved currencies.
Emerging bond markets in local currencies are growing strongly. This reflects high economic growth, strengthened state finances and increased trade with the global market in several emerging markets. The proportion of emerging market bonds will increase if these markets become more important over time.
To be included in the Barclays Capital GDP weighted index, government bonds must be investment grade. Moreover, the government bonds and the local currency markets must be sufficiently liquid and investable. In addition, there must be liquid markets for future sales of the local currency, so that international investors can hedge against exchange rate fluctuations. In the Ministry’s view, the risk of including emerging markets which satisfy these criteria can be regarded as moderate, provided that investors conduct their own assessment of the operational risk associated with settlement and custodian services.
Even if the new markets are included in the benchmark, Norges Bank will evaluate relevant investment risks and operational risks before funds are invested in these new markets. This is consistent with the mandate for the management of the GPFG.
The Ministry envisages that the new currencies will only be included in the government part of the benchmark. Table 2.1 sets out the emerging markets and currencies which will be included. In aggregate, the new emerging market currencies will account for around 10 percent of the government part of the fixed income benchmark (around 7 percent of the fixed income benchmark). Based on data as of the beginning of 2012, this will reduce the overall exposure to the four largest currencies (US dollar, Euro, British pound and Yen) from 90 percent to around 84 percent.
The Ministry also envisages the inclusion of all currencies forming part of the GDP weighted government bond index provided by Barclays Capital. If the index provider changes the selection of currencies included, the GPFG’s fixed income benchmark will be amended accordingly. As for the other parts of the government sub-portfolio, the principle of GDP weighting of individual countries is to be used for the new emerging markets.
Tabell 2.1 New fixed income benchmark as of the beginning of 2012. Change in currency composition by introducing emerging market currencies. Percentages and percentage points
Currency weightings | ||||
|---|---|---|---|---|
Country | Currency | 11 currencies | 21 currencies | Difference |
Developed markets: | ||||
America | 44.76 | 41.97 | -2.79 | |
Canada | CAD | 3.53 | 3.27 | -0.26 |
USA | USD | 41.23 | 38.70 | -2.53 |
Europe | 42.90 | 40.16 | -2.74 | |
Denmark | DKK | 0.74 | 0.68 | -0.06 |
Euro zone | EUR | 33.11 | 31.00 | -2.11 |
United Kingdom | GBP | 6.12 | 5.71 | -0.41 |
Switzerland | CHF | 1.51 | 1.42 | -0.09 |
Sweden | SEK | 1.42 | 1.34 | -0.08 |
Asia/Oceania | 12.33 | 11.14 | -1.19 | |
Australia | AUD | 2.07 | 1.87 | -0.20 |
Japan | JPY | 9.63 | 8.70 | -0.93 |
New Zealand | NZD | 0.24 | 0.22 | -0.02 |
Singapore | SGD | 0.38 | 0.34 | -0.04 |
Emerging markets: | ||||
Latin America | 1.96 | 1.96 | ||
Chile | CLP | 0.31 | 0.31 | |
Mexico | MXN | 1.65 | 1.65 | |
Europe/Middle East/Africa | 1.98 | 1.98 | ||
Israel | ILS | 0.34 | 0.34 | |
Poland | PLN | 0.78 | 0.78 | |
South Africa | ZAR | 0.53 | 0.53 | |
Czech Republic | CZK | 0.33 | 0.33 | |
Asia | 2.79 | 2.79 | ||
Hong Kong | HKD | 0.36 | 0.36 | |
Malaysia | MYR | 0.37 | 0.37 | |
South Korea | KRW | 1.57 | 1.57 | |
Thailand | THB | 0.48 | 0.48 | |
Total | 100.00 | 100.00 | 0.00 | |
Kilde: Barclays Capital and Ministry of Finance.
2.2.5 Comparison with the old benchmark
The changes described above imply that
the benchmark is simplified and clarified to make the role of the fixed income investments in the management of the GPFG more transparent,
risk is better diversified across currencies and the largest issuers,
account is taken of the size of the economy in the weighting of government bonds, and
account is taken of fiscal strength in the management of the actual government bond portfolio.
The changes are based on assessments of the consequences for long term portfolio risk and return. At the same time there is considerable uncertainty related to financial market development in the short term. In hindsight one must expect, therefore, that the timing of the changes to the benchmark may appear as more or less favourable. This timing risk is somewhat reduced by the fact that the changes will take place over time.
Within the framework of deviation from the old benchmark, Norges Bank has reduced the number of bonds in the portfolio by about 50 percent in the course of 2011. This, combined with other adjustments to the actual portfolio, means a substantial reduction in the number of transactions required in connection with the transition to the new benchmark. The inflow of new capital may reduce the need for sales further, but it will still be necessary to sell bonds to adapt the portfolio to the new composition.
Box 2.4 provides an overview of the composition of the new strategic benchmark, including the expansion with new emerging market currencies.
Boks 2.4 New fixed income benchmark
The GPFG’s new fixed income benchmark comprises two parts: 70 percent government and 30 percent corporate. Weights are fixed, and full monthly rebalancing is undertaken between the sub-portfolios.
The government part includes nominal and inflation-linked government bonds issued in countries’ own currencies, and bonds issued by international organisations1. GDP weights are used to weight the country composition for the government part of the benchmark. The GDP weights are calculated as three-year weighted averages, and are updated once a year. Full monthly rebalancing to the fixed weights is undertaken throughout the year. Bonds issued by international organisations are assigned to countries in accordance with the currencies in which the securities are issued. Since several countries use Euro as their currency, a fixed weight is set every year for such bonds issued in Euro. The GDP weights of countries in the Euro zone are adjusted downwards correspondingly. The government part of the benchmark is currently based on 11 approved currencies. In this report, the Ministry is proposing that the number of currencies in the government part of the benchmark should be increased to 21; see section 2.2.4 for further discussion.
The corporate part includes corporate bonds and covered bonds.2 Global market value weights are used for this part of the benchmark. The corporate part of the benchmark contains seven approved currencies.
1 The indices “Barclays Capital Global Treasury GDP Weighted by Country” and “Barclays Capital Global Inflation Linked” are used to select the bonds which are included in the government part of the benchmark. The internal weighting scheme for the government part adopts the methodology of the former index.
2 The “Barclays Capital Global Aggregate” index is used to select the bonds which are included in the corporate part of the benchmark (corporate bonds and the sub-segment covered bonds within Securitised). The weighting scheme adopts the methodology of this index.

Figur 2.5 New benchmark for the GPFG’s fixed income investments
Kilde: Ministry of Finance.
The main difference between the old and new benchmarks is the currency composition. The switch to GDP weighting for the government part of the benchmark will result in a lower proportion of European currencies and a higher proportion of North American and Asian currencies. In addition, emerging market currencies will be included in the benchmark. Figure 2.6 illustrates the different currency distributions as of the beginning of 2012. Over time, these weights will change in line with development in relative GDP, in the case of the government part, and market-value development, in the case of the corporate part, and in line with inclusion or exclusion of new markets.

Figur 2.6 Currency distribution in the old and new fixed income benchmark. Percent of index measured by market values as of the beginning of 2012
Kilde: Barclays Capital and Ministry of Finance.
With a lower proportion of European currencies in the fixed income benchmark, somewhat greater variations must be expected in the Fund’s value in Norwegian krone the short-term, as the Norwegian krone tends to exhibit larger fluctuations relative to non-European currencies. Calculations show that the annual standard deviation in the return on the GPFG’s benchmark, measured in Norwegian krone, would have been around 0.3 percentage points higher than they actually were in the period 2002–2011 if the new fixed income benchmark had been used. However, variations in the Fund’s returns measured in Norwegian krone do not affect the Fund’s international purchasing power.
Both the old and the new benchmark are comprised exclusively of investment grade bonds. A comparison of the distribution of credit ratings in the old and new benchmarks reveals a small increase in credit risk. The comparison is based on credit ratings at the beginning of 2012. It is the inclusion of emerging markets in particular that leads to a reduction in the proportion of bonds with the highest credit rating and an increase in the proportion with the lowest credit rating within investment grade. The proportion of bonds with a credit rating of A or lower increases from around 24 percent to around 30 percent in the new benchmark; see figure 2.6. The inclusion of the emerging market currencies explains 90 percent of this increase.

Figur 2.7 Distribution of credit ratings within investment grade. Percent of index measured by market values as of the beginning of 2012
Kilde: Barclays Capital and the Ministry of Finance.
A somewhat higher credit risk in the fixed income benchmark means that the fund manager has to meet more stringent requirements. Last year, in its strategy plan for 2011–2013, Norges Bank gave notice that it was building up its expertise in the management of credit risk and bonds issued in emerging markets. Norges Bank’s annual report on the management of the GPFG in 2011 reveals that the Bank’s credit risk analysis capacity was strengthened in 2011.
Norges Bank estimates the duration of both the new and old benchmarks to be about six years. Duration is a measure of the sensitivity of the fixed income benchmark to changes in the general interest rate level. A duration of six years means that an increase (reduction) in the interest rate level of one percentage point results in a drop (increase) in the market value of the benchmark of around 6 percent. Norges Bank’s calculation confirms that no material difference is expected between the interest rate sensitivities of the old and new benchmarks.
2.2.6 The management mandate and Norges Bank’s internal operational benchmark portfolio
The Ministry plans to amend the management mandate such that Norges Bank is required to take account of difference in national fiscal strength in connection with investments in government bonds; see the discussion in section 2.2.3.
The report by Schaefer and Behrens which was discussed in Report No. 15 (2010–2011) to the Storting proposed that part of the fixed income investments should form separate portfolios (referred to as satellites), with special mandates. The Ministry has not chosen this solution. Instead, it has chosen a simpler solution in accordance with Norges Bank’s advice. However, the Ministry will consider whether special reporting requirements should be introduced for the corporate part and for government bonds from emerging markets.
The inclusion of emerging markets in the benchmark will necessitate amendments to the framework for investments in fixed income with credit ratings below investment grade. The Ministry will also evaluate whether there is a need for further adjustments to the mandate in light of the planned changes to the benchmark.
In its letter of 18 March 2011, Norges Bank wrote that the strategic benchmark cannot reflect all risks to which the Fund should be exposed at any given time. Such assessments must be based on the exercise of discretion and form part of the operational management. Norges Bank has therefore established an operational benchmark portfolio within the current active management framework. The operational benchmark portfolio is intended to function as an instrument for steering and communicating the adjustments which the Bank makes in the management of the fixed income investments.
Norges Bank’s annual report on the management of the GPFG in 2011 described the operational benchmark portfolio for fixed income in more detail. The main difference between the strategic benchmark set by the Ministry of Finance and the operational benchmark portfolio for fixed income established by Norges Bank is a reduction in the number of bonds and issuers. At the beginning of 2012, the operational benchmark portfolio included around 5,000 bonds, while the strategic benchmark contained around 11,500 bonds. In the annual report, the Bank wrote:
«The key characteristics of the strategic benchmark index can be recreated with a much smaller number of securities, which helps reduce the complexity of the portfolio and the cost of management.»
Norges Bank has already introduced GDP weighting of government bonds denominated in Euro in the operational benchmark portfolio. At the same time, the operational benchmark portfolio contains additional countries and currencies. Norges Bank has included, inter alia, government bonds in local currencies from emerging markets such as China, India and Indonesia. The investments in these markets are an example of Norges Bank seeking to exploit its advantages as a large investor, see the description in the Bank’s letter 1 February 2012.
In the 2011 annual report, Norges Bank wrote that market weighted benchmarks will automatically reflect structural changes in the issuance of new securities. When defining the operational benchmark portfolio, the Bank may consider the appropriateness of such changes for the Fund. One example is changes in the issuance of bonds in different parts of the capital structure of banks as a result of new regulations for the financial sector. It is not obvious that such changes should automatically be reflected in the Fund’s investment strategy.
The operational benchmark portfolio is also intended to address technical weaknesses in the strategic benchmark. Such weaknesses may include, for example, the automatic exclusion of bonds which fall below a certain credit rating threshold, and the exclusion of bonds with less than one year to maturity.
2.3 New geographical distribution of the strategic equity benchmark
2.3.1 Introduction
The current strategic benchmark for equities used by the Government Pension Fund Global (GPFG) is distributed across three regions, with the following fixed weightings: 50 percent Europe, 35 percent America and Africa and 15 percent Asia and Oceania. As in the case of the fixed income benchmark, the reason for the high proportion of investments in Europe has been a consideration regarding the Fund’s exchange rate risk. As Norway imports most from Europe, it has been natural to think that it can protect the purchasing power of the Fund against exchange rate risk by investing most in European markets.
In Report No. 15 (2010–2011) to the Storting – The Management of the Government Pension Fund in 2010, the Ministry undertook a new assessment of the Fund’s exchange rate risk. It concluded that the exchange rate risk appeared to be smaller than previously assumed, and there was no longer a basis for such a strong concentration of the investments in Europe. In the Report, the Ministry wrote that a geographical distribution in line with market values was a natural starting point for the composition of the Fund’s equity portfolio, but that considerations of investability, concentration risk and expected risk and return in different markets also had to be included in the assessment. The Ministry also wrote that a relevant question was whether the proportion of the Fund which is invested in emerging markets should be increased by more than suggested by market trends and a downweighting of Europe.
This section presents plans for changes to the geographical distribution of the GPFG’s strategic benchmark for equities.
2.3.2 Criteria and reference points for the geographical distribution of equities
The objective of the GPFG’s investments is to achieve the highest possible international purchasing power for the fund capital, given a moderate level of risk. The geographical distribution of the investments is to support this objective by helping to ensure an optimal ratio between expected risk and return in the Fund.
The geographical distribution of the Fund’s strategic equity benchmark should support a good diversification of risk in the Fund in both the short and long term. The Fund’s long time horizon indicates that the primary emphasis should be on long-term considerations.
In the short-term, a broad geographical diversification of the investments can help to reduce fluctuations in the return on the portfolio, provided that the returns in different countries’ markets do not move completely in tandem. Analyses of historical returns indicate a reduction in the potential for reducing fluctuations in the equity portfolio by spreading the investments among countries. This is illustrated in figure 2.11, which shows an increased degree of correlation between the returns achieved in different markets. Globalisation, which is integrating the world’s economies and financial markets ever more closely together, is an important explanatory factor in this regard; see box 2.5.
Boks 2.5 Globalisation of the equity markets
Increased globalisation and reductions in trade barriers have characterised the development of the global economy in the last 20 years. Strong growth in emerging economies has gradually moved the global centre of economic gravity.
Publicly listed companies are participating in globalisation. Figure 2.8 shows that in 2011, up to half of the income of listed companies came from countries other than those in which the companies are listed. Home markets nevertheless remain of great importance.

Figur 2.8 Companies’ foreign sales as a percentage of total sales, in selected countries
Kilde: MSCI.
Globalisation is also reflected in the equity markets. The costs of investing internationally have fallen sharply. Ever more countries and companies have become available to international investors. While the «All Country World Index» global equity benchmark provided by the index provider MSCI covered well over 1,100 companies in 1989, the number had increased to 14,600 companies in 2011.
Over time, it has become easier for investors to spread their investments among many countries and regions. The equity portfolios of institutional investors have become more global; see figure 2.9. Nevertheless, many investors continue to invest primarily in their local regions. This may be related to the fact that investors may have certain advantages in those regions, for example in the form of reduced foreign exchange risk, advantageous tax treatment, better access to information and better protection against various forms of political risk.

Figur 2.9 Home bias1 in selected countries. Percentages
1 In this context, home bias is defined as 100 percent, less actual international equity allocation divided by market-weighted international equity allocation.
Kilde: MSCI.
Globalisation is integrating the world’s different equity markets closer together. Price trends in different markets have become more congruent, particularly since the 2008 financial crisis; see figure 2.10.

Figur 2.10 Correlation over the preceding 36 months between the returns achieved by various regional equity markets and the global market, measured in a common currency
Kilde: MSCI.
MSCI has developed a model which seeks to explain systematic differences in equity returns. Among other things, the model can be used to compare the importance of which country stocks are listed in with other explanatory factors, such as which industry the companies are operating in and other company characteristics which investors tend to consider. Figure 2.11 shows that which country a company is listed in remains important, even if the significance of this factor has fallen over time.
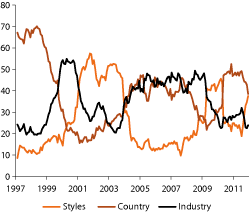
Figur 2.11 The importance of different explanatory factors in the equity market.1 Percentages
1 The proportion of the total systematic variation in returns on a broad selection of equities (cross-sectional variation) that can be explained using countries, industries and various other company characteristics.
Kilde: MSCI.
Given that the companies in the benchmark have become more international, their development becomes more dependent on the development globally. The development of companies in the same industry, but listed in different countries, may be similar. The geographical distribution of the Fund’s benchmark should ensure the necessary diversification of the investments across different sectors, such as finance, health, energy, technology, etc. Returns in different sectors have varied considerably, and individual sectors may at times experience much greater falls than the equity market as a whole.
The Fund’s long time horizon suggests that emphasis should be given to risks associated with more unique events in a country or region. Examples may include prolonged economic crises, major natural disasters and wars. Since these are events which occur rarely, it is difficult to quantify their probability. Nevertheless, it is important to take into account that such events may occur. One question is therefore whether the geographical distribution entails an excessive concentration of the investments in individual countries or regions.
The equities investments enable the Fund to participate in global economic growth and value creation. A large, and increasing, part of this growth is occurring in emerging economies. In line with this trend, the share of the global equity market accounted for by emerging equity markets has grown strongly over the last 10 years. This development reflects the increased base of new countries and companies, and high historical returns. Emerging equity markets have become more important in recent years. Moreover, investments in emerging markets have a somewhat different risk profile than investments in developed markets. Stocks in emerging markets are often less tradeable, and returns vary more than in developed markets. This makes it natural to consider the emerging markets proportion separately when discussing the Fund’s geographical distribution.
The GPFG’s special characteristics may also be significant for the geographical distribution of the Fund’s investments. The aim of reducing the Fund’s exchange rate risk has been an important reason for the high proportion of investments in Europe. Protecting the Fund’s investments against political risk may well pull in the same direction. On the other hand, investments in more remote regions and in economies which are less like the Norwegian economy may help to ensure that the Fund’s returns fluctuate a little less in line with developments in the Norwegian economy. This would contribute to a wider diversification of the risk linked to total national assets of which the Fund forms a part. Moreover, investments in emerging markets may well exploit the Fund’s particularly long time horizon and limited liquidity need.
Global market weights are a much-used principle for equity benchmarks. Such market weights mean that each individual company is included in the benchmark with a weight corresponding to the market value of the equity of each company as a proportion of the value of the entire equity market. In a market-weighted equity benchmark, the geographical distribution is determined by the companies’ market values and where they are listed. Countries with large equity markets measured in terms of market value will therefore be assigned a higher weight than countries with smaller equity markets.
In the past 10 years, it has become common to adjust market-weighted benchmarks for «free float». This involves adjusting the weightings downwards in respect of the ownership interests of large, long-term owners, and in connection with cross-ownership, because these ownership interests are not freely tradeable. The adjusted weightings provide a better measure of the capital which is available to financial investors. On the other hand, the weightings will not reflect all of the available capital. Figure 2.12 shows that an adjustment for free float is important for how the geographical distribution of the world’s share capital is measured. In emerging markets, a significant proportion of equities are not freely tradeable. Emerging markets are therefore assigned a lower weighting in a market-weighted benchmark which is adjusted for free float than in a benchmark based on full market capitalisation.
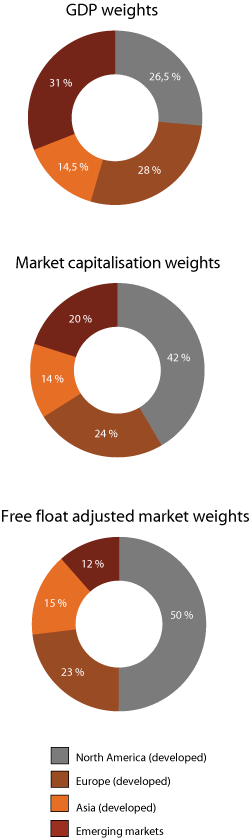
Figur 2.12 Illustration of the geographical distribution of equities under different weighting principles. Based on market prices as of December 2011. Percentages
Kilde: Ministry of Finance, Norges Bank, FTSE and MSCI.
Risk diversification involves distributing investments across as many sources of returns as possible. One question is whether a geographical distribution based on market weights achieves this aim sufficiently well. One means of evaluating this is to make a comparison with the geographical distribution of global GDP. The distribution of global GDP reflects, to a significant degree, how the world’s productive capital is distributed among countries and regions.
Figure 2.12 shows that almost 90 percent of the world’s listed equity markets are located in developed countries, while the economies of developed countries account for about two thirds of total global GDP. This is linked to the fact that developed countries often have more developed financial sectors. As a result, a larger proportion of the capital in the country is normally listed on a stock exchange. The difference is most apparent when North America is compared with emerging markets. North America is home to around half of the world’s listed equity markets (measured by market weights adjusted for free float), but only a quarter of total global GDP. Emerging markets account for almost a third of total global GDP and 20 percent of all equity capital, but only 12 percent of the equity market after adjustment for free float.
2.3.3 External analyses and advice
In connection with its assessments of the benchmark’s geographical distribution, the Ministry has received analyses and advice from the consultancy firm MSCI and from Professor Campbell Harvey at Duke University. Both MSCI and Harvey have considered the risk and return associated with investments in emerging markets. MSCI has also evaluated the risk of high ownership interests in the US and Europe, and the risk and return properties of different weighting principles. The reports are available on the Ministry’s website (www.government.no/gpf).
In a letter of 2 February 2012, the Ministry received advice from Norges Bank concerning the strategic equity benchmark. The letter is included as Annex 3 to this report. Norges Bank has also published discussion notes on topics related to the Fund’s geographical distribution. The notes are available on the Bank’s website (www.nbim.no).
Assessments of market weights
In its letter to the Ministry of Finance of 2 February 2012, Norges Bank recommended that
«(...)the starting point in a market-weighted benchmark index is retained».
The Bank emphasised that the strategic equity benchmark should reflect the role of the asset class in the Fund. To ensure the greatest possible openness and transparency, the starting point should be leading, and easily accessible benchmarks.
Norges Bank’s proposal is based on the global market weightings being adjusted for free float. The Bank wrote that if a free-float adjustment is made, differences in ownership structure between markets will mean that a market-weighted benchmark index will have an approximately 5 percentage point lower allocation to Asian equities and a correspondingly higher allocation to American equities than the full market value of companies in these regions would dictate.
Norges Bank also wrote that empirical analysis shows that portfolios constructed on the basis of different weighting criteria to a market-weighted portfolio can offer a better trade-off between risk and return. However, the Bank takes the view that such alternative weighting criteria should not be laid down in a strategic benchmark for equities; see the detailed discussion in section 2.7.
Norges Bank’s advice is to base the regional distribution of the benchmark for equities on market weights. The Bank wrote that:
«Norges Bank recommends that the strategic regional distribution of the Fund’s equity investments moves in the direction of global market weights. The transition to a new benchmark index should take place over a long period and in stages.»
The Bank also wrote that the objective of achieving the greatest possible long-term international purchasing power is best served by broad ownership of the production of goods and services. The Fund’s geographical distribution should depart from market weights only if such a composition of the Fund helps reduce risk or increase expected returns.
Norges Bank wrote that it attaches importance to being a predictable, long-term investor, and that it shares a mutual interest with the companies and countries in which it invests in creating long-term value. This means that the rights of investors must be respected, regulatory conditions must be relatively stable, and that it must be reasonably certain that the investments are safe. As a minority shareholder, the Bank depends on good corporate governance, limited discrimination and the protection of its rights in law and legal system. Norges Bank wrote that it is possible that the Fund should assign a larger weight to Europe than other regions if these considerations are prioritised. The Bank wrote that it may be natural to view Europe as an extended domestic market for the Fund with lower risks of this kind than in other regions.
In its report, MSCI wrote that market weighting is a good, objective criteria for describing investment opportunities in the global equity market. The reasons given for this view include that global market weights are simple to calculate. In addition, the costs of maintaining such a benchmark are low. In a market-weighted portfolio, companies with a high market value will be given a high weight in the benchmark. Since equities in companies with a high market weight are often easily tradeable, this will help to ensure that the portfolio comprises equities which, on the whole, are highly tradeable. MSCI also emphasised that market weights will be effective at capturing changes in the investment universe, as new markets, with their market weights, are included on an ongoing basis.
MSCI pointed out that a weakness of global market weights is that they do not take account of the fact that individual equities or parts of the market may, at times, be overpriced or underpriced compared to their long-term values. When market weights are used, equities are given a higher weight in the benchmark when they have a high value than when they have a low value. Such weights may therefore have the consequence that «expensive» equities are overweighted and «cheap» equities are underweighted. Over time, this may result in lower returns. MSCI also pointed out that global market weighting can result in a high concentration in individual countries. The Japanese equity market accounted for over 40 percent of the global equity benchmark in 1980. This was followed by a long period of significantly lower returns in Japan than in the rest of the global equity market. The experiences from Japan are highlighted as an important reason why investors began asking for benchmarks based on other weighting principles than global market weights, such as weightings based on the distribution of global GDP.
Tabell 2.2 Historical returns and standard deviations in the US and Europe, 1970–2011. Percentages
Average annual return | MSCI US (USD) | MSCI Europe (Local currency) | MSCI US (NOK) | MSCI Europe (NOK) |
|---|---|---|---|---|
1970–2011 | 9.5 | 9.6 | 9.0 | 9.6 |
1970–1979 | 4.6 | 5.0 | 0.8 | 4.6 |
1980–1989 | 17.1 | 20.9 | 20.6 | 22.0 |
1990–1999 | 19.0 | 15.9 | 21.4 | 16.8 |
2000–2009 | -1.3 | 0.0 | -4.5 | -0.9 |
Annual standard deviation | ||||
1970–2011 | 15.7 | 15.5 | 17.5 | 15.7 |
1970–1979 | 15.9 | 14.3 | 17.2 | 15.4 |
1980–1989 | 16.2 | 15.1 | 19.1 | 14.7 |
1990–1999 | 13.4 | 15.2 | 16.9 | 15.4 |
2000–2009 | 16.2 | 17.1 | 17.0 | 17.0 |
Risk-adjusted annual return | ||||
1970–2011 | 0.60 | 0.62 | 0.51 | 0.61 |
1970–1979 | 0.29 | 0.35 | 0.05 | 0.30 |
1980–1989 | 1.05 | 1.39 | 1.08 | 1.49 |
1990–1999 | 1.42 | 1.04 | 1.27 | 1.09 |
2000–2009 | -0.08 | 0.00 | -0.26 | -0.05 |
Kilde: MSCI.
MSCI was engaged by the Ministry of Finance to analyse the differences between a market-weighted portfolio which has been adjusted for free float and a GDP-weighted portfolio. In the period 1970 to 2011, a GDP-weighted portfolio produced an annual return after transaction costs which was 1.2 percentage points higher, without risk being significantly different. MSCI takes the view that the higher weighting towards emerging markets which results from GDP weighting is the most important reason for the higher return during this period.
Concentration risk
The GPFG currently has a high proportion of its investments in Europe, while global market weighting would result in a high proportion in the US. History has shown that countries or economically integrated regions may suffer special shocks which may result in long periods of weak equity market returns. Developments in Japan in recent decades are often quoted as an example of this; see above. The Ministry therefore asked the consultancy firm MSCI to analyse the risk associated with large ownership interests in the US and Europe, respectively. Among other things, MSCI evaluated the risk of events which have a low probability of occurring, but which will have a considerable impact on returns if they do occur. The Fund’s long time horizon suggests that such risks should be given emphasis.
In its report, MSCI wrote that both the US and Europe have large and broadly diversified equity markets. In both markets, companies are widely distributed among different sectors, and the weightings of even the largest individual companies are moderate. Historically, these markets have experienced smaller fluctuations than other regional equity markets.
MSCI pointed out that the American and European equity markets are closely integrated. There are many similarities between the stock price developments in the two markets. The equity markets in the two regions have produced fairly similar returns in the period from 1970 until today; see table 2.2. Periods of great uncertainty in the financial markets, or periods of strong optimism, as during the IT-bubble at the turn of the millennium, also appear to have a fairly similar effect on the markets. This is particularly so when one takes into account that the IT sector constitutes a larger portion of the market in the US, and the finance sector a larger portion in Europe.
In real terms, there appear to be many similarities between companies listed in Europe and companies listed in the US. The companies have an international orientation and large sales in other countries, although their home markets remain important, see box 2.5. The company earnings and returns on equity in the two markets have developed fairly similarly; see figure 2.13.
Overall, MSCI concluded that the two markets appear very similar. In MSCI’s view, the particular risk associated with investing a high proportion of the equity portfolio in Europe or the US is the possibility of especially negative events. As examples of such events, MSCI mentioned country-specific macroeconomic shocks and a worsening of national creditworthiness.
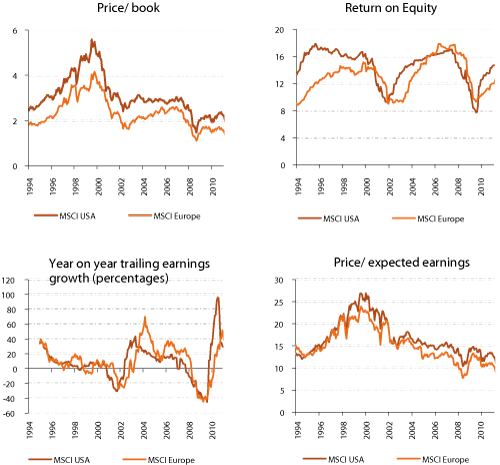
Figur 2.13 Valuation and growth characteristics of the US and Europe. June 1994–December 2011
Kilde: MSCI.
Assessments of emerging markets
Emerging markets’ share of global equity markets and of the GPFG’s equity investments has increased over time, see box 2.6
Boks 2.6 Emerging markets
The term «emerging markets» is not linked to any particular region of the world, but rather to markets in countries with a certain degree of financial development. Experience indicates that the degree of economic development, measured using GDP per capita, gives a good indication of which markets are emerging. Further, it is common to distinguish between developed emerging markets, secondary emerging markets and «frontier markets».
Emerging markets make up an ever-larger proportion of global equity markets; see figure 2.14. In MSCI’s global equity benchmarks, 21 countries are classified as emerging markets, compared to 10 countries in 1989. Emerging markets accounted for around 13 percent of MSCI’s global index in 2011, compared to just 1 percent in 1988. This development has been driven by high returns, the opening up of new markets, and by the fact that equity markets are growing in size as welfare levels rise in their economies.
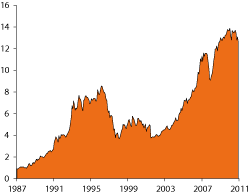
Figur 2.14 Emerging markets’ share of the global market. Percentages
Kilde: MSCI.
Emerging markets were first included in the GPFG equity benchmark in 2000. The number of emerging markets was increased slightly in 2004. In 2007, a broad review of emerging markets was conducted; see Report No. 16 (2007–2008) to the Storting – On the management of the Government Pension Fund in 2007. As a result, the number of countries in which the Fund invests was increased substantially. The Ministry’s analyses pointed out that country risk, settlement risk and risk associated with the legal framework were higher in emerging markets than in developed equity markets. At the same time, emphasis was given to the fact that these risks were monitored by the index provider, in addition to Norges Bank’s own control measures. It was also emphasised that comparable funds also allocated a significant portion of their funds to emerging equity markets.
Since 2008, the GPFG’s benchmark has included the listed equity markets of all countries which the index provider FTSE classifies as emerging. At the end of 2011, this category comprised Brazil, Hungary, Mexico, Poland, South Africa, Taiwan, Argentina, Chile, China, Colombia, Czech Republic, Egypt, India, Indonesia, Malaysia, Morocco, Pakistan, Peru, the Philippines, Russia, Thailand, Turkey and the United Arab Emirates. Frontier markets have not been included in the GPFG’s strategic benchmark, but Norges Bank is permitted to invest in these markets as part of the active management of the Fund.
At the end of 2011, investments in emerging markets amounted to some 9 percent of the value of the Fund’s equity portfolio; see figure 2.15. This is about 2 percentage points lower than the total market share of these markets in global equity markets as a whole.
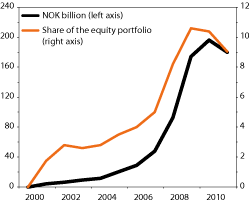
Figur 2.15 The GPFG’s investments in emerging markets. NOK billion (left axis) and as a percentage of the Fund’s equity portfolio (right axis)
Kilde: Norges Bank, FTSE and Ministry of Finance.
MSCI has commented that many large institutional investors have increased their investments in emerging markets in recent years.
In its report, MSCI pointed out that emerging equity markets have, overall, produced significantly higher returns in recent decades than developed equity markets. Since 1988, investments in emerging markets, measured using the MSCI Emerging Markets Index, have produced an annual return of almost 13 percent. During the same period, investments in developed equity markets produced an annual return of around 7 percent, see figure 2.16. The difference has been particularly large in the period since the year 2000, when the return on developed equity markets was less than 2 percent per year.
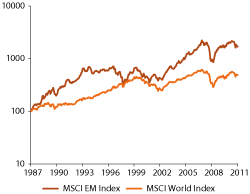
Figur 2.16 Performance of emerging and developed markets, measured in US dollars. (1987=100)
Kilde: MSCI.
MSCI emphasised that investments in emerging markets carry a higher risk. Volatility in these equity markets is greater. MSCI pointed out that, historically, emerging markets have experienced several crises resulting in large equity market losses. Examples include the Asian crisis in 1997, Russia’s default on national debt in 1998 and Argentina’s currency crisis in 2002. Macroeconomic instability and dependence on foreign financing have been highlighted as important causes of these crises.
MSCI’s analysis shows that the country-specific risk is greater in emerging markets than in developed markets. MSCI stated that its indicators relating to macroeconomic risk and the quality of regulation, the enforcement of legislation, and the scope of corruption, freedom of expression, political stability and minority shareholder rights clearly demonstrated a higher risk level in emerging markets.
Overall, MSCI’s analysis shows that the ratio between risk and return, measured by standard deviations in the period since 1988, has been considerably better for emerging equity markets than for global equity markets.
MSCI pointed to high economic growth as an important explanation for why emerging markets have produced higher returns than developed markets. Over the last 10 years, many emerging economies have successfully engaged in economic and financial integration with the global economy.
MSCI’s analyses show that the development of emerging equity markets has become ever more congruent with the development of developed markets. Figure 2.17 shows that the earnings per share of companies listed in emerging markets have been close to the corresponding trend for the world’s listed companies as a whole. Figure 2.17 also shows that the price of equities in emerging markets, measured using the ratio between the price per share and earnings per share, has in recent years been on about the same level as prices in global equity markets generally. This indicates that many of the same driving forces determine developments in both emerging and developed equity markets.
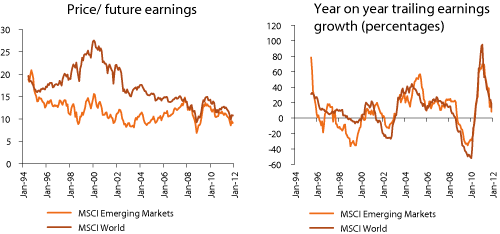
Figur 2.17 Valuation and growth characteristics in emerging markets
Kilde: MSCI.
MSCI pointed out that emerging equity markets have become a central part of the global equity market, and that they constitute a natural part of a global investment portfolio. MSCI also wrote that giving emerging markets a higher weighting than market weighting could be an option for investors who have a good ability to bear short-term fluctuations and who wish to focus the portfolio more strongly on potential long-term economic growth. According to MSCI, the main risk associated with emerging markets is that globalisation will stop or be reversed.
The Ministry has also received advice from Professor Campbell Harvey at Duke University. Harvey analyses expected risk and return in emerging markets, and assesses how large a proportion of a global equity portfolio should be allocated to emerging markets. Harvey has analysed emerging equity markets specifically, but has not considered a potentially higher stake in emerging equity markets in light of the Fund’s overall strategy.
Like MSCI, in his report Harvey wrote that expected returns in emerging markets appear to be higher than returns in developed markets. He linked the higher expected returns with better growth opportunities for emerging markets, but also with higher risk. Larger fluctuations and higher market risk, and the fact that equities may be more difficult to trade, were highlighted as important sources of the overall risk. Harvey takes the view that political risk may provide a basis for a higher expected return, but in his opinion it is not clear that such risk is currently higher in emerging markets than in developed markets. He pointed to the debt situation in Europe in this regard.
Harvey also pointed out that there is a close connection between economic growth and financial development in many emerging countries. When the financial markets are developed, access to capital will normally improve, and the cost of capital will fall. This contributes to increased investment and economic growth. Harvey highlighted that there is a positive historical relation between economic growth and returns in emerging markets over periods of several years; see figure 2.18. According to Harvey, long-term investors should therefore invest a higher proportion in markets in which financial development can contribute to higher growth and returns.
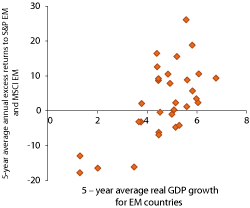
Figur 2.18 Average growth in GDP in emerging economies and excess returns in their stock markets over five-year periods, measured in a common currency
Kilde: Harvey (2012).
Overall, Harvey took the view that a long-term investor like the GPFG is well-positioned to bear the risk associated with investments in emerging markets. He recommended that the Ministry should consider an allocation to emerging markets, as defined in the MSCI index, of around 16 percent.3 This allocation is somewhat higher than indicated by free float-adjusted global market weights. Harvey gave particular emphasis to the Fund’s ability to hold investments for a long time and the positive relation between financial development and economic growth. According to Harvey, investments in emerging markets should not be based solely on global market weights, but also on weights which reflect fundamental indicators, such as GDP.
Harvey also analysed GDP weighting as an alternative to linking the country distribution among emerging markets to market size. He pointed out that stock prices in emerging markets can fluctuate strongly compared to other markets. There may also be a greater incidence of mis-pricing in emerging markets. Harvey wrote that linking the country distribution among emerging markets to GDP would lead investors to sell equities in markets which have risen sharply compared to the country’s GDP, and buy equities in markets which have fallen. If this strategy involves selling equities in markets which have risen too much compared to their long-term values, or buying equities in markets which have dropped below their long-term values, a higher return will be achieved over time.
In its letter of 2 February 2012, Norges Bank recommended that the proportion of equity investments in emerging markets should not be increased beyond market weights. The Bank wrote:
«Norges Bank does not recommend establishing a special allocation to emerging markets beyond what is indicated by market weighting.»
Norges Bank wrote that an analysis conducted by the Bank showed that high growth in a country does not in itself provide a basis for an unambiguous assumption of higher equity market returns. The Bank pointed out that the link between a country’s economic growth and the earnings of the country’s listed companies is weak, and that only growth in excess of expectations can provide a basis for higher future returns adjusted for risk.
Norges Bank also considered which underlying factors may result in higher risk, and thus higher expected returns, in emerging markets. The Bank wrote that risk factors can be linked to stability in governance structures, the regulation of the financial markets, the legal system and quality of legislation, the level of corruption and, ultimately, the danger of expropriation. The Bank also emphasised that, in some cases, foreign investors and the interests of minority shareholders will be poorly protected. It attached weight to the fact that, in some markets, foreign investors are subject to special rules and limitations, and that some countries do not permit full, free capital movements in their currency. In Norges Bank’s view, it is not clear that the Fund has a natural advantage as regards bearing this type of risk, compared to other Funds.
2.3.4 The Ministry’s assessment
The Ministry is of the opinion that global market weights (adjusted for free float) are a logical starting point for the geographical distribution of the GPFG’s benchmark for equities. A market-weighted portfolio reflects the capital available to the Fund in global listed equity markets, and may be regarded as the portfolio of the average global investor. Developments in a market-weighted benchmark will in the Ministry’s view properly reflect developments in the equity market as a whole. The Ministry is of the opinion that a market-weighted benchmark will be a good starting point for open, cost-effective management of the equity portfolio.
MSCI, Norges Bank and Professor Harvey all pointed out that market weighting also has weaknesses which may reduce expected returns. Such weaknesses, and means of exploiting these, are discussed in section 2.7.3. In the Ministry’s view, the Fund’s geographical distribution at the strategic level is rather unsuited to making the adjustments which are necessary to counteract these weaknesses.
The Ministry envisages changing the benchmark for equity so that the geographical distribution tracks global market weights to a greater degree. However, the Ministry has identified two considerations which may indicate that the market weights should be adjusted:
At current equity prices, a switch to global market weighting would mean that the proportion invested in Europe would drop by approximately half. This would be a major change. The Ministry notes that Norges Bank has recommended that the geographical distribution should approach global market weights gradually, and in several stages. The Bank has also pointed out that there may be reasons for the Fund to continue to invest a proportion in Europe in the long-term that is somewhat higher than suggested by market weights.
A switch to global market weighting would have entailed a very high portion invested in the US. Although the world’s companies and financial markets have become increasingly international, country-specific risk should still be taken into account in the geographical distribution of the Fund’s benchmark.
The equity market in the US is very broadly composed. Nevertheless, it must be expected that the performance of companies will be linked, to a significant degree, to the performance of the American economy. This may indicate that the American market should not be assigned a high proportion in the benchmark.
The Ministry notes that MSCI’s analysis shows that there are many similarities between the equity market in the US and the developed equity markets in Europe. The analyses of historical returns show that an adjustment of the distribution between these markets has had little effect on total risk and return. The Ministry therefore sees that the goal of avoiding an excessive portion in the US and the goal of avoiding an excessively sharp reduction in the European portion can be seen in conjunction. Rather than switching over entirely to global market weights for both Europe and the US, the Ministry instead envisages a more even distribution between these markets than is the case today. This means a distribution in which Europe is given a weighting which is lower than at present, but nevertheless somewhat higher than indicated by market weights. The US is given a higher weighting, which is nevertheless lower than market weights.
Currently, the strategic weight of Europe in the benchmark is set at 50 percent, while global market weighting would currently imply a proportion of around 24 percent. The Ministry envisages reducing the European proportion by around 10 percentage points from the current level.
The Ministry considers it appropriate to treat the markets in North America, i.e. the US and Canada, as one. The economies and equity markets of these countries are very closely integrated. Moreover, the Ministry plans to distinguish between developed and emerging equity markets; see the detailed discussion below. Other than an adjustment of developed equity markets in Europe and North America, the benchmark will apply global market weights. Compared to the current distribution, this will mean higher proportions in developed markets in North America, Asia and Oceania, and in emerging markets.
Overall, the new geographical distribution of the equity benchmark will result in a wider geographical diversification of the equity investments than at present. Figure 2.19 shows how the potential new geographical distribution may be, based on market rates at the beginning of 2012. Figure 2.19 also shows that it can be assumed that the sector composition will remain largely unchanged from the current position. No material changes in long-term returns are expected, although the spread of risk will improve.
The principle of market weighting implies that the geographical distribution among different regions will not be fixed, as at present, but will vary in accordance with developments in the different markets. If, for example, the growth in emerging equity markets continues, in a few years market weighting may mean a higher proportion in such markets than at present. Moreover, different price trends in different markets will influence the geographical distribution when market weighting is applied.
Accordingly, there is no basis for stating that the new geographical distribution of the benchmark for equity will mean a specific European portion. The estimates of the European portion which are presented here are based on market prices at the beginning of 2012. There is also no basis for stating that the reduction in the European proportion will be exactly 10 percentage points. Nevertheless, this provides a reasonable picture of the scope of the reduction in the European portion which the Ministry is planning. The Ministry will continue work on introducing a final rule for the European proportion, and will provide a briefing on this issue once the adaptation has been implemented. The proportion invested in Europe is to be reduced gradually over time. New transfers to the Fund will be used to implement the changes. However, it may still be necessary to sell European equities.
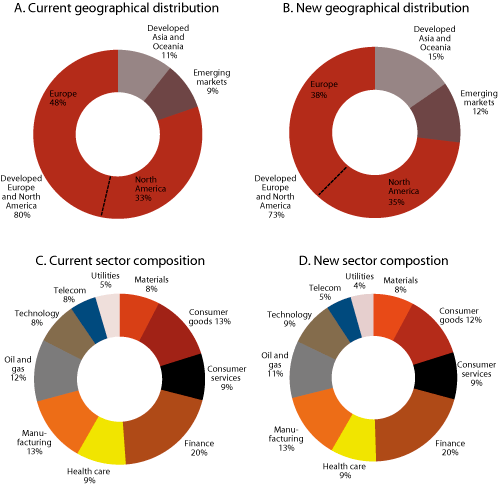
Figur 2.19 Illustration of current and new geographical distribution and sector composition of equities in the GPFG. Based on market prices at the beginning of 2012. Percentages1
1 The distribution and sector composition will vary in line with market trends. In the figure, the proportion of developed markets in Europe has been reduced by 10 percentage points compared to the current weighting.
Kilde: Ministry of Finance.
The changes are based on assessments of the consequences for the risk and return of the portfolio in the long-term. At the same time there is considerable uncertainty related to the market’s development in the short term. One must therefore be prepared for the timing of changes to the benchmark in hindsight appearing as more or less favourable. This risk is somewhat reduced by the fact that the changes take place over time.
At the beginning of 2012, the proportion of emerging markets in the Fund’s benchmark for equity was just over 9 percent, compared to 11.5 percent under global market weighting. The switch to market weighting therefore means an increased emphasis on emerging equity markets, compared to the current distribution.
The Ministry has considered whether the proportion of emerging markets in the benchmark should be higher than the market weight. This assessment is based on the risk and return properties of investments in such markets. In the last 20 years, emerging markets have been characterised by higher returns, but also by greater risks, than developed equity markets. Overall, investments in emerging markets have improved the ratio between risk and return during this period. The increased risk partly reflects the fact that equities in emerging markets are less liquid, partly that stock prices fluctuate more, and partly that companies are more exposed to fluctuations in the world economy. There may also be greater political risk in emerging markets.
Professor Harvey took the view that the Fund’s particularly strong ability to hold investments over long periods means that the Fund is well-positioned to invest in markets which feature low liquidity and large fluctuations. Over time, such risks may produce higher expected returns. For its part, Norges Bank has pointed out that investments in emerging markets involve a risk of instability in governance structures, regulations and rights for international investors, and a risk of corruption and, in extreme cases, expropriation. The Bank therefore takes the view that it is not clear that the GPFG is better positioned to bear this type of risk than other funds, and recommends that the proportion of emerging markets should not be set higher than the market weight.
The analyses and recommendations which the Ministry has received show that opinions vary as to the relationship between returns in emerging equity markets and growth in emerging economies. Looking forward, at least some emerging economies are expected to grow much more strongly than developed economies. Emerging economies already comprise a much larger proportion of the world economy than the weight which would be given to emerging equity markets under global market weighting. An important question is whether this provides a basis for investing a higher proportion in emerging equity markets than the market weight.
The Ministry notes that Professor Harvey found that historically there has been a relationship between long-term growth in emerging economies and returns in emerging equity markets. Harvey described a development process in emerging economies in which high expected growth goes hand in hand with a high risk of crises and setbacks. Investors are paid for this risk in the form of higher expected returns. Over time, companies in emerging equity markets may produce higher returns if the emerging economies succeed in achieving growth and development.
Norges Bank has emphasised that the relation between economic growth and returns on equity is not unambiguous. The Bank examined a broad selection of both developed and emerging equity markets, and found only a weak relation between a country’s economic growth and the earnings of limited companies which are listed on the country’s stock exchanges. One reason for this may be that globalisation makes the companies more dependent on developments in the world economy, and less dependent on developments in the country in which they are listed. Another reason may be that much of the economic growth in a country occurs in businesses which are not listed on a stock exchange.
High growth is expected in many emerging economies in the years ahead. However, high expected growth is no guarantee of high future returns. Investors must be expected to be well aware of growth prospects in emerging economies, and that this is already largely reflected in the equity prices. The Ministry shares Norges Bank’s view that it is only growth in excess of expectations which can provide a basis for higher expected future returns adjusted for risk.
MSCI’s analyses show that the world’s limited companies are becoming increasingly international. Many companies which are listed in developed equity markets have invested considerable sums in emerging economies, and many companies in emerging equity markets have focused their production on sales to developed economies. This development makes it increasingly difficult to specify a particular geographical identity for a company based on the country in which it is listed. The Ministry also notes that, over time, the earnings growth (growth of profit) achieved by emerging and developed markets over time appears to have become more similar. Despite higher GDP growth in emerging economies, growth in earnings per share in the equity markets in these economies has not differed materially from the development in developed equity markets. This seems to indicate that a large part of the growth in these economies is derived from businesses that are not listed or accrue to other entities than the capital owners. In the Ministry’s view, it is therefore uncertain whether a higher weighting than the market weight of listed companies in emerging economies would mean that the Fund participates more in total global value creation and growth.
Following an overall assessment, the Ministry plans to increase the proportion of emerging equity markets in the equity benchmark to market weight. The decision to adopt market weighting of emerging equity markets must be considered in conjunction with the fact that, in this Report to the Storting, the Ministry has also stated its plans to include emerging markets in the Fund’s fixed income benchmark; see the discussion in section 2.2.
The Ministry will return to the question of the proportion of emerging equity markets at a later date. The distinctive characteristics of the Fund, for example its long time horizon and limited need to realise assets quickly, may be expected to confer advantages in emerging markets; see the discussion above. This may indicate that a somewhat higher emerging market proportion should be adopted than suggested by global market weights. However, the same distinctive characteristics may also give the Fund advantages in other areas; see, for example, the discussion in section 2.7. The Ministry will continue to work on assessing different means of exploiting the Fund’s special characteristics. The Ministry considers it natural to begin exploiting the Fund’s special characteristics in areas in which it is clearest that they will generate advantages, and which offer the greatest opportunities to improve the ratio between expected risk and return on the Fund. A new assessment of the emerging equity markets portion will be conducted within a framework of this kind.
2.4 New geographical distribution of the Government Pension Fund Global
Previous geographical distribution
The investment strategy of the Government Pension Fund Global (GPFG) is expressed through the Fund’s strategic benchmark. The benchmark is a detailed description of how the Fund’s capital shoul be invested, if Norges Bank is not to draw on its limits for deviating from the benchmark. The benchmark is split between equities (60 percent), fixed income (35 percent) and real estate (5 percent). It has also been divided into three geographical regions: Europe, America/Africa and Asia/Oceania. Within each region, the investments have primarily been allocated to countries in accordance with relative market size. The Fund’s geographical distribution implicitly determines the currency composition of the Fund.
Until now, the respective regional weights have been 50 percent, 35 percent and 15 percent for equities, and 60 percent, 35 percent and 5 percent for fixed income; see figure 2.20. In other words, more than half of the fund capital has been invested in Europe. The regional weights are the result of a trade-off between various considerations. An important objective linked to the high proportion in Europe has been to reduce the Fund’s exchange rate risk; see the discussion in section 2.3.

Figur 2.20 Previous strategic benchmark for the GPFG1
1 Fixed income has comprised 40 percent. Over time, real estate will comprise up to 5 percent, while the fixed income portion will be reduced to 35 percent.
Kilde: Ministry of Finance.
New geographical distribution
In last year’s report, Report No. 15 (2010–2011) to the Storting – The Management of the Government Pension Fund in 2010, the Ministry concluded that the long-term exchange rate risk appeared to be smaller than previously thought. In its assessment, it wrote that the proportion invested in Europe should be reduced over time. In the case of equities and corporate bonds, it is appropriate for the new distribution to be based on market size (market-weighting), while in the case of government bonds it is more appropriate to use the size of the economies (GDP-weighting). Sections 2.2 and 2.3 of this Report to the Storting contain more detailed accounts of the changes in the geographical distribution of the GPFG’s investments.

Figur 2.21 New strategic benchmark for the GPFG1
1 The plan is for up to 5 percent of the capital of the GPFG to be invested in real estate. These investments will result in a corresponding reduction in the proportion invested in fixed income. At the end of 2011, 0.3 percent of the fund capital was invested in real estate. All of these investments were made in Europe; see the discussion in section 4.1.
Kilde: Ministry of Finance.
Based on market values at the end of 2011, the changes imply, among other things,
a reduction in the European proportion totalling 13 percentage points,
an increase in the emerging markets proportion totalling 4 percentage points,
that the North American proportion will remain below market weight.
Table 2.3 shows the regional distribution of the GPFG under the previous and new benchmarks. The regional distribution under the new benchmark is based on market values at the beginning of 2012. This means that the proportions in the different regions under the new benchmark will depend on market developments and the relative development in GDP.
Tabell 2.3 Regional distribution of the GPFG under previous and new benchmarks. Measured using market values at the beginning of 2012. Percentages
Previous | New | |
|---|---|---|
America/Africa | 35 | 40 |
Europe | 54 | 41 |
Asia/Oceania | 11 | 19 |
Of this: | ||
Emerging markets | 6 | 10 |
Kilde: Ministry of Finance.
2.5 Rebalancing
2.5.1 Introduction
The Ministry of Finance’s long-term strategy for the management of the Government Pension Fund Global (GPFG) specifies a fixed distribution between equities (60 percent), fixed income (35 percent) and real estate (5 percent); see section 2.4. A fixed distribution between three geographical regions has also been applied. The distribution between equities, fixed income and real estate is the result of a trade-off between expected risk and return in these asset classes in the long run. The regional weights are also the result of a trade-off between different interests; see the discussion in section 2.2 (fixed income) and section 2.3 (equities).
Market movements result in the actual assets and regional proportions moving away from the strategic weights. For example, a rise in equity prices compared to the prices of bonds will result in an increase in the equity portion. As a result, the equity portion may rise above the strategic weight of 60 percent, unless Norges Bank sells stocks to counteract this. A higher (or lower) equity portion will alter the risk and return properties of the Fund. It is therefore important to have in place a system which returns the actual weights to the strategic weights.
Rebalancing meets this need. Rebalancing is conducted both gradually using the ongoing transfers of capital into the Fund (referred to as partial rebalancing), and through the purchase and sale of securities (referred to as full rebalancing). Full rebalancing is undertaken if the deviation from the strategic weights is sufficiently large. This is referred to as conditional full rebalancing. The Ministry has laid down detailed rebalancing rules. These detailed rules have been exempted from public disclosure to prevent other financial market participants from predicting the actions of the Fund in a manner which could cause the Fund to incur unnecessary costs.
When selling securities, the Fund incurs transaction costs which reduce returns. The rules governing the size of deviations which must be accepted before full rebalancing is undertaken have therefore been formulated based on a trade-off between the need to bring the weights in the Fund back to the strategic weights and the need to save transaction costs.
The first payment into the GPFG was made in May 1996. At that time, the Fund’s investments comprised only bonds. Equities were included in 1998, with a proportion of 40 percent. In the period 1998–2001, the Fund was rebalanced through the quarterly transfer of capital into the Fund. In 2001, a switch was made to monthly transfers to the Fund. At the same time, new rules were adopted which entailed monthly, partial rebalancing and conditional full rebalancing. The rebalancing rules have remained unchanged since 2001, but were temporarily suspended in connection with the increase in the equity portion from 40 percent to 60 percent in the period 2007–2009. In a separate note, Norges Bank has analysed the experience gained from rebalancing the GPFG.4
Section 2.2 contains a detailed discussion of the new benchmark for the GPFG’s fixed income investments, and section 2.3 contains an account of changes made to the geographical distribution of the GPFG’s equity benchmark. The changes in the investment strategy for the equity and fixed income investments suggest that the rebalancing rules should be amended. In a letter of 26 January 2012, Norges Bank gave advice on such rules. The letter is appended to this Report to the Storting.
2.5.2 The basis for rebalancing
Risk in the equity, fixed income and real estate markets varies over time. For example, figure 2.22 shows that fluctuations in the stock market were smaller in the period 2003–2007 than in the period 2008–2011. In other words, a fixed equity portion does not guarantee a stable risk level in the Fund. The GPFG’s equity portion has been chosen on the basis of analyses of how a fixed equity portion will affect risk and return in the long run.
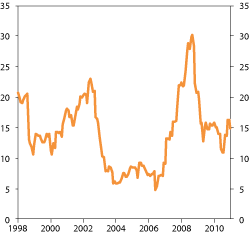
Figur 2.22 The risk in the benchmark for the GPFG’s equity portfolio. Rolling 12-month standard deviation. Percentages
Kilde: Ministry of Finance and Norges Bank.
Expected risk and return in a portfolio which is rebalanced will be different from the risk and return in a portfolio in which equity and regional weights are floating freely in line with how the markets develop. Rebalancing is therefore important to ensure that the Fund’s properties correspond with the long-term strategic choices which have been made and which enjoy widespread support.
Rebalancing involves purchasing equities if the equity market has fallen during preceding periods, compared with bonds. If the drop in the equity market turns into an upturn after rebalancing, the Fund’s results will be improved. If the equity market continues to fall, on the other hand, the Fund’s losses will increase. Thus far, the rebalancing rules have improved the ratio between risk and return in the GPFG; see section 2.5.3.
Risk is often expressed using standard deviation, which is a measure of fluctuations in returns. It is an appropriate way of measuring risk if the probability of achieving a return which is higher than the average equals the probability of achieving a return which is lower. Rebalancing to a fixed equity portion means that the equity investments are reduced during upturns and increased during downturns. The result is that the probability of achieving a very good return is somewhat lower than if no rebalancing was undertaken, and that the probability of achieving a very poor return is increased somewhat; see box 2.7.
Boks 2.7 Why investors rebalance their portfolios
Not all investors can rebalance simultaneously. When some investors buy, others must act as sellers. Many investors may wish to reduce their equity investments during bad times, regardless of expected returns. This may be due to a wish to limit potential losses or a need to move investments into more liquid assets. Such behaviour may, for example, be caused by requirements concerning the size of an investor’s equity capital. It can therefore be said that an investor who rebalances sells insurance against losses to such investors. As in connection with the sale of other types of insurance, rebalancing will generate an insurance premium in return for assuming the risk of a future loss which has a low probability of occurring but which will have severe consequences if it occurs. Accordingly, measures of normal fluctuations in returns, such as standard deviation, will not necessarily be a adequate measure of the risk associated with the strategy. Figures from Norges Bank show that standard deviation has been an adequate measure of return variations during the period for which the GPFG has invested in equities; see box 2.8.
Experience indicates that the equity markets fluctuate more during periods when prices are falling. For an investor with a short time horizon, holding a high proportion of equities in such a situation may appear to increase risk. Moreover, when the markets fall, the willingness of investors to assume risk may disappear quickly. If variation in the equity premium is due to a reduced willingness on the part of short-term investors to assume risk during weak periods, this can be exploited by a long-term investor with a more stable risk appetite. An increased risk in the short term is of minor significance to an investor with a long time horizon. In this case, rebalancing appear to provide a means for long-term investors to purchase equities «cheaply» during weak periods, without significantly affecting the risk associated with the investments in the long-term.
Nevertheless, if equity returns have a tendency to fluctuate around an average, rebalancing may not appear especially risky to an investor with broad diversification and a long time horizon. The investor can then achieve good returns when the market rises again following a downturn, as was the case for the GPFG in 2009. If, on the other hand, falling equity prices in a market reflect a weak long-term trend, the Fund’s long time horizon will not justify a rebalancing strategy. One example of this is the development in the Japanese equity market since 1990.
Norges Bank’s review of the economic literature reveals that a large proportion of the variations in equity prices over time appear to be explained by the fact that the risk premium in the market varies over time in line with economic cycles.5 The risk premium in the equity market expresses how much compensation investors demand for assuming risk.6 Various financial models seek to explain why the price of assuming risk can vary over time; see Cochrane (2011).7 Investors may, for example, suffer significant drops in labour income during a downturn. They therefore wish to avoid investing in equities which fall by more than the average during downturns. This is then reflected in prices. Another example of a factor which can cause the risk premium in the equity market to vary over time is liquidity fluctuation. There is reason to assume that the risk premium depends on how liquid the equities are. Liquidity in the equity market tends to vary with economic cycles, meaning that liquidity is low during downturns.
If the risk premium varies with economic cycles, rebalancing to a fixed equity portion will mean systematically increasing the equity investments precisely when the expected returns are high. Rebalancing may therefore be a means of exploiting time-variation in the risk premium.
Time-varying risk premiums were a topic at the Investment Strategy Summit 2011; see box 2.9 in section 2.7. At the seminar, it was pointed out that the Fund’s rebalancing rules have a disciplinary effect on the Fund’s distribution among asset classes and risk-taking, are counter-cyclical, and help to exploit time-varying risk premiums. A key question is whether the GPFG could and should exploit time-varying risk premiums more than at present. The following conclusions can be drawn from the discussion at the seminar:
The current rebalancing rules can probably be expanded to exploit more of the potential for counter-cyclical investments in the GPFG, but it is likely that this would mean increased risk.
If efforts were to be made to exploit time variations in risk premiums beyond a fixed rebalancing rule, this would probably require changes to the current governance structure, including by giving Norges Bank more room to alter the Fund’s exposure to equity market risk.
«Buy low and sell high» is a sensible investment principle, but difficult to implement in practice.
Minutes of the seminar are available on the Ministry’s website (www.regjeringen.no/spf).
2.5.3 Rebalancing experience
Norges Bank has analysed how changes in the actual benchmark have affected risk and returns in the Fund since 1998. The Bank has also compared quarterly rebalancing with the rebalancing rules which currently apply to the GPFG.
The analyses show that rebalancing has resulted in higher returns and lower risk in the period 1998–2011; see box 2.8. They also show that going from quarterly to conditional rebalancing has increased returns, but also that it has resulted in a certain increase in the deviation between the actual and strategic equity weights. For its part, partial rebalancing has helped to reduce the deviation between the actual and strategic equity weights, albeit at the price of somewhat lower returns (0.1 percent).
Boks 2.8 Experiences of rebalancing the GPFG
Norges Bank has analysed how changes in the actual benchmark have affected risk and return in the Fund since 1998, compared with two alternative portfolios in which equities and regional weights have been allowed to float freely with market trends. The one alternative portfolio has an equity portion of 60 percent, while the other has a equity portion of 40 percent. This corresponds to the current strategic equity portion and the equity portion which the GPFG had in January 1998.
Figure 2.23 shows the development of the equity portions of the actual GPFG benchmark and of the alternative portfolio with a 40-percent equity portion in 1998, without subsequent rebalancing.
The analysis shows that the actual benchmark, which is rebalanced, has achieved higher returns (both before and after costs), than the two alternative portfolios; see table 2.4. At the same time, the returns achieved by the actual benchmark have varied less than the returns achieved by the alternative portfolios. The ratio between risk and return is a measure of the risk-adjusted return, and in table 2.4 is expressed using the «Sharpe ratio». It is clear that risk-adjusted returns are higher in the case of the actual benchmark than in the case of the alternative portfolios.
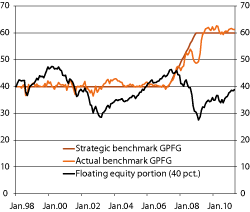
Figur 2.23 The development of the equity portions of the actual GPFG benchmark and of an alternative portfolio with a 40-percent equity portion in January 1998, without subsequent rebalancing. Percentages
Kilde: Norges Bank.
Tabell 2.4 Comparison of the actual GPFG benchmark with two alternative portfolios with equity portions of 40 and 60 percent, respectively, without subsequent rebalancing. Percentages
Actual benchmark with rebalancing | Portfolio with floating weights, initial equity portion 40 percent | Portfolio with floating weights, initial equity portion 60 percent | |
|---|---|---|---|
| Gross annual return | 3.9 | 3.5 | 2.9 |
| Net annual return | 3.9 | 3.5 | 2.9 |
| Annual standard deviation | 8.4 | 11.0 | 13.1 |
| Annual turnover rate1 | 11.7 | 0.0 | 0.0 |
| Sharpe ratio2, gross (=A/C) | 0.47 | 0.31 | 0.22 |
| Sharpe ratio2, net (=B/C) | 0.46 | 0.31 | 0.22 |
1 The turnover rate expresses how large a proportion of the portfolio is replaced every year.
2 The Sharpe rate is defined as the return in excess of a risk-free interest rate, divided by risk measured as standard deviation.
Kilde: Norges Bank.
Norges Bank also compared quarterly rebalancing with the current rebalancing rules. The actual benchmark was compared with a portfolio which is completely rebalanced every quarter.
The results show that the current rebalancing rules have produced a higher return than quarterly rebalancing, also after they are adjusted for differences in risk; see table 2.5. The change in 2001 from quarterly to conditional rebalancing has thus helped to increase the Fund’s returns. At the same time, it is clear that partial rebalancing has reduced the return by 0.1 percentage points. This occurred despite the fact that partial rebalancing reduces the transaction costs associated with rebalancing. Norges Bank assumes that this is due to the fact that frequent purchases of securities in an asset class which produces weak returns will reduce the total return of the Fund.1
The table shows that the deviation between the equity portion which follows from every rebalancing regime and the strategic equity portion is less when quarterly rebalancing is undertaken than under the current rebalancing rules. Partial rebalancing further reduces the average deviation from the 60 percent equity portion.
Standard deviation is an adequate risk measure if the return is normally distributed. Figures for skewness and kurtosis show that the distribution of returns has closely followed a normal distribution during the period.2
Tabell 2.5 Comparison of conditional and quarterly rebalancing of the GPFG, with and without partial rebalancing. Percentages
Actual rebalancing rules | Quarterly rebalancing | |||
|---|---|---|---|---|
with partial rebalancing | without partial rebalancing | with partial rebalancing | without partial rebalancing | |
A. Gross annual return | 3.9 | 4.0 | 3.7 | 3.8 |
B. Net annual return | 3.9 | 4.0 | 3.6 | 3.7 |
C. Standard deviation per year | 8.4 | 8.5 | 8.6 | 8.6 |
Annual turnover rate | 11.7 | 17.7 | 12.2 | 23.2 |
Sharpe ratio, gross (=A/C) | 0.47 | 0.47 | 0.42 | 0.44 |
Sharpe ratio, net (=B/C) | 0.46 | 0.47 | 0.42 | 0.43 |
Average deviation from strategic equity portion (60 percent) | 1.5 | 1.8 | 0.6 | 0.9 |
Properties of the return distribution | ||||
Skewness | -0.06 | -0.11 | -0.13 | -0.11 |
Kurtosis | 3.37 | 3.52 | 3.59 | 3.59 |
Kilde: Norges Bank.
1 Studies show that investment strategies which entail buying stocks which have produced a high return in the last 3–12 months and selling stocks which have produced a low return over the same period creates a risk-adjusted additional return (referred to as momentum); see Jegadeesh, N. and S. Titman (1993), “Returns to Buying Winners and Selling Losers: Implications for Stock Market Efficiency.” Journal of Finance, 48.
2 The normal distribution has skewness equal to 0 and kurtosis equal to 3. Statistical tests cannot reject the hypothesis that the returns on some of the portfolios are normally distributed. Skewness describes the degree of symmetry in a distribution. A positive or right-skewed distribution has limited downside and large upside, while the opposite is true for a negative or left-skewed distribution. Kurtosis is a measure of the heavyness of the tails of the distributions. If the return series has fat or heavy tails, expected return remains that of the normal distribution, but there is a higher probability for both high and low returns. Statistical tests cannot reject the normality assumption for either of the portfolios.
2.5.4 Advice from Norges Bank
In its letter of 26 January 2012, Norges Bank gave advice on the formulation of new rebalancing rules for the GPFG. The Bank’s starting point is that the rebalancing rules should support the objective of achieving the best possible ratio between risk and return for the Fund.
Until now, the strategy for the GPFG has adopted fixed geographical weights for the Fund’s equities and fixed income investments at a regional level; see section 2.5.1. Norges Bank has pointed out that research results show that risk premiums on equities and fixed income investments vary over time. According to the Bank, the Fund’s special characteristics provide an opportunity to exploit such time-varying risk premiums by pursuing a counter-cyclical investment strategy under which an asset class is bought when the prices reflect increased uncertainty.
Norges Bank’s has pointed out that rebalancing strategies have produced higher risk-adjusted returns than strategies under which the asset weights follow market developments. The Bank takes the view that systematically returning asset classes to fixed weights through rebalancing is an investment strategy for the Fund which should be continued.
In Norges Bank’s opinion, new rebalancing rules should ensure that rebalancing is governed by rules and implemented as an ordinary part of the strategy without requiring separate decisions. Norges Bank has proposed that a publicly available rebalancing rule should be included in the GPFG’s mandate.
Norges Bank takes the view that the basis for the current regional weights is weak, and that consideration should be given to whether it is appropriate to retain the current structure. The Bank took the view that there is limited potential for exploiting variations in regional risk premiums through rebalancing. Rebalancing should therefore be undertaken at the asset-class level. According to the Bank, a rebalancing strategy which aims to maintain a fixed equity portion will seek to exploit variations in the equity market’s risk premium. Accordingly, Norges Bank has proposed a rule on the rebalancing of the Fund’s equity portion.
The strategic equity portion is currently 60 percent. A key question is how much the equity portion should be permitted to deviate from this figure before rebalancing is implemented. Norges Bank’s analyses show that rebalancing has been important for the Fund’s risk and return, but that, in isolation, the condition which determines when rebalancing must be implemented has been less important. The Bank has stated that it is difficult to set a correct level for deviations based on historical data.
Following an overall assessment, Norges Bank has proposed setting a band of three percentage points on either side of the strategic weight assigned to equity in the benchmark. This means that rebalancing will be implemented if the equity portion falls below 57 percent or exceeds 63 percent. Norges Bank has proposed that the equity portion should be rebalanced to the fixed weight of 60 percent at quarter-end if the proportion has fallen outside these limits for one day during the quarter in question.
According to the bank, a rule of this kind would mean lower transaction costs and a equity portion which is closer to the strategic weight than under the current rules. The proposal would result in somewhat more frequent rebalancing than at present, but each individual rebalancing would be less comprehensive. Norges Bank has pointed out that this would reduce the market impact and transaction costs.
Norges Bank has proposed that partial rebalancing be phased out, referring to the fact that there is uncertainty about the effect of partial rebalancing on the Fund’s total return over time. This is because periods of high or low returns in the equity market tend to continue («momentum»). It may therefore be profitable to wait for a certain period before undertaking rebalancing. The Bank’s analyses show that partial rebalancing has resulted in a poorer ratio between risk and return than a strategy which does not include partial rebalancing. Norges Bank has also pointed out that phasing out partial rebalancing would simplify the calculation of the benchmarks and ensure greater transparency about the management of the Fund. The proposal means that, when new capital is transferred to the Fund, the investments will be distributed based on the existing distribution between equity and fixed income. Currently, new capital is transferred to the asset class which has produced the weakest return in the preceding period.
Norges Bank wrote that its advice could be implemented from 1 July 2012.
2.5.5 The Ministry’s assessment
The Ministry would like to point out that the rebalancing rules have been an important part of the GPFG’s investment strategy. The rules have had the objective of ensuring that, over time, the risk in the Fund does not deviate significantly from what is established through the choice of the Fund’s long-term allocation between asset classes and regions. The rebalancing rules have something of a counter-cyclical nature, as the Fund sells assets whose value has risen relatively sharply and purchases assets which have fallen in value.
The experiences of rebalancing the GPFG have been positive. Norges Bank’s analyses show that rebalancing contributed to a better ratio between risk and return in the period 1998–2011, compared to an investment strategy which excludes rebalancing. The Ministry would also point out that there is no guarantee rebalancing rules will be equally advantageous in future.
When assessed on the basis of the ratio between risk and return, rebalancing will be profitable if returns vary around an average, for example as a result of time-varying risk premiums. Research indicates that there are time variations in the market’s risk premium.
One consequence of following a rule which means that the Fund increases its investments in falling markets and reduces its investments in rising markets is an increase in the probability of large losses. Such losses may arise if a market falls over time without rebounding, or if a permanent, lower market level is established. In such cases, rebalancing will be unfavourable. If the Fund includes a significant element of this type of risk, the measurement of risk by means of standard deviation will not be a completely adequate measure of the risk in the Fund. Nevertheless, the Ministry has noted that standard deviation has been an adequate measure of the price variation for the GPFG’s portfolio during the period the Fund has invested in equities.
Following an overall evaluation, the Ministry agrees that a systematic return of the asset classes to fixed weights by means of rebalancing should be continued, as proposed by Norges Bank.
Norges Bank takes the view that rebalancing should be governed by rules and implemented as an ordinary part of management operations. In the Bank’s opinion, the rebalancing rule should be public, and set out in the GPFG’s mandate. The Ministry attaches weight to the consideration that a publicly accessible rebalancing rule will contribute to greater transparency about the management of the Fund.
The choice of the equity portion is the decision which has the greatest significance for risk and return in the Fund. The Ministry is therefore of the opinion that it is logical to have a rebalancing rule which brings the equity portion back to the strategic weight of 60 percent. A rebalancing strategy which aims to maintain a fixed proportion of equities relative to fixed income and real estate may also be a way of exploiting systematic variations in risk premiums.
The Ministry would like to point out that the new benchmark for the Fund’s fixed income investments and plans for a new geographical distribution of equities imply a departure from a strategy based on fixed regional weights; see the discussion in sections 2.2 and 2.3. This is consistent with Norges Bank’s recommendation that there should be no more rebalancing in line with fixed regional weights. At the same time, the Ministry would point out that phasing out rebalancing to fixed regional weights may make rebalancing somewhat less counter-cyclical than the current strategy, as the GPFG will no longer buy (sell) the equity markets which have experienced the weakest (strongest) relative development. On the other hand, the new benchmark for the Fund’s fixed income investments envisages monthly rebalancing back to GDP-weights in the government part of the benchmark, and between the government and corporate parts of the benchmark.
Norges Bank has recommended that the current rebalancing regime should be simplified by phasing out partial rebalancing. It has also recommended that the band for rebalancing be set to plus/minus three percentage points. The Ministry will continue to work on the details of the formulation of the rebalancing rules, including the question of how one may secure an increased openness about the rules for rebalancing, the band width and the system of partial rebalancing. The Ministry plans to provide a more detailed presentation on the new rebalancing rules in the National Budget in the autumn of 2012.
2.6 Potential effects of climate change on the investment strategy
2.6.1 Introduction
In Report No. 15 (2010–2011) to the Storting – The Management of the Government Pension Fund in 2010, the Ministry discussed the main report from an international research project of the long term consequences of climate change for global capital markets. The study was a cooperation project involving the consultancy firm Mercer and 14 large institutional investors in Europe, North America, Asia and Australia. Several other institutions were also involved, such as the Grantham Research Institute on Climate Change and the Environment at the London School of Economics, the International Finance Corporation (part of the World Bank Group), the company Carbon Trust and a selection of experts on environmental economics from the private sector and academia.
The discussion in last year’s Report to the Storting was based on the main project report, which Mercer presented in London on 15 February 2011. In the Report to the Storting, the Ministry wrote that Mercer would prepare a separate report on the climate risk associated with the investments of the Government Pension Fund Global (GPFG), based on the results of the main report. It is this report which is discussed here.
2.6.2 Mercer’s assessment
In the report, Mercer analyses the GPFG’s sensitivity to climate risk, and opportunities to reduce risk through climate-related investments over the course of the next 20 years. The report discusses possible consequences for the GPFG’s investments in equity, fixed income and real estate in light of the results described in the main report from 2011.
Mercer writes that the analysis of the significance of climate change for funds like the GPFG is associated with great uncertainty. The effects of future climate change are uncertain, and this uncertainty is reinforced by the fact that the changes must be analysed for a period stretching several decades into the future. Mercer also writes that the analysis is limited to potential effects of climate change alone. Other long- term trends, such as demographics and the emergence of new economies and markets, may have other effects on risk and return in the capital markets. Mercer therefore stresses that caution should be exercised about attaching too much weight to quantitative analyses of the effect of climate change on the capital markets.
Rather than describing a likely development, the analysis is based on four different climate change scenarios and policy responses. The scenarios range from «Stern Action», in which all states introduce effective, coordinated measures to counter emissions, to «Climate Breakdown», in which global warming increases without material intervention by the authorities. Two intermediate scenarios are «Regional Divergence», in which only some states introduce effective measures to counter emissions, and «Delayed Action», which is characterised by few political measures in the first 10 years but drastic, global measures during the next 10-year period as a result of accelerating global warming.
The report calculates that «Delayed Action» would result in a return on the Fund in the next 20 years which, on average, is about 0.4 percentage points lower per year than a reference alternative which does not include any form of climate risk. The most important source of the reduced return is the Fund’s sensitivity to global equity markets, which will be moderately negatively affected in this scenario. In the other three scenarios, the expected return is affected less, or even positively («Stern Action» scenario).
The report contains advice on changes to the investment strategy which are conditional upon which of the four scenarios investors consider most probable. According to Mercer, if the GPFG were to place emphasis on the «Delayed Action» and «Stern Action» scenarios, it should, among other things, invest more in companies which develop or use new climate-friendly technology. This also applies to some degree to the «Regional Divergence» scenario. If, on the other hand, «Climate Breakdown» is assumed, such investments would have the opposite effect, reducing expected returns. Mercer therefore writes that investors have to evaluate the probability of the different scenarios before turning the advice into concrete investment decisions. Mercer’s own view on the probabilities of the four scenarios is that «Regional Divergence» is most likely, and «Climate Breakdown» is least likely.
Against this backdrop, Mercer recommends that the GPFG increases its investments in asset classes which are expected to perform better, relatively speaking, than other asset classes in the most likely scenarios. In addition to investments in climate-friendly technology, these assets classes are climate-friendly infrastructure, real estate and unlisted companies. Investments in forestry and agriculture and «green bonds» are also mentioned in this context. However, Mercer also points out that it may be difficult for a fund as large as the GPFG to invest in some of these markets, as they remain relatively small.
The report also recommends that the GPFG takes account of climate risk in its active fund management, in its exercise of ownership rights, and in its planned real estate investments. A further recommendation is that the GPFG closely monitors international climate policies which may affect the capital markets, and that the Fund continues to support research on the link between climate risk and capital returns.
2.6.3 The Ministry’s assessment
Analysing the potential effects of climate change is important for various aspects of the management of the Government Pension Fund:
The calculations of how climate change may affect the Fund’s risk in the long-term contributes to a better understanding of the Fund’s risk.
The discussion of new investment areas identifies the alternatives which are available for altering the link between climate change and the Fund’s expected results.
The advice to safeguard environmental considerations through the exercise of ownership rights and active fund management, and in the construction of a portfolio of real estate investments, supports existing measures taken in the management of the Fund.
The GPFG’s investments are spread across several asset classes, countries and sectors. This reduces the Fund’s vulnerability to different types of risk, including climate change. Mercer analyses the potential effects of climate change on returns and risk in the GPFG. Major uncertainty means that it is not possible, based on Mercer’s calculations, to draw concrete conclusions about the consequences for the Fund’s future returns. Nevertheless, the analyses are a useful contribution to efforts to improve the understanding of how climate change may affect the Fund’s risk and return.
Some of the investments recommended by Mercer, such as private equity, lie outside the boundaries of the GPFG’s permitted investments. Investments in private equity and infrastructure were considered in Report No. 15 (2010–2011) to the Storting. The Ministry concluded that it was uncertain what such investments would yield in terms of excess returns, particularly due to high management costs. The Ministry therefore stated that it would gather experience in unlisted real estate investments before potentially including new types of unlisted investments. The Ministry also stated that such investments could be considered at a later date. The Storting supported this approach. Investments in forestry and agriculture have so far not been deemed relevant for inclusion.
The advice to take climate risk into account in the active management supports the Fund’s existing management measures.
Climate change is one of the priority areas for Norges Bank’s exercise of ownership rights, and the Bank has cooperated with other investors for several years in relation to companies’ handling of climate risk. Norges Bank’s efforts are aimed at sectors which are responsible for a high proportion of global greenhouse gas emissions, and which will be particularly strongly affected by regulations which attach an economic cost to greenhouse gas emissions. This includes sectors such as mining, cement, chemicals, oil and gas, manufacturing, power production, transportation and real estate.
As a result of the evaluation of the ethical guidelines undertaken in 2009, an environment-related investment programme was introduced in the GPFG. These investments will normally amount to NOK 20–30 billion, and are among Norges Bank’s active management mandates; see the discussion in Report No. 15 (2010–2011) to the Storting. The Bank had 10 mandates under this programme at the end of 2011. Seven of the mandates were within renewable energy and energy efficiency technology, while three mandates were in water management. See more detailed discussions of the results achieved by the climate-related investments in section 4.1.
The mandate for Norges Bank’s management of the Fund’s real estate investments states that the Bank must emphasise energy efficiency and water consumption, among others. This is consistent with the advice received from Mercer.
The report by Mercer will be an important contribution to the further development of the investment strategy and the assessment of climate risk.
Mercer’s report is the result of cooperation between Mercer and 14 large institutional investors from four continents. This is the first time that these investors have come together to analyse the long-term consequences of climate change on global capital markets. However, there is a need for further research on the impact of structural environmental and societal trends on long-term asset returns. Participation in research projects will therefore continue to be a priority for the Ministry.
Research is one of the main elements of the Ministry’s responsible investment strategy. As a large owner and international investor, the Ministry can influence the research agenda on ESG-issues. The Ministry’s involvement in the Mercer report is one example of how research can be employed in the work on responsible investment practices.
2.7 Some topics for the further development of the investment strategy
2.7.1 Introduction
The investment strategy of the Government Pension Fund Global (GPFG) has been developed gradually. This has allowed broad support to be secured for the investment strategy. The experiences gained thus far show that the strategic choices have been robust during periods of significant unrest in the financial markets.
In its efforts to develop the GPFG’s investment strategy further, the Ministry draws on external advice and analyses. The Ministry also wishes to ensure that important aspects of the strategy are debated publicly. In the autumn of 2011, the Ministry and the Strategy Council for the GPFG arranged a seminar on key issues related to the future investment strategy. The seminar was intended to contribute to such debate; see box 2.9.
The choice which plays the largest part in determining the overall risk of the Fund is the choice of equity portion. Comparisons show that the GPFG’s equity portion is in line with the equity portions of other large international funds, taking into account both the listed and unlisted equities held by these funds. At the same time, the GPFG has various special characteristics which distinguish it from most other funds. The Fund has a very long time horizon, and has no clearly defined liabilities. Moreover, it is highly unlikely that the state will need to withdraw large sums from the Fund over a short period of time. These special characteristics give the Fund a greater ability to bear risk than many other investors. From this perspective, the Fund’s overall risk level currently stands out as moderate.
Much of the Fund’s risk is already concentrated on equity-market risk. This makes it natural to look for other sources of risk premiums in the further development of the strategy. By investing the fund capital in such a manner that the returns depend on several types of risk, a better diversification of risk is achieved. It is natural to emphasise forms of risk which the Fund is particularly well-positioned to bear.
The basis for adapting the investment strategy in line with the Fund’s advantages is described in more detail in box 2.10.
The management of the Fund is based on a strategic benchmark. This benchmark is largely based on the principle of market weighting. In the case of equities, this means that each individual company is included in the index with a weighting corresponding to the market value of the equities in the company relative to the value of the equity market as a whole.
In Report No. 15 (2010–2011) to the Storting – The Management of the Government Pension Fund in 2010, the Ministry described the work related to the potential of a larger role for systematic risk factors in the management of the Fund. Such risk factors are defined relative to market weights. For example, a portfolio with a higher portion of equities in small companies than indicated by market weights will be more exposed to fluctuations in the return of equities in small companies. This is called exposure to the small-cap risk factor.
Exposure to systematic risk factors has produced higher returns over time. For example, stocks in small companies have been proven to produce higher returns over time than stocks in large companies; see box 2.10. It is common to think that this additional return reflects a payment for higher risk. The additional return is therefore often described as a risk premium. By increasing the exposure of the Fund to selected systematic risk factors, the Fund may achieve higher returns over time. This is called harvesting systematic risk premiums.
In Report No. 15 (2010–2011) to the Storting, the Ministry pointed out, among other things, that the Strategy Council for the GPFG takes the view that it is appropriate for a fund with the GPFG’s long time horizon to exploit the risk premiums associated with liquidity and value. The Ministry also wrote that Norges Bank’s strategy plan for the period 2011–2013 may indicate an increase in the Fund’s exposure to the value premium. An increased focus on different sources of systematic risk is also consistent with the recommendations made in 2009 by Professors Ang, Goetzmann and Schaefer and with the report of the Strategy Council 2010.
Work on assessing the Fund’s exposure to systematic risk factors is a long-term effort. During 2011, this has included the following:
Less liquid investments were a topic at the Investment Strategy Summit with the Strategy Council held in November 2011; see box 2.9.
In its letter to the Ministry of Finance of 2 February 2012, and in separate discussion notes8, Norges Bank has discussed how the Fund’s equity portfolio can be exposed to different risk factors. This is discussed in greater detail in sections 2.7.2 and 2.7.3.
Boks 2.9 Investment Strategy Summit with the Strategy Council for the GPFG
The Ministry of Finance makes use of a Strategy Council comprised by external members in its work with the investment strategy for the GPFG. The purpose of the Strategy Council for the GPFG is to evaluate the Ministry’s work as well as to contribute with professional input for the further development of the Fund’s investment strategy.
Professor emeritus of finance Elroy Dimson (London Business School), headed the Council’s work in 2011. Other members were Managing Director Antti Ilmanen (AQR Capital Management), Senior Analyst Øystein Stephansen (DNB) and Professor and Rector Eva Liljeblom (Hanken Svenska Handelshögskolan). In 2011, the Strategy Council was given the task to arrange a seminar on important issues for the work with the further development of the investment strategy for the GPFG. This investment strategy summit took place on 8 November 2011 with a wide attendance by the finance sector and academia.
The three main themes of the summit were less liquid investments, time variations in risk premiums and investments in emerging markets. Less liquid investments are discussed in this section, while time variations in risk premiums are mentioned in section 2.5 on rebalancing. Investments in emerging markets are discussed in sections 2.2 and 2.3.
In addition to the members of the Strategy Council, the following had a role as moderator or panel participant during the seminar: Dr. David Chambers (Cambridge University), Professor Roger Ibbotson (Yale University), Professor Andrew Ang (Columbia University), Professor Rajnish Mehra (Arizona State University), Dr. Sung Cheng Chih (Government of Singapore Investment Corporation), Professor Campbell Harvey (Duke University) and Professor Arne Jon Isachsen (Handelshøyskolen BI).
The papers and a summary of the seminar are available on the Ministry’s website (www.government.no/gpf).
Boks 2.10 The market portfolio and the investors’ distinctive characteristics
The capital asset pricing model is a well-established model for the pricing of risky assets. In the model, all investors prefer to compose their portfolios of risky assets such that they constitute a portion of the total global capital. A portfolio of such composition is the theoretical market portfolio.
The capital asset pricing model illustrates in a simple way the idea that the expected return on a stock should be higher the more risky the equity is. The starting-point of the model is that investors are able diversify their risks in a good way. The relevant risk in the model, therefore, is not the fluctuations of a stock price seen in isolation, but to what degree the return on the stock fluctuates in line with the return of the market portfolio. This is called the stock’s systematic risk.
The capital asset pricing model is based on very simplified assumptions as to investors and the functioning of the financial markets. The model has one form of systematic risk only, and this risk is reflected in the market portfolio. Thus all investors will prefer to compose their portfolios of risky assets in the same way, namely like the market portfolio. In this respect, the capital asset pricing model provides a simple recipe for fund investments in which there is no room for investors’ special characteristics.
However, research on historical equity return indicates that the capital asset pricing model does not fully describe how investors act or how the financial markets work. Over time, stocks in small companies have produced a higher return than stocks in large companies, for example. This excess return is called the size premium. It also turns out that stocks in companies in which the market value is relatively low when assessed through key figures like the company's earnings, dividends or book value have produced a different and over time higher return than stocks in companies in which the market value is relatively high. This is called the value premium. Other factors that may explain the risk and return of an investment in a systematic way have proved to be momentum, volatility and liquidity. These three factors are related to short-term historic return, short-term value fluctuations and how liquid an investment is. The explanatory factors highlighted in this section are often called systematic risk factors; see the report that professors Ang, Goetzmann and Schaefer wrote for the Ministry in 2009. The report is available on the Ministry’s website (www.government.no/gpf).
Historic equity returns may to a certain extent be explained by developments in various systematic risk factors. However, no broad agreement among investors or in academia on how stable the factors are or why they have produced a different and higher return has been established. Depending on the perspective applied, the factors are called equity characteristics, investment styles or irregularities in the functioning of financial markets.
The fact that systematic risk factors exist seems to indicate that investors have a more nuanced view of the properties and risks of investments than that which is reflected in the capital asset pricing model. On this basis, an investor may find it favourable to deviate from the market portfolio in order to take account of its special characteristics. The payment one receives in the form of a risk premium will depend on how demanding it is on average for investors to bear such a risk. Not all investors are equally suited to bear all forms of risks, however. If one is better suited than the average investor to bear a certain form of risk, one should consider to take more of this form of risk than that which follows from the market portfolio. In this manner, investors may achieve a better ratio between expected return and risk.
2.7.2 The liquidity premium
Investments which are difficult to trade (less liquid), normally have to offer a higher expected return to attract investors. The liquidity premium compensates for this. It is also linked to the fact that the value of such investments tends to fall sharply during weaker periods.
It is fairly unlikely that the state will need to withdraw large sums from the Fund over a short period of time; see the discussion in section 2.1. This means that the Fund is well-positioned to exploit that less liquid investments produce higher expected returns. The GPFG can benefit from this in several ways:
by investing in less liquid asset classes,
by investing in less liquid securities within each individual asset class,
by investing in less liquid securities during periods in which other investors are demanding more liquid securities.
Unlisted investments such as real estate, private equity and infrastructure are examples of asset classes which are generally less liquid than listed equity. The market for real estate is the largest and most developed of these markets. In 2008, the Ministry of Finance decided that, over time, up to 5 percent of the GPFG’s capital is to be invested in real estate.
In Report No. 15 (2010–2011) to the Storting, the Ministry considered whether the GPFG should be permitted to invest in private equity and infrastructure. At that time, the Ministry pointed out that there is significant uncertainty as regards what return investors can achieve on such investments, taking into account the risk and costs associated with them. The Ministry concluded that experience should first be gained from investments in real estate, but that the Fund’s special characteristics make it natural to return to the question of private equity and infrastructure at a later date.
Another way to increase the scope of less liquid investments in the Fund is to increase the proportion of less liquid listed equities. During the Investment Strategy Summit, Professor Roger Ibbotson pointed out that a portfolio of listed equity which systematically gives greater emphasis to less liquid stocks has produced a significantly higher return over time, without materially altering the portfolio risk properties facing a long-term investor. At the same time, Ibbotson emphasised that it is difficult to define and isolate the liquidity properties of an equity. An investor seeking to exploit the fact that a premium is paid on less liquid investments should therefore consider this premium together with other risk premiums.
A third way to harvest risk premiums is to invest in relatively less liquid securities during periods in which other investors are demanding more liquid securities. Many investors may have to sell equities after they have fallen sharply in value, for example because of regulatory requirements, as seen during the global financial crisis. Investors will then often replace equities with government bonds, which generally carry less risk and are more liquid. A fund like the GPFG can exploit this by selling bonds and purchasing equities in such situations. Developments during the financial crisis provide one example of the fact that risk premiums can vary over time. Time variation in risk premiums is discussed in more detail in section 2.5 on rebalancing.
2.7.3 Other systematic risk premiums
The starting point for Norges Bank’s analyses and assessments of systematic risk premiums is that the Fund’s strategic benchmark for equity is based on the principle of market weighting. This does not necessarily give the Fund an optimal ratio between risk and expected returns; see box 2.10. In its letter to the Ministry of Finance of 2 February 2012, Norges Bank wrote that:
«A global market-weighted benchmark index will not necessarily offer the best possible trade-off between risk and return for a fund such as the Government Pension Fund Global. The investment strategy should therefore be designed in such a way that the Fund can harvest risk premia dynamically, and the portfolio can be constructed in ways that build on its natural advantages.»
Regarding the Fund’s advantages, the Bank wrote:
«The combination of a long time horizon, no short-term liquidity requirements and a patient owner means that the Fund may be particularly well-suited to taking on certain types of risk. This will, above all, be the case in periods of great uncertainty about future returns.»
In a separate note, Norges Bank has analysed the importance of several known risk factors in the equity market.9 In the note, the Bank pointed out that exposure to each of these risk factors has produced higher returns over time. At the same time, there is a risk of significantly lower returns over longer periods than under market weighting. The note emphasised that a strategy focused on exploiting systematic risk premiums in the equity market requires the investor to be able to bear periods of lower returns.
Norges Bank’s analyses show that there are different ways of harvesting systematic risk premiums. Doing this in an effective manner requires investment strategies which are adapted to each individual risk factor.
The note stated that there is little correlation between fluctuations in different systematic risk factors. This offers an opportunity to diversify risk. Norges Bank pointed out that simultaneous exposure to a wide range of risk factors reduces fluctuations in overall returns. This also reduces the risk of periods of very low returns.
The analyses conducted by Norges Bank also show that it is difficult to isolate each individual risk factor operationally. If there is exposure to one risk factor, there will generally also be some degree of exposure to other risk factors. The note argued that a strategy which aims to exploit systematic risk premiums must therefore take account of both direct and indirect risk exposure, and that this should be done as part of an integrated risk-taking and risk-control process.
In the analysis of the risk factor associated with liquidity, it was pointed out that this is a type of risk which the GPFG is well-positioned to bear. However, in the context of the equity market, it was recommended that this risk be assumed indirectly, through other risk premiums like size, value and volatility, because the liquidity factor is difficult to define and isolate; see the discussion in section 2.7.2.
In its letter of 2 February 2012, Norges Bank recommended that systematic risk premiums should be exploited in the management of the GPFG. The Bank is of the opinion that this can best be done as part of the operational management, rather than by changing the strategic benchmark. The Bank wrote:
«Norges Bank believes that the strategic benchmark index should not be adjusted to take account of systematic risk premia for equity investments.»
In another note, Norges Bank has analysed various alternative weighting principles for a market-weighted benchmark.10 One example of such an alternative weighting principle is a «fundamental index». In such indices, every individual company in the index is assigned a weight corresponding to the company’s size as measured in accordance with «fundamental» variables such as turnover, earnings or the number of employees. Another example of an alternative weighting principle is equal weighting, under which each company is assigned the same weight regardless of both market value and size. The weights which are assigned under such alternative weighting principles may deviate considerably from market weights. Alternative weighting principles may be used by funds which wish to engage in rule-based management but which nevertheless do not wish to apply market weighting.
The analysis in Norges Bank’s note showed that several alternative weighting principles have provided a better ratio between risk and return than a market-weighted portfolio. To some extent, this is due to known risk premiums. For example, a fundamental index is highly exposed to the value factor, while an equal-weighted portfolio is often exposed to both the value factor and the size factor.
It may be difficult for large funds to use alternative weighting principles in their management operations. For example, an equal-weighting principle may mean having very large ownership interests in small companies. This is an important consideration in the management of a fund like the GPFG. In the note, Norges Bank analysed how much capital can be invested under various weighting principles. The analysis found that fundamental indices offer larger investment opportunities than other alternative weighting principles. This is because fundamental variables will normally indicate that larger investments should be made in companies which also have a higher market value. However, a market-weighting principle always offers the largest investment opportunities.
Norges Bank is of the opinion that alternative weighting principles should not be used in the Fund’s strategic equity benchmark. In its letter to the Ministry of Finance of 2 February 2012, the Bank wrote:
«Our conclusion is that these alternative weighting criteria should not be laid down in a strategic benchmark index for equity investments, as they are complex to calculate, require relatively frequent adjustments, and will often not be fully investable for a fund such as the Government Pension Fund Global. NBIM can develop an operational benchmark portfolio that takes account of these considerations.
Norges Bank recommends that the starting point in a market-weighted benchmark index is retained.»
In this context, Norges Bank referred to the fact that NBIM can develop an operational benchmark portfolio to meet important requirements relating to weighting criteria other than market weights. An operational benchmark portfolio is a tool which Norges Bank uses in its management operations. In its annual report on the management of the GPFG in 2011, the Bank discussed this in more detail. It wrote, among other things:
«NBIM has constructed internal operational benchmark portfolios for equity and bond investments. These reflect the types of securities that we believe represent a neutral and appropriate strategy. The benchmark portfolios are designed to avoid undesirable risk in parts of the capital market that do not fit with the fund’s size, long-term outlook and objective. The portfolios are based on groups of securities picked because of their return and risk characteristics.»
In the annual report, Norges Bank also wrote that the objective for the operational benchmark portfolio is to achieve a better ratio between expected risk and return after costs. The Bank pointed out that the strategic benchmark set by the Ministry of Finance is based on market indices provided by leading index providers. This helps to ensure that management of the Fund is transparent and verifiable. In the case of equity, the FTSE Global Equity Index Series All Cap has been chosen. As such market indices are based on a market-weighting principle, they are not adapted to the differing objectives and special characteristics of individual funds. Norges Bank wrote that the strategic benchmark specifies a direction for investment and reflects the risk tolerance of the owner. In the Bank’s view, an operational benchmark portfolio can be used to adapt the investments to the GPFG’s objectives and special characteristics.
In its annual report, Norges Bank emphasises that the limits set in the mandate issued by the Ministry can still be linked to the strategic benchmark index. Deviations between the strategic benchmark and the operational benchmark portfolio will, as in the case of other investment choices, utilise the limits for active management set in the mandate for the GPFG. However, such deviations may be larger and of a different nature, and have a different timeframe, than deviations which normally fall within so-called active management.
Norges Bank’s operational benchmark portfolio for fixed income is described in more detail in section 2.2 of this Report to the Storting.
The Ministry gives great emphasis to ensuring that the Fund’s investment strategy has a solid theoretical foundation. Even though it has long been recognised that there are several sources of systematic risk in the financial markets, there is still disagreement about what sources these are and how stable they are. There are also different views on how systematic risk premiums should be exploited in the management of the Fund. The Ministry is therefore of the opinion that it is appropriate to proceed gradually.
In Report No. 10 (2009–2010) to the Storting – The Management of the Government Pension Fund in 2009, the Ministry referred to the recommendation by Professors Ang, Goetzmann and Schaefer to amend the Fund’s benchmark to include exposure to systematic risk factors as much as possible. The analyses of the Fund’s fixed income benchmark in Report No. 15 (2010–2011) to the Storting pointed out several difficulties with this approach, based on the fact that it is difficult in practice to delimit the different risk factors. Norges Bank has recommended that exposure to systematic risk factors should not be built into the benchmark, but rather be included in the operational management of the Fund. The Bank pointed out that an operational benchmark portfolio can be developed in order to safeguard these interests, and argued that several operational considerations indicate that such an approach should be adopted. These are important contributions, which the Ministry will consider in its further work on these issues.
In its work on systematic risk factors, the Ministry is giving particular emphasis to identifying, managing and communicating exposure to such factors in a good manner. The purpose of exposing the Fund to such factors will be to improve the ratio between risk and return, and to exploit the Fund’s special characteristics. Strategies for exploiting risk premiums must be long-term and designed such that they can still be followed in periods during which expected returns fail to materialise. Norges Bank’s efforts to build up its expertise and experience relating to such strategies within the current management framework support this.
3 Investment strategy of the Government Pension Fund Norway
3.1 Background to the investment strategy
The capital base of the Government Pension Fund Norway (GPFN) originates primarily from surpluses in the national insurance scheme between the introduction of the national insurance scheme in 1967 and the late 1970s. The organisation of the GPFN was changed in 2007 by highlighting the distinction between the assets making up the GPFN and Folketrygdfondet as the manager of these assets. The assets were deposited with Folketrygdfondet, which manages the assets in its own name and in accordance with a mandate issued by the Ministry. The return on the assets in the GPFN is not transferred to the Treasury, but is added to the fund capital on an ongoing basis. The market value of the GPFN was NOK 129.5 billion as per yearend 2011, see section 4.2 for a more detailed discussion of performance.
The main part of the assets of the GPFN is invested in the Norwegian equity and fixed income markets. The characteristics of the Fund, such as size and a long time horizon, distinguish the GPFN from many other investors in the Norwegian market. Size entails certain benefits, including the ability to exploit economies of scale in the asset management activities. At the same time, the dominant size of the Fund in the Norwegian capital market results in certain limitations as to opportunities for major changes to the composition of the portfolio over a short period of time. The market is, moreover, characterised by low liquidity in several companies. This adds to the challenges associated with major portfolio adjustments.
3.2 The investment strategy
The objective for the management of the GPFN is to maximise financial returns, given a moderate level of risk. The benchmark adopted by the Ministry forms the basis for the management of the GPFN. The benchmark provides a detailed description as to how the assets of the Fund shall, as a main rule, should be invested. The benchmark is divided into equities (60 percent) and fixed income instruments (40 percent), and into two geographical regions; Norway (85 percent) and the Nordic region excluding Iceland (15 percent), see figure 3.1
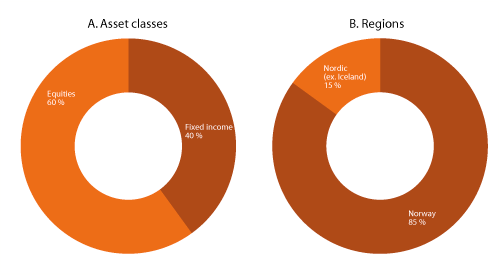
Figur 3.1 Strategic benchmark for the GPFN. Percent
Kilde: Ministry of Finance.
The Oslo Stock Exchange has been chosen as the provider of the two equity benchmarks, whilst Barclays Capital is the provider of the benchmarks for fixed income instruments. The composition of the benchmark for the Fund is described in more detail in the mandate for the GPFN. Figure 3.2 shows the sectoral composition of the equity benchmarks, whilst figure 3.3 shows the distribution of the fixed income benchmarks across sub-markets and credit ratings, respectively.

Figur 3.2 Sectoral composition of benchmarks for equities in the GPFN as per yearend 2011. Percent
Kilde: Folketrygdfondet and Ministry of Finance.

Figur 3.3 Distribution of the fixed income benchmarks for the GPFN across sub-markets and credit ratings as per the beginning of 2012. Percent
Kilde: Folketrygdfondet and Ministry of Finance.
Folketrygdfondet may, within certain limits, deviate from the benchmark. The purpose of such deviations is to improve the performance of the Fund (active management). The Ministry has stipulated a 3 percent per year limit on deviations as measured by tracking error. This means, under certain statistical assumptions, and provided that Folketrygdfondet fully exploits such a limit, that the difference in returns between the actual portfolio and the benchmark is expected to be less than 3 percentage points in two out of three years. In one out of three years the difference is expected to be greater.
Report No. 15 (2010-2011) to the Storting, The Management of the Government Pension Fund in 2010, included a comprehensive review of the active management of the GPFN. The Ministry took the view that active management should continue to be subject to a 3 percent tracking error limit. This was supported by the Storting. At the same time, it was envisaged that the active management of the GPFN would be reviewed at the beginning of every session of the Storting, in line with what has previously been announced for the active management of the GPFG, see Report No. 10 (2009-2010) to the Storting, The Management of the Government Pension Fund in 2009.
Folketrygdfondet has adopted a strategic plan for the performance of its management assignment. This is in line with requirements in the mandate for the GPFN. The plan emphasises that Folketrygdfondet shall be a demanding, but predictable and professional owner. Moreover, Folketrygdfondet seeks to promote enhanced compliance and more transparency in the markets through active dialogue. Folketrygdfondet is also committed to being an active investor with a long investment horizon. The active management strategies are based on exploiting the advantages of the Fund in terms of size and a long investment horizon. The strategic plan is published on Folketrygdfondet’s website (www.ftf.no).
The GPFN is a major owner and lender in the Norwegian capital market. The equity portfolio represents more than 9 percent of the market value of the main index of the Oslo Stock Exchange (adjusted for free float), thus making the Fund one of the main investors on that stock exchange. The portfolio of the GPFN in the Norwegian fixed income market represents about 6 percent of the value of the benchmark. The large long-term holdings of the GPFN in the Norwegian equity and fixed income markets contribute to market stability.
The experience from the financial crisis is that the GPFN was a major purchaser of equities during a period of steep downturn in the equity market. The rules on rebalancing of the GPFN are an important part of this. These imply that the Fund acquires additional holdings in the asset class whose value has declined. The Fund will thereby buy (sell) equities during periods when others are selling (buying), and thus contributes liquidity to the market. This will contribute to stabilising prices during periods of significant contraction in the equity market, as observed during the financial crisis.
Folketrygdfondet is committed to promoting good governance principles in the Norwegian market. The exercise of ownership rights is based on principles in the UN Global Compact, the UN Principles for Responsible Investment (PRI) and the OECD Guidelines for Multinational Enterprises, see section 4.4 of this Report for a more detailed discussion.
4 Asset management follow-up
4.1 Performance of the Government Pension Fund Global
4.1.1 Market developments
2011 was a volatile year in the financial markets. The first half of the year was affected by the earthquake and tsunami in Japan and political disturbances in North Africa and the Middle East. Challenges in the US budget process and the level of US government debt gave rise to uncertainty in the markets in the second half of the year. In addition, there was concern about future economic growth in China.
Nevertheless, the government debt problems in the Euro Zone got the most attention in 2011. The combination of support measures for financial institutions, active counter-cyclical policy to cushion the impact of the financial crisis and the effect of high unemployment and low tax proceeds has in recent years impacted negatively on budgets in many countries. Large budget deficits have increased government debt significantly in several countries, see figure 4.1. This has given rise to doubts about the ability of some countries to service their government debt, and the interest rate on their government bonds increased steeply during the second half of 2011.
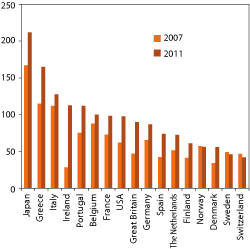
Figur 4.1 Government debt relative to Gross Domestic Product for selected OECD countries. Percent
Kilde: OECD.
Many European banks hold large investments in European government bonds. Major reductions in the value of such bonds therefore resulted in uncertainty about bank solvency. International banks are closely interlinked through the lending of capital to each other, which means that problems spread readily from bank to bank. Consequently, not only those banks that were directly affected faced challenges due to the government debt problems.
Many countries tightened government budgets in 2011. They also announced additional retrenchments for coming years. At the same time, the scope for monetary policy measures had in large part been exhausted by low short- and long-term interest rates. The central banks therefore had limited scope for stimulating increased economic activity. This gave rise to uncertainty about future economic growth and fear of economic slump in Europe, which again resulted in volatility in the financial markets and a general downturn in the equity market.
The widespread uncertainty in the financial markets inspired many investors to seek low-risk investments. This resulted in increased demand for government bonds from countries that were perceived to offer a low probability of default. The interest rate on government bonds issued by these countries fell and such bonds offered a high rate of return. In total, returns in the international fixed income market were favourable in 2011, although with large differences between countries.
The economic turbulence in 2011 also cast a shadow over the European real estate market. A lower interest rate level was, when taken in isolation, positive for the real estate market, whilst a tighter credit market had a negative effect. The positive developments in real estate prices and rent revenues from 2010 became less pronounced during 2011.
It takes a long time for the index providers to prepare return figures for unlisted real estate in Europe. England is one of the markets for which return figures are first available, and data from the index provider IPD show that the rate of return there was about 8 percent in 2011. The average rate of return in this market over the last 10 years was about 7 percent.
4.1.2 Market value and capital inflow
As per yearend 2011, the market value of the Government Pension Fund Global (GPFG) was NOK 3,312 billion. The assets comprised NOK 1,945 billion in equities, NOK 1,356 billion in fixed income instruments and NOK 11 billion in real estate. The market value of the GPFG increased by NOK 234 billion during the course of 2011. Figure 4.2 shows the change in the value of the Fund in 2011 and since the inception of the Fund, split into returns, new capital inflows, changes in the Norwegian kroner exchange rate, as well as asset management costs.

Figur 4.2 Developments in the market value of the GPFG in 2011 and since inception. NOK billion
Kilde: Norges Bank and Ministry of Finance.
Total capital inflow to the Fund since inception is NOK 2,782 billion, whilst the total return net of asset management costs is NOK 641 billion. As the result of the Fund being invested in other currencies than Norwegian kroner, its value is influenced by exchange rate fluctuations. In some years these fluctuations can be large. In 2008, the value of the Fund increased by NOK 506 billion as the result of exchange rate fluctuations. The following year, on the other hand, the value of the Fund declined by NOK 418 billion for the same reason. All in all, changes in the Norwegian kroner exchange rate have not had much impact on the value of the Fund.
Figure 4.3 shows developments in the market value of the Fund since inception, as measured in Norwegian kroner. As the result of large inflows of new capital and the effects of the fluctuations in the exchange rate, the effects of the financial crisis in 2008 and the subsequent rebound in 2009 are hardly noticeable.

Figur 4.3 Developments in the market value of the GPFG. NOK billion
Kilde: Norges Bank and Ministry of Finance.
The inflow of new capital to the GPFG has until now been apportioned between the asset classes and the regions in such a way that the weights in the actual benchmark are reverted, to the maximum possible extent, to the strategic weights, so-called partial rebalancing, cf. section 2.5. About two-thirds of the capital inflow to the GPFG in 2011, which totalled just over NOK 270 billion, were allocated to the equity portfolio, with one-third being allocated to the fixed income portfolio and to real estate. Internally within the equity portfolio, the main part of the capital was allocated to European equities. Apportionments were more mixed in the fixed income portfolio, with major allocations for both US and European fixed income instruments, as well as a minor share for Asian fixed income instruments.
The first real estate investments of the Fund were made in 2011. In april, the Fund purchased 25 percent of The Crown Estates Regent Street portfolio in London for about NOK 4.2 billion. In July the Fund purchased 50 percent of seven properties in and around Paris from the AXA Group for about NOK 5.5 billion. In both cases the Fund and the counterparty entered into a joint venture, which made additional investments during the course of 2011, see section 4.3.1 for a more detailed discussion.
As per yearend 2011, about 58.7 percent of the Fund was invested in equities, 40.9 percent in fixed income instruments and 0.3 percent in real estate, see figure 4.4. This represents an overweight in equities of just under 0.2 percentage point relative to the actual benchmark.

Figur 4.4 Apportionment of the actual investments of the GPFG across asset classes as per yearend 2011. Percent
Kilde: Norges Bank and Ministry of Finance.
As per yearend 2011, the GPFG held 1.1 percent of the global equity market, as measured by the market capitalisation of the FTSE Global All Cap index11, see figure 4.5. The ownership stakes in the fixed income market were smaller. The holdings of fixed income instruments represented 0.6 percent of the value of the fixed income instruments in the Barclays Global Aggregate index. The ownership stake in the equity market has increased by 0.1 percentage point over the last year, primarily due to the inflow of new capital to the equity portfolio. There was little change in the ownership stake in the fixed income market in 2011. The ownership stakes are considerably larger in Europe than in the rest of the world for both equities and fixed income instruments.
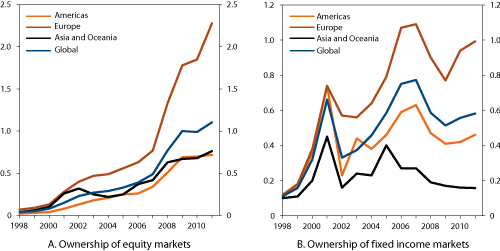
Figur 4.5 Ownership stakes of the GPFG in global equity and fixed income markets. Percent
Kilde: Norges Bank.
As per yearend 2011, 4.4 percent of the assets of the Fund were managed externally. This represents a reduction from 9.2 percent one year earlier. It is primarily equities that are managed externally. There was only one external fixed income mandate as per yearend 2011, which represented 0.1 percent of the overall investments of the Fund.
4.1.3 Return
The GPFG registered an aggregate rate of return of -2.5 percent in 2011 as measured in the currency basket of the Fund and before the deduction of asset management costs. The rate of return was -1.4 percent as measured in Norwegian kroner. The reason for the negative return was weak developments in the equity markets. The equity portfolio registered a rate of return of -8.8 percent as measured in the currency basket of the Fund and before the deduction of asset management costs. The value of investments within the financial sector depreciated considerably during 2011, largely because of uncertainty surrounding government finances in several countries in Europe, and the solvency of banks in the event of one or more states being unable to service their debts. In addition, materials-producing businesses offered very weak returns. These companies are especially affected by the poor economic performance in Europe and the US.
European and Asian equity markets registered weak performance, whilst the US equity market ended the year with a return of about zero as measured in local currency. Emerging markets significantly underperformed the rest of the equity market.
The fixed income portfolio achieved a return of 7.0 percent as measured in the currency basket of the Fund, before the deduction of asset management costs. The Fund’s holdings of government bonds achieved a rate of return of 10.5 percent because price appreciation for German, French, US and UK government bonds compensated for price depreciation for government bonds from some European countries. The holdings of inflation-linked bonds also made a positive contribution to the return, delivering a rate of return of 11 percent in 2011. Mortgage-backed securities was the sector delivering the weakest performance amongst the fixed income investments of the Fund. The return in this sector was 3.5 percent.
The return on the real estate investments was -4.4 percent as measured in the currency basket of the Fund. The negative performance was primarily caused by one-off government fees in connection with the real estate acquisitions. The book value of the real estate investments shall reflect their estimated market value. For new investments, the purchase price will normally provide the best estimate of the value for a period after the acquisition has been made. As per yearend 2011, the purchase price was assumed to provide the best estimate of the value of the French real estate investments of the Fund. The value of the UK real estate investments was subjected to a 3.2 percent upwards adjustment relative to the purchase price, following an increase in the real estate rent level in the Regent Street area of London.
Overall, the return in 2011 was the third weakest since 1998, see figure 4.6. The figure shows that developments in the equity market were much more negative in 2002 and 2008.
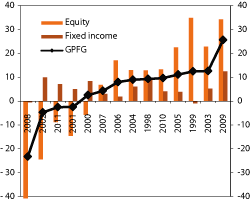
Figur 4.6 Annual rates of return on the GPFG arranged by magnitude. As measured in the currency basket of the Fund before asset management costs. Percent
Kilde: Norges Bank and Ministry of Finance.
The rate of return was higher in the fixed income portfolio than in the equity portfolio in 2011 as well as over the period 1998-2011 as a whole, see figure 4.7. This was primarily caused by developments in the benchmarks of the Fund, see figure 4.8. The interest rates on government bonds in most developed countries declined during this period. This is illustrated in figure 4.9, which shows interest rates on government bonds from selected countries. A decline in the interest rate on a fixed income instrument results in a positive gain in the current period, but expected returns in coming years will at the same time fall.

Figur 4.7 Rates of return on the equity and fixed income portfolios of the GPFG over time, as measured in the currency basket of the Fund. Percent
Kilde: Norges Bank and Ministry of Finance.
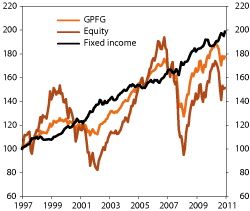
Figur 4.8 Developments in the benchmarks of the GPFG. Index. 31 December 1997 = 100
Kilde: Norges Bank and Ministry of Finance.

Figur 4.9 Interest rates on 5-year government bonds from selected countries. Percent
Kilde: Reuters EcoWin.
In the equity market, the ratio between earnings per share of a company and the price of its equities is referred to as earnings yield. Earnings yield will be low if the investors are willing to pay a high price for a share, relative to current earnings. Possible reasons for this may be expectations of increased profits in the future or weak returns on alternative investments. Another reason may be high confidence in future economic growth and low risk premiums.
Earnings yield increased in many developed markets over the period 1998-2011; see figure 4.10. The changes are probably related both to downscaled growth expectations and to investors demanding a higher risk premium to invest in equities. The interest rate level has declined considerably over the same period, thus implying that equity prices are relatively lower than bond prices as per yearend 2011 when compared to the situation a few years ago.
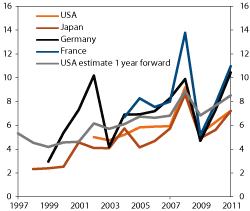
Figur 4.10 Average earnings over the last 12 months relative to market value. Equity markets in selected countries. Percent
Kilde: Reuters EcoWin.
The return on the investments of the Fund is compared to the return on the benchmark of the Fund. In aggregate, Norges Bank delivered a rate of return before the deduction of costs that was 0.1 percentage point lower than the rate of return on the benchmark in 2011.
Tabell 4.1 Rates of return on the GPFG in 2011, last 3, 5 and 10 years, as well as the period 1998 – 2011, as measured in the currency basket of the Fund. Annual geometric average. Percent
Last year | Last 3 years | Last 5 years | Last 10 years | 1998-2011 | |
|---|---|---|---|---|---|
GPFG incl. real estate | |||||
Actual portfolio | -2.54 | 10.30 | 1.42 | 4.16 | 4.48 |
Inflation | 2.77 | 2.19 | 2.22 | 2.14 | 1.91 |
Management costs | 0.08 | 0.11 | 0.10 | 0.10 | 0.10 |
Net real rate of return | -5.25 | 7.83 | -0.89 | 1.87 | 2.42 |
GPFG excl. real estate | |||||
Actual portfolio | -2.55 | 10.30 | 1.42 | 4.16 | 4.48 |
Benchmark | -2.42 | 8.78 | 1.49 | 3.95 | 4.20 |
Excess return | -0.13 | 1.52 | -0.07 | 0.21 | 0.28 |
Equity portfolio | |||||
Actual portfolio | -8.84 | 11.53 | -2.55 | 2.83 | 3.49 |
Benchmark | -8.36 | 10.97 | -2.69 | 2.46 | 3.01 |
Excess return | -0.48 | 0.56 | 0.13 | 0.37 | 0.49 |
Fixed income portfolio | |||||
Actual portfolio | 7.03 | 7.82 | 5.12 | 5.24 | 5.28 |
Benchmark | 6.51 | 4.72 | 4.90 | 4.94 | 5.03 |
Excess return | 0.52 | 3.10 | 0.22 | 0.31 | 0.25 |
Real estate portfolio | |||||
Actual portfolio | -4.37 |
Kilde: Norges Bank and Ministry of Finance.
The equity management delivered a negative excess return of -0.5 percentage point. This is the second weakest equity management performance since the inception of the Fund. The return on the investments within the oil and gas sector and in the materials sector registered the weakest performance relative to the benchmark. Investments within the financial sector and the technology sector made the most positive contributions. By country, the returns on equities in the US and Hong Kong were weakest relative to the benchmark, whilst the returns on Spanish and French equity investments were the strongest.
The rate of return on the fixed income portfolio was 0.5 percentage point higher than the return on the benchmark. This is the third strongest relative return in the fixed income management since the inception of the Fund. The investments in unsecured bonds issued by financial institutions and the investments in Japanese inflation-linked bonds provided the strongest positive contribution to the excess return. Government bonds and mortgage-backed securities in Europe made a negative contribution.
About 1/3 of the aggregate negative excess return originated from externally managed investments. On average, the external equity managers underperformed the benchmarks used to measure their performance by 0.6 percentage point. Investments in small enterprises in developed markets were responsible for the main contribution to the negative excess return. On average, the external fixed income managers underperformed by 4.7 percentage points.
The Fund has registered an annual average rate of return of 4.5 percent before asset management costs since 1 January 1998, as measured in the currency basket of the Fund. This return is 0.28 percentage point higher than the rate of return on the benchmark of the Fund over the same period, see figure 4.11. The annual return corresponds to a net average real rate of return of 2.4 percent over the period 1998-2011 after deductions for asset management costs and inflation. The net average annual real rate of return is 2.7 percent as measured from 1997, see figure 4.12.
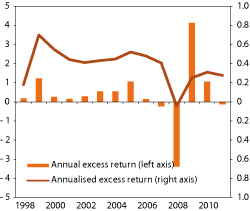
Figur 4.11 Gross excess return performance of the GPFG over time. Percent
Kilde: Norges Bank and Ministry of Finance.
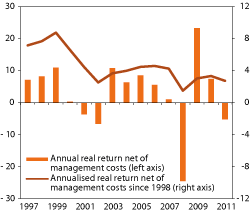
Figur 4.12 Real rates of return on the GPFG over time, as measured in the currency basket of the Fund. Percent
Kilde: Norges Bank and Ministry of Finance.
The Ministry has previously expressed an expectation that annual net value creation from active management should be about ¼ percentage point on average over time. The gross excess return serves as an approximation for this variable, see Report No. 10 (2009-2010) to the Storting, The Management of the Government Pension Fund in 2009. Despite a negative excess return in 2011, Norges Bank has achieved a somewhat higher excess return than the expected ¼ percentage point on average since 1998. The Ministry has calculated a gross excess return on the Fund for the period 1998-2011 corresponding to about NOK 46 billion in aggregate12, see figure 4.13.
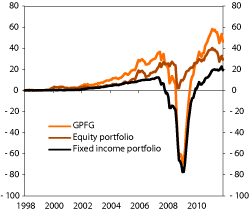
Figur 4.13 Accumulated excess return on the GPFG over time. NOK billion
Kilde: Norges Bank and Ministry of Finance.
Boks 4.1 Verification of the return figures
The consultancy firm Mercer has been instructed by the Ministry of Finance to perform an independent calculation and verification of the return on, and the market value of, the GPFG. As a basis for its calculations, Mercer receives both asset holdings and market values directly from the custodian JP Morgan. Mercer receives data directly from the index provider for purposes of calculating the return on the benchmarks.
During 2010, Mercer has calculated the monthly return figures for the Fund as a whole, as well as for the equity portfolio and the fixed income portfolio. In addition Mercer calculates the return on the benchmark. All the calculations were made for both the currency basket and Norwegian kroner. Mercer also checked that the overall value of the Fund, as well as the various portfolios, conforms with the value calculated by Norges Bank.
If the discrepancy between the return reported by Norges Bank and the calculated return exceeds a margin of error of 0.015 percentage point, Mercer performs additional checks to identify the differences. The outcome of such checks is reported to the Ministry of Finance. The most recent report available has calculated the return for the year 2010, and Mercer found no discrepancies that exceeded the margin of error.
Boks 4.2 External analysis of Fund performance
CEM Benchmarking Inc. is instructed by the Ministry of Finance to compare returns and costs between the GPFG and a group of other funds. The reference group primarily comprises large pension funds in the US and Europe. The most recent complete report has analysed returns over the five-year period 2006-2010, as well as costs in 2010.
In 2010, the Ministry of Finance established a Strategy Council for the GPFG, see the National Budget for 2011. In 2010, the Strategy Council comprised four external members, and was instructed to prepare a report on the work relating to the long-term investment strategy of the Fund. The report was submitted on 26 November 2010.
Benchmark return
Comparing the Fund to other large funds is useful for purposes of evaluating the investment strategy. It is, at the same time, difficult to make an appropriate comparison since funds have their own special characteristics and objectives.
The investment strategy underpinning the composition of the GPFG benchmark is based on trade-offs between expected long-term return and risk in the capital markets. A five-year period is short from this perspective, and performance comparisons over a different period might have yielded different findings.
The return on the benchmark is in large part determined by which asset classes, regions and currencies investments are made in. Many pension funds seek to tailor their investments to their pension liabilities to reduce overall risk. Which asset classes, regions and currencies funds invest in is therefore in large part influenced by their pension liabilities. In addition, the investment and hedging policies of many pension funds are governed by regulations.
The CEM analyses show that the average annual rate of return on the GPFG benchmark over the five-year period from 2006 to 2010 was 3.5 percent as measured in the currency basket of the Fund. The median rate of return of the reference group was 5.0 percent as measured in the same currency basket.
The GPFG differed from the other funds over the relevant five-year period by featuring a higher average fixed income portion, as well as by the Fund not being invested in real estate or private equity. CEM has calculated that the annual benchmark return of the other funds would have been reduced by an average of 0.4 percentage point if the other funds had featured the same asset class composition as the GPFG.
The remaining return difference is caused by the regions, segments and currencies of investment. According to CEM, the GPFG differs from the other funds by spreading its investments over many markets and currencies, whilst most pension funds are in large part invested in their home markets.
The Strategy Council also commented on the return on the Fund in 2010 in its report. The Strategy Council wrote that the long-term real rate of return on the Fund was positive and that the strategy had delivered results in line with what could be expected, despite the extraordinary downturn in the financial markets in 2008.
Excess return
A comparison between the actual return on the GPFG and the return on the benchmark over time shows what excess return has been achieved by Norges Bank. CEM has calculated that the GPFG achieved about the same return as the benchmark before costs over the five-year period 2006-2010. In comparison, the most typical annual excess return (the median) over this period was 0.2 percentage point, both in the reference group and for all the funds examined.
The average excess return in the equity management of the GPFG over the five-year period was 0.2 percentage point per year, whilst the median of the reference group was 0.5 percentage point. The average excess return in fixed income management was 0.2 percentage point per year, and is on a par with the typical excess return of the reference group. The equity portion has increased from 40 percent to 60 percent over the five-year period. Consequently, it is not possible to calculate the total excess return on the Fund by weighting the excess return on the equity portfolio and on the fixed income portfolio, respectively.
The conclusion of the Strategy Council in 2010 was that the asset management activities of Norges Bank had made a valuable contribution to the overall performance of the Fund since 1998.
Costs
The CEM report shows that total asset management costs in 2010 for the GPFG represented 0.104 percent of average assets under management. The asset management costs of the GPFG are amongst the lowest asset management costs of all the funds from which CEM gathers data, relative to the amount of assets under management. Total asset management costs reflect, in large part, the asset composition of the funds, which for the GPFG is a result of its investment strategy.
CEM has prepared a cost benchmark based on the asset composition of the GPFG. The cost benchmark indicates which costs the reference group would have incurred with the asset composition of the GPFG. The analysis shows that actual asset management costs in 2010 were 0.073 percentage point lower than the cost benchmark. This is principally caused by Norges Bank having opted for more internal asset management than has the reference group. Internal asset management generally entails lower costs than does external asset management.
4.1.4 Risks and limits
The risk assumed by the Fund
The choice of benchmark for the Fund is based on trade-offs between expected long-term return and risk. The risk associated with an investment is often measured by the standard deviation of its return. Figure 4.14 shows developments in the risk associated with the GPFG. The risk at any given time is calculated as the standard deviation of the benchmark over the last 12 months, based on monthly return figures. As per yearend 2011, the standard deviation was somewhat below its level twelve months earlier.
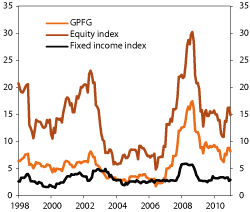
Figur 4.14 Developments in the standard deviation of the benchmarks of the GPFG. Percent
Kilde: Norges Bank and Ministry of Finance.
The rolling standard deviation based on monthly observations changes slowly and is therefore not a good measure of the uncertainty in the market at a given point in time. The VIX index specifies expected fluctuations in equity prices in the US equity market over the next 30 days. The VIX index is high when there is much uncertainty in the market and correspondingly low when market players believe uncertainty to be limited. Figure 4.15 shows VIX index developments over the last five years. The index increased considerably in the summer of 2011, as a result of the uncertainty surrounding government finances in many countries in Europe. The VIX index contracted somewhat during the autumn, but uncertainty in the equity market still remained at a higher level than at the beginning of the year.
Figur 4.15 VIX index developments. Percent
Kilde: Reuters EcoWin.
If the returns on different asset classes are not perfectly correlated, the risk associated with a portfolio can be reduced by investing in several asset classes. The magnitude of such reduction depends on the correlation between the returns on the asset classes. The correlation between two asset classes is always between one and minus one, and the diversification of risk is better the lower this number is. Correlations fluctuate over time, and the correlation between the equity and fixed income benchmarks of the GPFG has varied between 0.4 and -0.8 since 1998, with an average of about -0.2, see figure 4.16. The correlation between the equity and fixed income indices of the GPFG was about -0.4 over the last 12 months.
Figur 4.16 Rolling 12-month correlation between the equity and fixed income indices of the GPFG
Kilde: Norges Bank and Ministry of Finance.
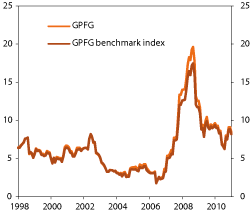
Figur 4.17 Rolling 12-month standard deviation of the actual portfolio of the GPFG vs. the benchmark. Percent
Kilde: Norges Bank and Ministry of Finance.
Relative risk
The mandate for the GPFG stipulates a limit as to deviations between the actual portfolio and the portfolio defined by the benchmark. The rationale for this is a wish to enable Norges Bank to exploit the special characteristics of the Fund, as well as methodological weaknesses in the benchmark and imperfections in the market, to achieve a higher return than the benchmark. At the same time, the Ministry does not wish to increase the risk associated with the Fund materially relative to the risk associated with the benchmark.
Expected tracking error is a measure as to how much the return on the Fund can be expected to deviate from the return on the benchmark of the Fund. The expected tracking error limit was 1.5 percentage points on an annual basis in the regulations applicable until and including 2010. The new regulations that entered into effect on 1 January 2011 stipulate that Norges Bank shall organise asset management with a view to preventing this measure from exceeding 1 percentage point. According to Norges Bank, expected tracking error during 2011 has varied between about 0.3 and 0.7 percentage point, and was 0.4 percentage point as per yearend.
Actual tracking error is a measure as to how much the return difference between the portfolio and the benchmark has varied. Over time, the actual tracking error should be on a par with the expected tracking error. If such is not the case, this is indicative of weaknesses in the model computing the expected tracking error. The actual tracking error in 2011 was 0.4 percentage point, based on monthly observations, see figure 4.18. This is in line with the expected tracking error computed by Norges Bank.
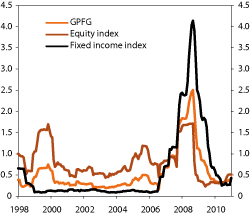
Figur 4.18 Rolling 12-month actual tracking error of the equity and fixed income portfolios of the GPFG, as well as of the Fund. Percent
Kilde: Norges Bank and Ministry of Finance.
The excess return that Norges Bank is able to generate through its active management of the GPFG depends on how large deviations the Bank is permitted to make relative to the benchmark. The ratio between the achieved excess return and the tracking error is called the information ratio, and expresses the risk-adjusted return on the investments. It is desirable for the information ratio to be as high as possible. With an expected excess return of about ¼ percentage point, and a tracking error of less than 1 percentage point, the expected information ratio over time should be somewhat over ¼. Norges Bank achieved an information ratio in excess of 0.3 over the period 1998-2011. The information ratio of the equity portfolio was in excess of 0.5 over the same period, whilst that of the fixed income portfolio was 0.2, see table 4.2.
Tabell 4.2 Absolute and relative risk measures for the GPFG, monthly observations
Last year | Last 3 years | Last 5 years | Last 10 years | 1998-2011 | |
|---|---|---|---|---|---|
GPFG excl. real estate | |||||
Standard deviation (percent) | 8.42 | 10.53 | 11.01 | 8.45 | 7.82 |
Tracking error (percent) | 0.44 | 0.83 | 1.23 | 0.90 | 0.79 |
Skewness1 | 0.27 | 0.02 | -0.67 | -0.95 | -0.93 |
Kurtosis2 | 3.63 | 2.31 | 4.58 | 6.79 | 6.88 |
Information ratio3 | -0.30 | 1.83 | -0.06 | 0.24 | 0.35 |
Equity portfolio | |||||
Standard deviation (percent) | 15.25 | 17.74 | 18.81 | 16.20 | 16.22 |
Tracking error (percent) | 0.51 | 0.46 | 0.91 | 0.82 | 0.90 |
Skewness | 0.28 | 0.04 | -0.51 | -0.74 | -0.71 |
Kurtosis | 4.30 | 2.58 | 3.82 | 4.38 | 4.09 |
Information ratio | -0.93 | 1.23 | 0.14 | 0.45 | 0.54 |
Fixed income portfolio | |||||
Standard deviation (percent) | 2.67 | 3.79 | 4.30 | 3.82 | 3.58 |
Tracking error (percent) | 0.43 | 1.64 | 1.99 | 1.40 | 1.20 |
Skewness | -0.11 | -0.21 | -0.52 | -0.48 | -0.43 |
Kurtosis | 2.05 | 3.08 | 4.11 | 4.04 | 4.10 |
Information ratio | 1.22 | 1.89 | 0.11 | 0.22 | 0.21 |
1 Skewness is a measure as to the asymmetry in the distribution of return figures. A positive skewness implies that there are more very high values than very low values compared to the median value, and vice versa.
2 Kurtosis is a measure as to how likely it is that extreme positive or negative values will occur. A value in excess of 3 indicates that extreme values occur more often than under the normal distribution.
3 Information ratio (IR) is a risk-adjusted measure expressing how much excess return a manager has achieved as measured against the active risk (tracking error).
Kilde: Norges Bank and Ministry of Finance.
Figure 4.17 shows developments in the standard deviations of the Fund and of the benchmark. The risk associated with the Fund has been more or less on a par with the risk associated with the benchmark during most of the period since 1998. An exception was registered during and after the financial crisis in 2008, when the risk associated with the Fund was higher than that associated with the benchmark. The figure illustrates that it is predominantly the risk associated with the benchmark that determines the overall risk associated with the Fund, and that active management only makes a minor contribution. The risk associated with the Fund has been somewhat higher than the risk associated with the benchmark during 2011.
Credit risk
All the bonds included in the fixed income benchmark of the GPFG have been accorded a credit rating by at least one of the leading rating agencies. The purpose of credit ratings is to indicate how likely it is that the borrower will be able to service its liabilities. High-yield bonds are not included in the benchmark of the GPFG, and the Ministry has stipulated that asset management shall be organised with a view to ensuring that such bonds do not constitute more than 3 percent of the market value of the fixed income portfolio. This ensures that Norges Bank does not have to sell fixed income instruments that are downgraded to below investment grade. As per yearend 2011, Norges Bank reported that the portion of fixed income instruments with a credit rating below investment grade was 1.1 percent. The portion with a credit rating equal to «A» or weaker was about 20 percent.
Individual investments
The growth of the Fund in recent years has resulted in larger ownership stakes in a number of companies. As per yearend 2011, the Fund held ownership stakes in excess of 2 percent in 877 companies, and in excess of 5 percent in 53 companies. Both numbers have increased significantly since yearend 2010, see table 4.3.
Tabell 4.3 The ownership stakes of the GPFG in limited companies
Number of companies where the ownership stakes exceed | As per 31 December 2011 | As per 31 December 2010 |
|---|---|---|
9 percent | 2 | 1 |
7 percent | 14 | 5 |
5 percent | 53 | 17 |
3 percent | 288 | 183 |
2 percent | 877 | 512 |
1 percent | 1,738 | 1,667 |
Kilde: Norges Bank and Ministry of Finance.
The role of the Fund is to be a financial investor, and the Fund seeks to reduce risk by spreading its investments across many different securities. The Ministry has therefore stipulated that the Fund can hold a maximum of 10 percent of the voting shares of any one company. As per yearend 2011, its largest ownership stake in one single company was 9.6 percent in Smurfit Kappa Group, an Irish packaging company.
It is difficult to find precise data as to where the Fund ranks on the list of shareholders of all companies. Some of the reasons for this are that not all share registers are official and that such registers are updated at different times. Norges Bank has estimated that the GPFG was amongst the 10 largest shareholders of about 500 companies. The largest investment of the Fund as per yearend 2011 was held in the oil producer Royal Dutch Shell. The 2.2 percent ownership stake had a market value of NOK 31 billion.
Limits defined by Norges Bank
In addition to the above requirements, the Executive Board of Norges Bank shall define further limits in order to manage and curtail the risk. The limits concern minimum overlap between the portfolio and the actual benchmark, credit risk at both individual issuer level and portfolio level, liquidity risk, counterparty exposure, leverage, as well as limits on the reinvestment of received cash collateral. Table 4.4 shows the thresholds defined by the Executive Board for the various categories, and the actual levels as per yearend 2011.
Tabell 4.4 Limits applicable to the GPFG, laid down by the Executive Board of Norges Bank
Risk | Limits | Actual as per 31 December 2011 |
|---|---|---|
Credit risk | Maximum 1 percent of fixed income investments from any one issuer may be rated below Baa3/BBB- | 0.1 |
Overlap between actual holdings and benchmark indices | Equities: minimum 60 percent Bond issuers: minimum 60 percent | 84.2 76.4 |
Liquidity | Minimum 10 percent in government bonds issued by the US, the UK, Germany, France, Italy, the Netherlands and Japan | 15.3 |
Leverage | Maximum 5 percent of the equity and fixed income investments | 0.0 |
Securities lending | Maximum 35 percent of the equity and fixed income investments | 4.2 |
Issuance of options | Maximum 2.5 percent of the equity and fixed income investments | 0.0 |
Securities borrowing through borrowing programmes | Maximum 5 percent of the equity and fixed income investments | 0.0 |
Investment in any one company | Maximum 1 percent of the equity and fixed income investments | 0.9 |
Assets managed by any one external manager | Maximum 1 percent of the equity and fixed income investments | 0.4 |
Kilde: Norges Bank.
Exposure to systematic risk factors
Norges Bank shall, according to the mandate for the GPFG, seek to organise its asset management in such a way that excess return is exposed to several systematic risk factors. Examples of such risk factors are the performance of small companies or companies with low pricing relative to book values (value companies). How exposed the excess return is to such factors can be analysed by comparing the excess return on the Fund with the return on the factors. Figure 4.19 presents the findings from such an analysis of the equity portfolio, carried out by Norges Bank. The analysis indicates that the equity portfolio has for the last two years been more exposed to small companies than has the benchmark. Only minor deviations are registered for the other factors, but there are indications that the equity portfolio has been somewhat underweight in emerging markets and value companies, and overweight in market risk. The risk factors included in the analysis explain, according to Norges Bank, more than 70 percent of the fluctuations in the excess return on the equity portfolio as per yearend 2011.
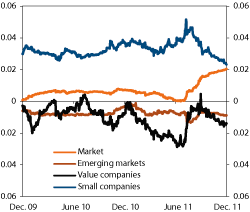
Figur 4.19 Systematic risk factors in the equity portfolio of the GPFG
Kilde: Norges Bank.
The consultancy firm Mercer analyses, in its annual return report on the GPFG, which equity investment style is pursued by the Fund. Mercer calculates exposure to various factors based on key ratios and historical performance for the various companies in which the Fund is invested at a given point in time. The most recent report available from Mercer is based on the portfolio as per 31 December 2010. Mercer’s analyses show that there has been an overweight in small companies.
The analyses indicate that the Fund will, based on the portfolio composition as per yearend 2011, achieve a higher return than the benchmark if the equity market appreciates strongly and if small companies outperform large companies. It must be expected, on the other hand, that the Fund will tend to be outperformed by the market if the equity prices in emerging markets are on the rise and if value companies outperform growth companies.
Norges Bank has analysed how exposed the fixed income portfolio has been to systematic risk factors. This analysis has very little explanatory power. Exposure to all the analysed risk factors has fluctuated around zero in recent years, see figure 4.20. The analysis does not indicate any systematic over- or underweighting.
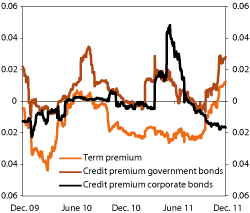
Figur 4.20 Systematic risk factors in the fixed income portfolio of the GPFG
Kilde: Norges Bank.
One lesson from the financial crisis is that it may be difficult to determine in advance how exposed one is to certain risk factors. The risk factors may not have had a material impact on the market before. It is therefore not certain that it is possible to determine exposure to the risk factor or factors that will give rise to the next large fluctuations in the financial markets.
4.1.5 Costs
The mandate given by the Ministry to Norges Bank implies that the actual management costs of the Bank are covered up to an upper limit, which for 2011 was fixed at 0.10 percent (10 basis points) of the average market value of the Fund. The limit has remained unchanged for many years. In recent years, Norges Bank has organised management activities in such a way that the costs have been significantly lower than 0.10 percent. The Ministry of Finance has, in view of this, reduced the limit to 0.09 percent for 2012. In addition, Norges Bank is compensated for fees to external managers that result from achieved excess returns.
The asset management costs declined to about NOK 2.5 billion in 2011, from just under NOK 3.0 billion in 2010. The decline was primarily caused by lower fixed and performance-related fees for external managers, cf. figure 4.21. The number of employees increased from 278 to 315 during 2011. This resulted in higher salary and personnel costs. Besides, the increase in the size of the Fund resulted in higher transaction and settlement costs.
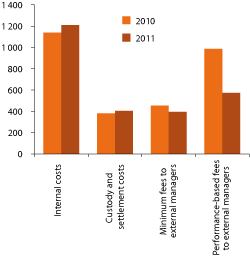
Figur 4.21 Asset management costs of Norges Bank for the GPFG in 2010 and 2011. NOK million
Kilde: Norges Bank and Ministry of Finance.
Asset management costs, excluding performance-related fees for external managers, amounted to about NOK 2.0 billion in 2011. This corresponds to 0.064 percent of the average market value of the Fund. The costs represented 0.081 percent when the performance-related fees for the external managers are included.
On 1 January 2011, new remuneration guidelines were introduced for Norges Bank Investment Management (NBIM), which are in line with the provisions on remuneration within the Norwegian financial sector. Employees who work within risk management, or within control, operational or general functions, will only receive a fixed salary under the new guidelines. Employees who work with investment decisions will continue to receive a performance-related salary, but subject to new accrual and payment conditions. The calculation of performance-related salary shall be made on the basis of no less than two years’ performance. Any performance-related salary accrued shall be paid out over several years. 50 percent is paid out in the year after accrual, whilst 50 percent is retained and paid out over the following three years. The amount retained is adjusted in line with the return on the Fund.
Costs will be incurred in subsidiaries established in connection with the real estate investments. These costs are deducted from the return on the real estate portfolio, and are not charged to the asset management costs that are reimbursed from the Ministry of Finance to Norges Bank. These costs amounted to NOK 26 million in 2011, and will increase in coming years as the real estate portfolio grows.
The company CEM Benchmarking Inc. has compared the costs of the Fund in 2010 with the costs of other funds. The costs of the GPFG are significantly lower than the average for the other funds. The GPFG has small investments in asset classes that entail high costs, like for example private equity and real estate. But the costs are low even when adjusted for these differences. The main reasons are that the GPFG has a low external management portion, and that internal management at Norges Bank is cost effective compared to the management activities of the other funds; see box 4.2.
Cost developments over time
As measured in NOK, the overall asset management costs of the GPFG have increased considerably over time, see figure 4.22. However, the asset management costs have followed a downward trend in recent years when measured as a proportion of assets under management. Costs may be separated into fixed and variable costs. The variable costs will normally increase in line with the assets of the Fund. These include, for example, costs for custodianship services and transactions. Other costs are less dependent on the assets of the Fund, for example personnel costs. An increase in the value of the Fund will therefore be accompanied by a reduction in total costs as measured in basis points of the assets of the Fund. However, more complex management may have the opposite effect. The benchmark of the GPFG has been changed considerably since the inception in 1996 through, inter alia, investments in emerging market equities and in corporate bonds, as well as the establishment of a real estate portfolio. It is more expensive to manage these asset classes than to manage equities or government bonds in developed markets. In addition, more complex management has resulted in a strengthening of the monitoring and control functions of Norges Bank.
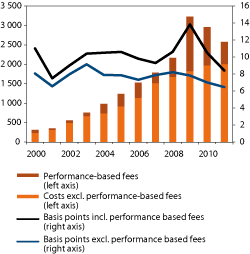
Figur 4.22 Developments in the asset management costs of the GPFG over time. NOK million (left axis) and basis points (1/100 percent)(right axis)
Kilde: Norges Bank and Ministry of Finance.
4.1.6 Environment-related investments
In 2009, it was decided to establish environment-related investments within the GPFG, cf. Report No. 20 (2008-2009) to the Storting, The Management of the Government Pension Fund in 2008. The investments are made under the same regulatory framework as governs the Fund’s other investments in equities and fixed income instruments, and form part of the active management activities of Norges Bank. The volume of these investments may vary somewhat over time, as agreements with some managers are terminated and others are added. The volume may also vary with developments in the equity markets. In Report No. 15 (2010-2011) to the Storting, The Management of the Government Pension Fund in 2010, the Ministry wrote that it is intended for the investments to normally be in the region of NOK 20-30 billion.
The number of environmentally-related mandates increased to ten as per yearend 2011, from nine a year earlier. Seven of the mandates were for investments within renewable energy and technology that can contribute to increased energy efficiency. Norges Bank writes, in its annual report on the GPFG in 2011, that these may include companies that produce or distribute renewable energy or develop equipment needed for this. Companies that produce energy from waste, or that develop more efficient power supply systems, may also be included.
As per yearend 2011, the largest investment under this type of mandate was held in Johnson Controls, a producer of technological solutions for optimising the energy efficiency of buildings and batteries for hybrid cars and electrical cars.
The three other environment-related mandates were for investments within water management. These may be investments in companies that develop technology to improve the quality of water, or investments in companies that develop infrastructure for cleaning and distributing water in, often in emerging markets.
As per yearend 2011, the five largest investments under these environmental mandates were held in Pentair, Progressive Waste Solutions, Suez Environnement, Republic Services and Danaher.
Norges Bank awards mandates to internal and external managers. A total of eight of the environment-related mandates were externally managed as per yearend 2011, whilst two mandates were internally managed. The external mandates represented a total of NOK 9.1 billion, and the internal mandates amounted to NOK 12 billion.
The value of the environment-related investments of the Fund declined to NOK 21.1 billion as per yearend 2011, from NOK 25.7 billion at the beginning of the year. The decline was caused by the contraction in the equity markets, which affected producers of renewable energy from solar and wind power in particular. The environment-related mandates of the Fund registered a return of -22.8 percent in 2011, as measured in the currency basket of the Fund.
4.1.7 Operational benchmark portfolio
Norges Bank has defined operational benchmark portfolios for equities and fixed income instruments in its management of the GPFG. The purpose of the operational benchmark portfolios is to achieve a better ratio between return and risk, net of costs, than under the strategic benchmark.
Norges Bank writes that it incorporated the changes in the operational benchmark portfolio for fixed income instruments, cf. the discussion in section 2.2, in mid-April 2011. The return from then until the end of the year was about 0.2 percentage point higher than that of the fixed income benchmark stipulated by the Ministry of Finance.
4.1.8 The Ministry’s assessment of the performance of the GPFG
2011 was a challenging year with contracting equity markets and an overall return below the return on the benchmark. The investments of the GPFG have a long investment horizon, and one needs to be prepared for considerable performance fluctuations from year to year. Since 1998, Norges Bank has achieved an excess return somewhat in excess of the expected ¼ percentage point. The Ministry is satisfied with the performance achieved since the establishment of the Fund.
Asset management costs, exclusive of performance-related fees, have over the last two years increased less than before. This has resulted, in combination with a large increase in the value of the Fund, in lower asset management costs as a proportion of assets under management. The Ministry is satisfied with these developments, which indicate that Norges Bank is able to exploit the economies of scale in asset management.
The operational benchmark portfolio is a component of Norges Bank’s active management of the GPFG, which can contribute to reducing asset management complexity and costs. The Ministry notes that the differences between the benchmark stipulated by the Ministry of Finance and the operational benchmark portfolio may differ in size, nature and timeframe from what would normally come under the heading of active management. The Ministry deems it positive that information about the operational benchmark portfolio contributes to transparency in the management of the Fund.
4.2 Performance of the Government Pension Fund Norway
4.2.1 Market developments
The equity markets in Norway and the Nordic region were, like the global equity markets, affected by the turbulence surrounding the government finance situation in Europe. The weakest performance was registered by the Finnish equity market, which fell by about 27 percent. Nokia accounted for a large part of this fall. Equity markets contracted by between 12 percent and 15 percent in the other Nordic countries.
All the Nordic countries in which the Government Pension Fund Norway (GPFN) is invested are considered by the fixed income markets to be countries with a low risk of default on government debts. This has resulted in high demand for government bonds from these countries during the year. Whilst several countries in Europe experienced increasing interest rates on their government bonds in 2011, the interest rates on government bonds from the Nordic countries declined. Returns in the Nordic fixed income markets were therefore good in 2011.
4.2.2 Market value
The market value of the GPFN was NOK 129.5 billion as per yearend 2011, just over NOK 5 billion less than at the beginning of the year, see figure 4.23. The decline is the result of the downturn in the equity markets in Norway and the Nordic region.
Figur 4.23 Developments in the market value of the GPFN. NOK billion1
1 A major part of the assets of the GPFN was invested with the Treasury in the form of mandatory deposits until 2005. The mandatory deposits were discontinued in December 2006. This implied that the State redeemed deposits valued at NOK 101.8 billion, and that a corresponding amount was repaid to the State from the assets of the Fund.
Kilde: Folketrygdfondet and Ministry of Finance.
About NOK 67 billion of the Fund was invested in Norwegian equities, whilst just under NOK 43 billion was invested in fixed income instruments from Norwegian fixed income issuers, cf. figure 4.24. The Nordic portfolio comprised NOK 12 billion in equities and NOK 8 billion in fixed income instruments.
Figur 4.24 Allocation of the GPFN across sub-portfolios. Percent
Kilde: Folketrygdfondet and Ministry of Finance.
Figur 4.25 Developments in the benchmarks of the GPFN. Index. 31 December 1997 = 100
Kilde: Folketrygdfondet and Ministry of Finance.
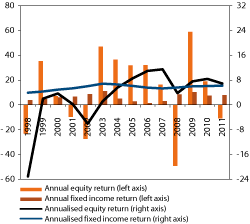
Figur 4.26 Rates of return on the Norwegian equity and fixed income portfolios of the GPFN over time. Percent
Kilde: Folketrygdfondet and Ministry of Finance.
4.2.3 Return
The GPFN registered a rate of return of -3.9 percent in 2011, as measured in Norwegian kroner and before the deduction of asset management costs. The reason for the negative return was weak performance in the equity markets. The rate of return on the Norwegian equity portfolio was -10.9 percent, whilst the rate of return on the Nordic equity portfolio was -17.5 percent, see table 4.5. The rate of return on the Norwegian fixed income portfolio of the GPFN was 7.8 percent, whilst the rate of return on the Nordic fixed income portfolio was 8.0 percent. All return figures are quoted before the deduction of asset management costs.
Tabell 4.5 Rates of return on the GPFN in 2011, last 3, 5 and 10 years, as well as the period 1998 – 2011, as measured in Norwegian kroner. Annual geometric average. Percent
Last year | Last 3 years | Last 5 years | Last 10 years | 1998-2011 | |
|---|---|---|---|---|---|
GPFN | |||||
Actual portfolio | -3.92 | 13.93 | 3.98 | 6.78 | 6.19 |
Benchmark | -5.19 | 13.87 | 2.43 | 6.37 | 5.67 |
Excess return | 1.26 | 0.06 | 1.55 | 0.41 | 0.52 |
Norwegian equities | |||||
Actual portfolio | -10.88 | 19.05 | -0.02 | 9.73 | 6.91 |
Benchmark | -12.46 | 19.52 | -2.65 | 8.70 | 5.22 |
Excess return | 1.57 | -0.46 | 2.63 | 1.03 | 1.69 |
Nordic equities1 | |||||
Actual portfolio | -17.49 | 7.55 | -2.93 | 2.68 | |
Benchmark | -16.70 | 9.54 | -3.77 | 2.44 | |
Excess return | -0.79 | -1.99 | 0.83 | 0.24 | |
Norwegian fixed income instruments | |||||
Actual portfolio | 7.84 | 8.56 | 7.40 | 6.58 | 6.23 |
Benchmark | 6.28 | 7.09 | 6.46 | 6.45 | 6.11 |
Excess return | 1.55 | 1.46 | 0.94 | 0.13 | 0.11 |
Nordic fixed income instruments2 | |||||
Actual portfolio | 8.03 | 1.60 | |||
Benchmark | 7.83 | 0.56 | |||
Excess return | 0.20 | 1.04 | |||
Real rate of return | |||||
Inflation | 1.24 | 1.94 | 2.07 | 1.84 | 2.08 |
Management costs | 0.08 | 0.08 | 0.08 | 0.07 | 0.06 |
Net real rate of return | -5.18 | 11.68 | 1.80 | 4.79 | 3.97 |
1 The Nordic equity investments commenced in May 2001
2 The Nordic fixed income investments commenced in February 2007
Kilde: Folketrygdfondet and Ministry of Finance.
The return on the Fund is compared to a benchmark. All in all, Folketrygdfondet achieved a return before the deduction of costs in 2011 that was 1.3 percentage points better than the return on the benchmark.
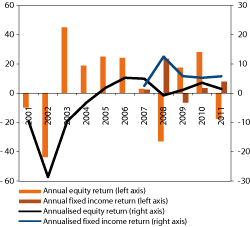
Figur 4.27 Rates of return on the Nordic equity and fixed income portfolios of the GPFN over time. Percent
Kilde: Folketrygdfondet and Ministry of Finance.
The excess return on the Norwegian equity portfolio was 1.6 percentage points. A major part of the excess return was achieved through the Fund not being invested in companies with poor performance in 2011.
The return on the Nordic equity portfolio was 0.8 percentage point lower than the return on the benchmark. The selection of companies within industrials in Sweden contributed to the negative excess return. Equities in cyclical industries perform well when economic growth is strong, but deliver poor performance when growth abates. Correspondingly, equities in defensive industries perform relatively well compared to the market when times are challenging. Substitutions between cyclical and defensive equities had a negative impact on the return on the Nordic equity portfolio.
The excess return on the Norwegian fixed income portfolio was 1.6 percentage points. A higher portion of corporate bonds than under the benchmark had a favourable effect. In addition, the average credit rating of the portfolio was somewhat lower than under the benchmark. The Norwegian fixed income portfolio of the GPFN is invested in a considerable larger number of fixed income instruments and issuers than is the benchmark. Consequently, the Fund is less vulnerable to negative events in individual companies. The credit rating of Eksportfinans was downgraded from AAA to below investment grade when it was disclosed that a government body would assume responsibility for the government-supported export credit scheme. The downgrade resulted in a steep decline in the value of the bonds issued by Eksportfinans. The GPFN was at that time underweight in bonds issued by Eksportfinans. This underweighting represented a contribution to the excess return on the Norwegian fixed income portfolio of about 1 percentage point.
The return on the Nordic fixed income portfolio was about 0.2 percentage point higher than that on the benchmark. The reason for the excess return was that its portion of corporate bonds exceeded that of the benchmark, and that a high return was achieved on the corporate bonds.
The Ministry has previously expressed an expectation for an annual net value creation from the active management of the GPFN of ¼ – ½ percentage point on average over time. Since 1998, the excess return on the GPFN has been just over 0.5 percentage point; see figure 4.28. The Ministry has calculated that the total gross excess return on the Fund over the period 1998-2011 amounts to about NOK 6 billion13; see figure 4.29.
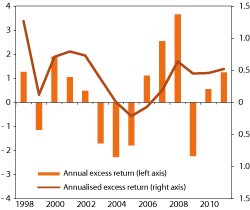
Figur 4.28 Gross excess return performance of the GPFN over time. Percent
Kilde: Folketrygdfondet and Ministry of Finance.
Figur 4.29 Accumulated excess return on the GPFN since 1998. NOK billion
Kilde: Folketrygdfondet and Ministry of Finance.
4.2.4 Risk and limits
The risk assumed by the Fund
The standard deviation provides a measure as to the magnitude of the fluctuations in the return on the Fund. Figure 4.30 shows developments in the standard deviation of the benchmarks of the Fund since 1998. The standard deviation of the benchmark of the GPFN was lower as per yearend 2011 than one year earlier. The decline was in large part the result of a reduction in the standard deviation of the Norwegian equity benchmark towards the end of the year.
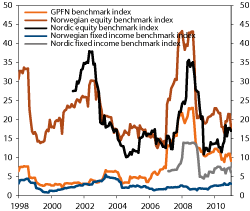
Figur 4.30 Rolling 12-month standard deviation of the benchmarks of the GPFN. Percent
Kilde: Folketrygdfondet and Ministry of Finance.
The negative covariation between the equity and fixed income indices declined somewhat during 2011, see figure 4.31. This means that the returns on the equity and fixed income portfolios counterbalanced each other to a somewhat lesser extent over the year than in 2010. When taken in isolation, this contributed to a minor increase in the overall risk associated with the Fund.
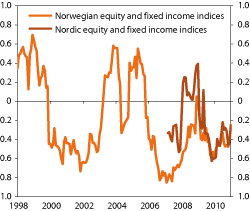
Figur 4.31 Correlation between the equity and fixed income benchmarks of the GPFN
Kilde: Folketrygdfondet and Ministry of Finance.
Relative risk
The mandate for the GPFN requires Folketrygdfondet to organise its management activities with a view to ensuring that the annualised expected tracking error does not exceed 3 percentage points. According to Folketrygdfondet, the level during 2011 has varied between 0.5 and 1.0 percentage point, and was 0.7 percentage point as per yearend. Over time, the actual tracking error should be more or less on a par with the expected tracking error that was calculated in advance. The actual tracking error over the last 12 months was about 0.4 percentage point as per yearend 2011, see figure 4.32.
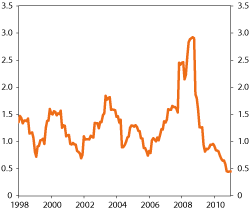
Figur 4.32 Actual tracking error developments for the GPFN. Percent
Kilde: Folketrygdfondet and Ministry of Finance.
Figure 4.33 shows developments in the standard deviations of both the benchmark of the GPFN and the actual portfolio of the Fund. The standard deviation of the Fund has for major parts of the relevant period been somewhat less than the standard deviation of the benchmark. This has especially been the case during periods when market fluctuations have increased. The risk associated with the benchmark is the predominant determinant of the risk associated with the Fund, but the figure shows that the active management activities of Folketrygdfondet have at times contributed to reducing the overall risk to some extent.
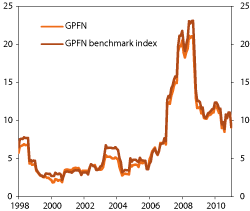
Figur 4.33 Standard deviations of the actual portfolio and the benchmark for the GPFN. Percent
Kilde: Folketrygdfondet and Ministry of Finance.
Credit risk
High-yield bonds are not included in the benchmark of the GPFN, but the mandate permits Folketrygdfondet to invest in such bonds. The Ministry has stipulated that Folketrygdfondet shall organise its management activities with a view to ensuring that such bonds do not represent more than 25 percent of the market value of the corporate bonds in the fixed income portfolio under ordinary market conditions. Corporate bonds represent 70 percent of the strategic benchmark. This limit will therefore correspond to about 18 percent of the overall fixed income portfolio. As per yearend, fixed income instruments with such a credit rating accounted for about 13 percent of the Norwegian fixed income portfolio, whilst their share of the Nordic fixed income portfolio was in excess of 3 percent.
A major part of the Norwegian fixed income market is comprised of fixed income instruments with no external credit rating. The mandate requires Folketrygdfondet to perform an internal credit rating before the GPFN invests in such fixed income instruments. As per yearend 2011, the combination of internal and external credit ratings showed that about 60 percent of the fixed income portfolio had a credit rating of «A» or weaker.
Concurrence
Figure 4.34 shows concurrence between the equity portfolios of the GPFN and the benchmarks. As per yearend 2011, the concurrence between the Norwegian equity portfolio and the benchmark was about 91 percent. The concurrence between the Nordic equity portfolio and the benchmark was in excess of 82 percent.
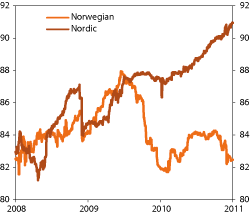
Figur 4.34 Concurrence between the actual equity portfolios and the benchmarks of the GPFN. Percent
Kilde: Folketrygdfondet and Ministry of Finance.
4.2.5 Costs
According to the mandate from the Ministry of Finance, the actual asset management costs of Folketrygdfondet are covered within a limit, which is fixed as a Norwegian kroner amount. The Norwegian kroner amount is determined on the basis of a reasoned proposal from Folketrygdfondet, in which aggregate costs are the sum total of individual components. The Ministry defines a limit as to the overall cost amount. The Ministry does not take a view on each individual cost component, and therefore does not manage individual elements either.
The asset management costs pertaining to the GPFN in 2011 amounted to NOK 109.7 million, well within the stipulated limit of NOK 124 million. The costs represented 8.3 basis points (0.083 percent) when measured as a share of assets under management.
Figure 4.35 shows how the asset management costs of the GPFN have development over time. The costs have increased significantly since 2006, both in Norwegian kroner and measured as a share of assets under management. At the same time, this period has involved considerable changes to the management activities. The account loans arrangement was terminated in 2006, which reduced the assets of the GPFN by somewhat in excess of 100 NOK billion. This happened without much impact on costs. The equity portion was increased from about 20 percent as per the beginning of 2006 to a strategic weighting of 60 percent in 2008. Moreover, Folketrygdfondet was converted to a company by special statute in 2008, and much stricter requirements were imposed in terms of the management and control of risk, as well as reporting. This resulted in Folketrygdfondet having to make significant investments on the systems side, as well as to increase its number of man-years in order to meet the new requirements.
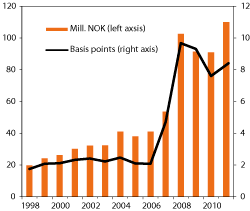
Figur 4.35 Developments in the asset management costs of Folketrygdfondet pertaining to the GPFN over time. NOK million and basis points
Kilde: Folketrygdfondet and Ministry of Finance.
The company CEM Benchmarking Inc. compared the asset management costs of the GPFN in 2010 with the costs of other funds. The comparison demonstrated that the costs of the GPFN were significantly lower than the average costs of the other funds. The main reason for the low costs is that the Fund has internal management only, which typically is cheaper than external management.
In 2011, Folketrygdfondet established a variable salary scheme. The scheme operates within the overall asset management cost limit stipulated by the Ministry. Everyone in the organisation is encompassed by the scheme, with the exception of the Managing Director and the Board of Directors. Folketrygdfondet considers variable salary to be a tool for retaining and developing employees, as well as for ensuring good future recruitment. In addition, variable salary has been introduced as a tool for realising targets that result in permanent management improvements for Folketrygdfondet within areas of priority.
The conditions for the accrual of variable salary depend on job type. Folketrygdfondet states that only qualitative targets are accorded weight for employees who perform control duties, to prevent those performing control duties from having a vested interest in performance.
The long-time perspective of the management activities is attended to by measuring the excess return over three years. Any variable salary accrued will be paid out over several years as per resolution of the Board of Directors. Normally, one half will be paid out in the first quarter of the year following such accrual. Such part of the variable salary as is not paid out immediately is deposited in a bonus bank for payment over three years. The Board of Directors may decide, at its own discretion, to reduce any accrued, but unpaid, variable salary in any subsequent year.
For 2011, average realisation of targets according to defined (quantitative and qualitative) criteria was in excess of 80 percent. NOK 9.5 million was allocated to variable salaries in 2011, including employer’s national insurance contributions.
Tabell 4.6 Absolute and relative risk measures for the GPFN. Monthly observations
Last year | Last 3 years | Last 5 years | Last 10 years | 1998-2011 | |
|---|---|---|---|---|---|
GPFN | |||||
Standard deviation (percent) | 9.15 | 11.37 | 13.62 | 10.08 | 8.78 |
Tracking error (percent) | 0.45 | 1.13 | 1.58 | 1.45 | 1.37 |
Skewness1 | 0.07 | 0.14 | -0.82 | -1.15 | -1.22 |
Kurtosis2 | 4.00 | 2.49 | 4.34 | 7.47 | 9.16 |
Information ratio3 | 2.83 | 0.05 | 0.97 | 0.28 | 0.38 |
Norwegian equities | |||||
Standard deviation (percent) | 17.47 | 20.46 | 25.79 | 23.34 | 22.80 |
Tracking error (percent) | 0.82 | 2.08 | 2.98 | 3.34 | 4.15 |
Skewness | 0.42 | 0.13 | -0.94 | -0.83 | -0.90 |
Kurtosis | 4.46 | 2.38 | 4.62 | 4.45 | 4.77 |
Information ratio | 1.93 | -0.22 | 0.88 | 0.31 | 0.41 |
Nordic equities | |||||
Standard deviation (percent) | 17.52 | 19.69 | 19.39 | 21.03 | |
Tracking error (percent) | 1.02 | 1.48 | 1.93 | 1.42 | |
Skewness | -0.46 | 0.33 | -0.02 | -0.29 | |
Kurtosis | 3.85 | 5.27 | 4.66 | 3.85 | |
Information ratio | -0.78 | -1.34 | 0.43 | 0.17 | |
Norwegian fixed income instruments | |||||
Standard deviation (percent) | 2.39 | 2.40 | 2.57 | 2.55 | 2.52 |
Tracking error (percent) | 1.14 | 0.90 | 1.00 | 1.06 | 0.91 |
Skewness | 0.19 | -0.19 | 0.36 | 0.41 | 0.36 |
Kurtosis | 1.31 | 2.07 | 2.66 | 2.83 | 3.51 |
Information ratio | 1.37 | 1.63 | 0.95 | 0.12 | 0.12 |
Nordic fixed income instruments | |||||
Standard deviation (percent) | 5.93 | 7.77 | |||
Tracking error (percent) | 0.43 | 0.78 | |||
Skewness | -0.08 | -1.41 | |||
Kurtosis | 2.22 | 7.73 | |||
Information ratio | 0.46 | 1.32 | |||
1 Skewness is a measure as to the asymmetry in the distribution of return figures. A positive skewness implies that there are more very high values than very low values compared to the median value, and vice versa.
2 Kurtosis is a measure as to how likely it is that extreme positive or negative values will occur. A value in excess of 3 indicates that extreme values occur more often than under the normal distribution.
3 Information ratio (IR) is a risk-adjusted measure expressing how much excess return a manager has achieved as measured against the active risk (tracking error).
Kilde: Folketrygdfondet and Ministry of Finance.
4.2.6 The Ministry’s assessment of the performance of the GPFN
Returns in 2011 were characterised by a high return on the fixed income portfolio and weak performance in the equity portfolio of the Fund. The investment strategy is based on a long investment horizon, and the Ministry notes that one needs to be prepared for considerable performance fluctuations for the Fund from year to year. The Ministry is satisfied with the performance achieved in the active management of the GPFN as a whole in 2011 and over time.
4.3 Follow-up of the management framework
4.3.1 Real estate investments in the GPFG
On 1 March 2010, the Ministry of Finance laid down guidelines for the management of a real estate portfolio, see Report No. 10 (2009-2010) to the Storting, The Management of the Government Pension Fund in 2010. According to the mandate for the GPFG, Norges Bank shall invest up to 5 percent of the Fund’s capital in a designated portfolio of real estate through a corresponding reduction of fixed income instruments. As described in Report No. 10 (2009-2010) to the Storting, it is expected that it will take many years to develop a real estate portfolio of this size. It is also expected that the investments will be made in the European real estate markets for the first few years.
The first real estate investment of the GPFG, the purchase of 25 percent of The Crown Estates Regent Street portfolio in London, was completed 1 april 2011. The purchase price was GBP 452 million (NOK 4.2 billion). The second real estate investment followed in July and consisted of 50 percent of seven properties in and around Paris. The purchase was made from the AXA Group, which is a French insurance group. The purchase price was EUR 702.5 million (NOK 5.5 billion).
In both cases Norges Bank and the seller entered into a partnership, which made additional investments before the year ended. The Regent Street partnership, which divides its proceeds and expenses with 25 percent to the Fund and 75 percent to The Crown Estate, bought two buildings off Regent Street in the third quarter for GBP 28 million. In December, the partnership with AXA purchased three buildings in Paris for EUR 290 million. The Fund and AXA each held 50 percent of the investments.
The rate of return on the real estate investments of the Fund in 2011 was -4.4 percent, see section 4.1 for a more detailed discussion.
Investments in unlisted real estate differ from investments in listed equities and fixed income instruments. The risk of loss on investments in listed equities and fixed income instruments is normally limited to the sum invested, whilst investments in unlisted real estate entail a risk of loss exceeding this. An owner may be held liable for more than the invested amount as the result of, for example, disputes with tenants or neighbours or damage to property.
It is important to clarify and limit the liability for all kinds of investments. Norges Bank will, as a main rule, invest in real estate through a subsidiary to limit the liability to the endowment capital. Consequently, the investments in real estate will normally be entered into the accounts of the subsidiaries. Intra-group loans will usually be made between the different units in a company structure. The use of such company structures is in line with standard practice amongst large real estate investors.
Many international institutional investors, like pension funds and insurance companies, are, like the GPFG, exempted from taxation in their countries of domicile. Such investors will therefore often establish company structures in jurisdictions where the tax systems, often in combination with tax treaties, if applicable, result in most of the return being taxable in the countries of domicile of the investors, see, amongst others, Report No. 16 (2007-2008) to the Storting, The Management of the Government Pension Fund in 2007.
The management mandate for the GPFG states that that Norges Bank shall seek to achieve the maximum possible return after costs. An important cost element can be taxes. Norges Bank points out in its annual report for 2011 on the management of the GPFG that it is important for Norges Bank that investments are taxed properly according to local laws and regulations, but also that the fund is not charged for more tax costs than necessary. The tax positions of both Norges Bank and the transaction counterparty will be of relevance to the pricing of real estate investments.
Unlike many other institutional investors, the Ministry has laid down guidelines as to where real estate companies and funds set up by Norges Bank in the context of its management of the GPFG may be established. Unlisted real estate companies and funds shall be established in OECD countries, countries Norway has a tax treaty with or other countries which Norway in accordance with other international agreements can request information on tax mattes from. England, France and Luxembourg meet these requirements.
Norges Bank has set up five UK companies for the real estate investments in London. The company structure is presented in box 4.3, figure 4.36. Similar structures are common for real estate investments in England. Norges Bank and the GPFG are at the outset exempt from UK income tax, corporation tax and capital gains tax on property sales if the investments are made directly by Norges Bank/the GPFG. The structure described in box 4.3 features, amongst others, companies that incur no tax liabilities of their own; so-called tax transparent companies. The structure protects the interests of the Bank and limits the liability of the Bank, whilst at the same time preserving the tax position of the GPFG.
Boks 4.3 Norges Bank’s company structure for real estate investments
Regent Street
Figur 4.36 Norges Bank’s company structure for the investments in Regent Street in London
Kilde: Norges Bank.
The right to rent income pursuant to the agreement with The Crown Estate is ensured through the two registered companies Burlington Number 1 Nominee 1 & 2 Ltd. These two companies ensure such rights on behalf of two registered partner companies; Burlington Number 1 (General Partner) Ltd., which owns 0.5 per cent of the investment, and Burlington Number 1 (Limited Partner) Ltd., which owns 99.5 per cent of the investment. The latter entity is exempted from tax. The directors of the entity are appointed by Norges Bank.
Paris
Figur 4.37 Norges Bank’s company structure for the investments in Paris
Kilde: Norges Bank.
The purpose of the various companies in the structure:
NBIM SÀRL is a holding company wholly-owned by Norges Bank. The company protects the other assets of the Fund against any claims that may arise as the result of the real estate investments. It is intended that future investments channelled via Luxembourg will be held through subsidiaries of NBIM SÀRL.
The four directors of the company are appointed by Norges Bank. Two of the directors are external. The two other directors are the head of the NBIM real estate department and the managing director of NBIM SÀRL. According to the articles of association of the company board resolutions shall be unanimous, Norges Bank shall consent to key decisions pertaining to the company and Norges Bank is entitled to appoint and remove directors with immediate effect.
NBIM Louis SÀRL is a holding company for the AXA investments. This company shields NBIM SÀRL from financial liability beyond its equity capital.
NBIM Louis 1-6 SÀRL are Luxembourg-registered companies established for the purpose of owning the French-registered company NBIM Louis SPPICAV (Société de Placement à Prépondérance Immobilière à Capital Variable).
NBIM Louis SPPICAV is an unlisted regulated fund company which enjoys favourable tax treatment under French law.
NBIM Louis SAS (Socitété par Actions Simplifiée) is counterparty to the agreement with AXA, and is titleholder to 50 percent of the underlying assets in the form of properties and real estate companies.
Corresponding considerations underpin the structuring of the investments in France. Norges Bank has set up companies in both Luxembourg and France for the real estate investments in and around Paris. The corporate structure is presented in box 4.3, figure 4.37. The wholly-owned subsidiary NBIM SÀRL (Société à Responsabilité Limitée) in Luxembourg shall be a holding company for the ownership and administration of real estate investments in Continental Europe. Most of the investments in that region will therefore be made through this subsidiary, which means that NBIM SÀRL will over time acquire additional ownership interests in companies that are directly or indirectly invested in real estate. The duties of the company will also include account keeping, book keeping and the transfer of rent income to Norges Bank, as well as duties ensuring that the Fund complies with local regulations.
Luxembourg is often used as a base by international real estate investors, see the discussion in Report No. 15 (2010-2011) to the Storting, The Management of the Government Pension Fund in 2010. The reasons for this are, e.g., predictable and stringent legal frameworks and tax regulations. The country has a moderate tax level, in as much as a low share of gross incomes is taxed. In addition, Luxembourg has a well-developed treaty network protecting investors from double taxation of investments in countries with which Luxembourg has concluded tax treaties.
The agreements and corporate documents of the Bank ensure necessary access to the companies for the Internal Audit unit of the Bank, which is the supervisory body of the Executive Board, for the external auditor of the Bank, and for the Supervisory Council, which is the supervisory body of the Storting for Norges Bank.
The management and control of the real estate investments on the part of Norges Bank is described in more detail in a separate article in Norges Bank’s annual report on the GPFG in 2011.
4.3.2 Norges Bank’s framework for the assessment of counterparty risk
Counterparty risk is the risk of loss as the result of a counterparty under a contract not performing its legal obligations. This type of risk arises, inter alia, when concluding derivatives contracts that are not listed and in connection with the settlement of securities trades.
The mandate for the GPFG requires Norges Bank to lay down principles for the measurement and management of counterparty risk. The Bank has recorded such principles in the document Executive Board’s Principles for Risk Management in Norges Bank Investment Management (NBIM), whilst the document Investment Mandate defines counterparty exposure limits. 14 Counterparty risk in the management of the GPFG is reported by Norges Bank in the ongoing quarterly and annual reports on the Fund.
The Supervisory Council of Norges Bank has, based on input from the Ministry and with the assistance of the external auditor of the Bank, obtained an assessment of the framework for risk management and control of counterparty risk relating to the management of the GPFG, see box 4.4. The auditor has assessed whether the framework is in line with recognised standards and established practice, and whether it is implemented in accordance with its design.
Boks 4.4 Assurance engagements
A so-called assurance engagement scheme was established as part of a new audit arrangement for Norges Bank in 2009. The engagements involve the external auditor of the Bank reviewing the internal control system, risk management, etc., in the management of the GPFG, see Proposition No. 58 (2008-2009) to the Odelsting, Act relating to Amendments to Act of 24 May 1985 No. 28 relating to Norges Bank and the Monetary System, etc. (New Financial Reporting and Auditing Arrangements, etc.) The assurance engagements are included in the audit program of the Supervisory Council of Norges Bank, and form part of the system for the supervision and control of the activities of the Bank, see figure 4.38. A dialogue has been established between the Ministry of Finance and the Supervisory Council of Norges Bank, thus enabling the Ministry to submit input for the supervision programme of the Supervisory Council.
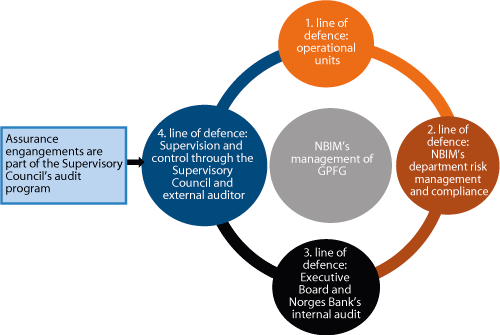
Figur 4.38 The system for supervision and control of Norges Bank Investment Management’s (NBIM’s) management of the GPFG
Kilde: Norges Bank and Ministry of Finance.
The methodology of an assurance engagement involves the auditor assessing whether the relevant aspect, for example the operational risk management framework, is designed and implemented in accordance with relevant standards, methods and established practice. These standards are thereafter applied as measurement criteria for purposes of the assessment. The assurance engagement standard (SA3000) requires a number of control actions to be planned and carried out before the auditor can give assurance.
In 2009, the Supervisory Council of Norges Bank adopted a plan for assurance engagements that emphasised operational risk management in the management of the GPFG. The engagement was performed by the auditor of the Bank (Deloitte) in consultation with the secretariat of the Supervisory Council. It was based on, inter alia, inputs from the Ministry. The plan encompassed the following six sub-projects: organisational structure and management controls, operational risk and internal control, counterparty risk assessment framework, external manager follow-up, capital inflow and exposure relative to the adopted benchmark, as well as risk management in active management. Assurance engagements have now been completed for the first five sub-projects. It is intended for the project on risk management in active management to be reviewed at a later date, in view of the fact that the active management of the GPFG has recently been assessed. The assurance reports from the completed projects have been discussed in previous reports to the Storting. The reports have also been published on the Norges Bank website.1
1 See http://www.norges-bank.no/no/om/publisert/brev-og-uttalelser/2011/78885/.
4.3.3 Folketrygdfondet’s system for internal control and compliance with the mandate
Folketrygdfondet performs the management of the Government Pension Fund Norway (GPFN) on behalf of, and pursuant to a mandate issued by, the Ministry. An assurance engagement scheme has been established as part of the follow-up of the management activities of Folketrygdfondet, in line with that applicable to Norges Bank’s management of the GPFG, see box 4.4. The assurance engagement for 2011 encompasses Folketrygdfondet’s internal control system and compliance with the mandate.
In its assurance statement for 2011, the auditor concluded that it has not become aware of any circumstances that give reason to assume that the internal control system of Folketrygdfondet is not, in all material respects, in accordance with recommended international practice. The auditor noted, moreover, that best practices are evolving on an ongoing basis, and that Folketrygdfondet should continue the development of its own risk management and internal control methodology in line with the evolvement of such practices. This implies that the Fund needs to establish processes aimed at identifying leading international practice within all parts of the organisation and seek to replicate such practice. The auditor emphasises, inter alia, that Folketrygdfondet should continue its efforts to enhance the management of its activities. Furthermore, the auditor recommends continued development of the reporting to the Board of Directors and company executives to further improve the understanding of, and to provide independent insight into, asset management performance and the underlying risk associated with the portfolio. It is also recommended that Folketrygdfondet continue to make the self evaluations submitted to the Board of Directors more systematic. Moreover, Folketrygdfondet should continue to evolve control designs and specify the control activities in key processes, including the financial reporting process in particular. Through self evaluations, Folketrygdfondet has identified a need for continued work on the establishment of so-called Key Risk Indicators for operational risk. The auditor recommends that Folketrygdfondet considers this, and examines it in the context of the general management of its activities.
Furthermore, the auditor concludes that it has not become aware of any circumstances that give reason to assume that there are any material violations of provisions laid down in the Act relating to Folketrygdfondet, as well as in regulations and mandates issued by the Ministry of Finance.
The assurance statement has been published on the website of the Ministry (www.government.no/gpf).
4.4 Responsible investment practice
4.4.1 Introduction
The Ministry is of the view that a good return in the long run is dependent upon sustainable development in economic, environmental and social terms, as well as well-functioning, legitimate and efficient markets. In line with international developments, over time more emphasis has been placed on integrating good corporate governance considerations, as well as environmental and social issues, in the investment activities. Such a strategy corresponds well with the UN Principles for Responsible Investments (UN PRI; see box 4.5) and is reflected in the management mandates of Norges Bank and Folketrygdfondet, respectively.
The strategy for responsible investment practice in the management of the Government Pension Fund has been developed over time; see figure 4.39. In 1998, the Fund was permitted to invest in equities. As the Bank accumulated more experience from the management of equities, it gradually made more use of its rights as a shareholder in safeguarding the financial interests of the Fund. In 2001, the Ministry introduced an arrangement for the exclusion of investments that violated international law, based on advice from the Petroleum Fund’s Council on Ethics and International Law. In 2004, the Ministry introduced new ethical guidelines for the Government Pension Fund Global (GPFG). In several respects, these guidelines went beyond the exclusion mechanism premised on international law. Active ownership became a tool for complying with the ethical obligations of the Fund. The ethical guidelines were evaluated in 2009. The evaluation resulted in a more comprehensive strategy for responsible investment practice. This was deemed to be in line with international developments within the area.
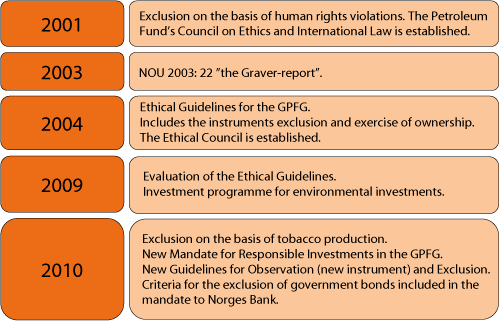
Figur 4.39 Development of the strategy for responsible investment practice
Kilde: Ministry of Finance.
The responsible investment work encompasses several areas:
international cooperation and contribution to the development of best practices;
environment-related investments;
research and analysis;
active ownership; and
observation and exclusion of companies.
The Ministry of Finance, Norges Bank, Folketrygdfondet and the Council on Ethics all participate in the international debate on responsible investment practices, and cooperate with other players on contributing to the development of best practices and research within their areas. The Ministry of Finance participates in a project headed by the not-for-profit organisation Tomorrow’s Company in London, together with representatives of other large funds, companies and academics. The project aims to develop a better and more shared understanding of the meaning of long-term sustainable value creation.
The Ministry has participated in a research project on the effects of climate change on the capital markets. This is discussed in more detail in section 2.6. The activities of the Bank, Folketrygdfondet and the Council on Ethics related to the development of better industry practices and research and development are discussed below.
Special environment-related investments were established as the result of the evaluation of the ethical guidelines in 2009. These investments include active management mandates especially targeted at, inter alia, water management, environmental technology and clean energy. The investments are made within the same regulatory framework as governs the other investments of the Fund in equities and fixed income instruments. Performance under the environment-related investment mandates is discussed in more detail in section 4.1.
In 2010, the Ministry adopted new guidelines for responsible investment practice in the management of the GPFG. These guidelines are partly addressed to Norges Bank and partly to the Council on Ethics. The evaluation in 2009 suggested more of an emphasis on the opportunities for contributing to positive change. Reference was made, in that context, to sustainability issues and to corporate conduct within good corporate governance, as well as to the handling of social and environmental issues. The evaluation demonstrated that it was desirable to strengthen the interaction between active ownership and the exclusion mechanism. The new guidelines have contributed to this.
The exercise of ownership in the GPFG and the GPFN is based on a joint platform of internationally recognised principles, see box 4.5. At the same time, the tools used in this work differ somewhat due to the differences in size and investment strategy between the Funds. Norges Bank and Folketrygdfondet have formulated their own active ownership principles, based on these basic principles. The active ownership activities of Norges Bank and Folketrygdfondet are discussed in more detail in sections 4.4.2 and 4.4.3.
Boks 4.5 Basic principles for active ownership
The exercise of ownership rights as part of the management of the Government Pension Fund is based on the UN Global Compact, the OECD Principles of Corporate Governance and the OECD Guidelines for Multinational Enterprises. These international principles define norms for good corporate governance and impose requirements concerning responsible environmental and social corporate practices. Norges Bank and Folketrygdfondet have defined their own guidelines for their exercise of ownership rights in keeping with these principles. In 2006, the UN published a set of Principles for Responsible Investment (UN PRI). The PRI are based on factors linked to corporate governance and environmental and social conditions affecting financial returns. The PRI have about 1,000 members. The Ministry of Finance, Norges Bank and Folketrygdfondet all participate in the PRI on behalf of GPFG and the GPFN. The Ministry of Finance reports on compliance with the PRI in its management of the GPFG and the GPFN, respectively, partly on the basis of information provided by Norges Bank and Folketrygdfondet.
The UN Global Compact
The UN Global Compact defines a total of ten universal principles derived from the Universal Declaration of Human Rights, the ILO Declaration on Fundamental Principles and Rights at Work and the Rio Declaration on Environment and Development. The principles are general in nature and state, inter alia, that businesses should respect human rights and not be complicit in human rights violations, should uphold the freedom of association and collective bargaining, and eliminate all forms of forced and compulsory labour, child labour and discrimination with respect to employment and occupation. Furthermore, they should support a precautionary approach to environmental challenges, promote greater environmental responsibility and the development and diffusion of environmentally friendly technologies, and combat all forms of corruption, including extortion and bribery.
More than 8,000 companies and organisations in over 135 countries have joined the UN Global Compact. The members are encouraged to report annually on their compliance with the principles.
OECD Principles of Corporate Governance
These principles are very extensive and mainly address the basis for effective corporate governance, the rights of shareholders and key ownership functions, the equitable treatment of shareholders, transparency and disclosure, and the responsibilities and liabilities of boards of directors.
OECD Guidelines for Multinational Enterprises
These guidelines are voluntary principles and standards for responsible business practices in different areas. The OECD guidelines for multinational companies represent the only recognised and detailed regulatory framework that member states are obliged to promote. They contain recommendations on a number of matters, including public disclosure of company information, the working environment and employee rights, environmental protection, combating bribery, consumer interests, the use of science and technology, competition, as well as tax liability.
The UN Principles for Responible investments (UN PPI)
The UN Principles for Responsible Investment are an initiative of the UN Environment Programme Finance Initiative (UNEP FI) and the UN Global Compact. The initiative is aimed at the owners of assets, asset managers and their professional cooperation partners, all of whom are encouraged to sign the principles. The PRI principles address how to take environmental, social and corporate governance issues (ESG) into account in asset management and active ownership. Incorporating such considerations will also have consequences for what type of information investors request from companies and what the companies are expected to report on. The members of PRI have a duty to report on their compliance with the principles on an annual basis. Norges Bank contributed to the drafting of the principles.
According to the Guidelines for Observation and Exclusion from the Government Pension Fund Global’s Investment Universe, of March 2010, companies shall be excluded from the Fund if they manufacture certain specified products. Companies may also be excluded if they are deemed to contribute to, or themselves being responsible for, grossly unethical conduct as defined in the Guidelines. As per yearend 2011, 55 companies had been excluded pursuant to recommendations from the Council on Ethics. Moreover, the Ministry has placed two companies under observation pursuant to the Guidelines. The Ministry has, since the exclusion of companies commenced, readmitted five companies to the portfolio.
Nordic companies (except for Norwegian companies) form part of the investment universe of both the GPFG and the GPFN. If the Ministry decides to exclude a Nordic company, this company is excluded from both funds. This follows from Report No. 24 (2006-2007) to the Storting, The Management of the Government Pension Fund in 2006, and from the management mandate for the GPFN. The Ministry of Finance has decided, against this background, to excluded one company from the GPFN.
The work of the Council on Ethics on the observation and exclusion of Companies from the GPFG is described in more detail in section 4.4.4 below.
Developments within the area of responsible investments
Keeping track of, and contributing to, the development of best practice, is an important element of the responsible investment strategy for the Government Pension Fund. Responsible investment practice is a field undergoing rapid international development. The thematic scope has been expanded, and new tools, methods and institutions have been added. The mounting interest is reflected, inter alia, in a steady increase in the number of members of UN PRI, amongst both investors and other financial market players. Developments run along several lines. Amongst the themes that have recently been prominent on the agenda can be mentioned how to better integrate environmental, social and corporate governance considerations (so-called ESG considerations) in the investment activities. Other relevant issues relate to climate change, questions of excessive emphasis on short-term considerations in the financial markets, as well as the role of the owners.
There has also been much attention on methods and tools for reporting on ESG issues. The purpose of the International Integrated Reporting Council (IIRC) is to create a global reporting framework that encompasses financial, social, governance and environmental information in a clear, concise, consistent and comparable manner. There is also increasing interest in the workings of financial markets, especially whether any institutional and systems-related aspects can be improved to ensure that more weight is accorded to considerations relating to sustainability and long-term value creation in investment activities. This includes, inter alia, a discussion about the use of government regulation.
Several investors are still using exclusion as a tool, but there are also some large institutional investors that do not include this in their strategy. Some investors exclude companies on purely ethical grounds (for example several religious communities). This is often the case when companies are excluded on the basis of what they produce, for example special types of weapons. The GPFG, the large Dutch pension funds APG and PGGM, as well as the New Zealand Superannuation Fund, are examples of funds that exclude companies on such grounds. Some funds exclude companies due to blameworthy aspects of the way in which such companies run their business operations. These may be, for example, human rights violations, environmental damage and corruption. In such cases exclusion is often practised as a last resort after one has sought to influence companies to improve their practices and conduct. The Swedish AP funds and the New Zealand Superannuation Fund follow such a strategy. This requires good interaction between the exercise of ownership and exclusion decisions.
Cooperation between investors still remains an important theme. A number of different initiatives and organisations are engaged, on behalf of their members, in various efforts to improve corporate practices. Some examples are the Carbon Disclosure Project, the CEO Water Mandate, EITI and Forest Footprint Disclosure. Organisations aiming to improve corporate governance standards, etc., for the benefit of company owners are also very active, for example the International Corporate Governance Network (ICGN) and the Asian Corporate Governance Association (ACGA).
4.4.2 Responsible investment practice and active ownership activities in the GPFG15
The overarching objective of Norges Bank in its active ownership activities is to safeguard the financial interests of the GPFG. This is in conformity with the mandate for the GPFG. The Bank shall, furthermore, integrate considerations relating to good corporate governance, environmental and social issues throughout its investment activities, in line with internationally recognised principles for responsible investment practice. The integration of these considerations shall pay heed to the investment strategy of the Fund and the Bank’s role as a financial investor. Norges Bank has in 2011 adopted and published guidelines for responsible investment practice. The guidelines describe various types of environmental, social and corporate governance risks. These risk factors shall be taken into account in, inter alia, the investment analyses performed by the portfolio managers, when new markets and instruments are evaluated, as well as when the Bank exercises its ownership rights.
In 2011, Norges Bank established a database containing information on environmental, social and corporate governance issues. The database includes information from both external and internal sources, and covers 4,000 of the companies in which the Fund is invested. The database is for use by the entire organisation, and is particularly tailored to portfolio managers and investment analysts. The purpose is to have easy access to information that can be used in connection with investment decisions.
The active ownership activities of Norges Bank have their basis in internationally recognised, global standards, like the OECD Principles of Corporate Governance, the OECD Guidelines for Multinational Enterprises and the UN Global Compact (see the discussion in box 4.5). These are supplemented by the corporate governance and voting guidelines of Norges Bank, and by Norges Bank’s expectation documents.
Focus areas in the ownership activities of the GPFG
Norges Bank has refined and strengthened its active ownership activities during 2011. The effort is premised on the assumption that the best prospects for having an impact are achieved by working predictably and with a long-term horizon within areas that are of financial relevance to the Fund and other investors. Norges Bank has selected the following strategic focus areas:
equal treatment of shareholders;
shareholder influence and board accountability;
well-functioning, legitimate and efficient markets;
climate change (see box 4.7);
water management; and
children’s rights.
Good corporate governance is necessary for the development of profitable businesses. It safeguards shareholders’ rights and ensures that value creation is distributed in accordance with shareholdings. The equality of shareholders, as well as shareholder influence, is therefore central to Norges Bank’s corporate governance activities. The focus area «well-functioning, legitimate and efficient markets» encompasses fundamental issues pertaining to how markets work, as well as issues relating to good corporate governance. Norges Bank has also focused on environmental and social factors that influence companies’ business environments and development, and thus also the Fund’s assets. The focus areas climate change, water management and children’s rights were selected on the basis of such considerations.
Tools used in the active ownership activities
Once an investment has been made, voting in general meetings is one of the most important tools for a shareholder. Norges Bank also uses dialogue with individual companies, collaboration with other investors, participation in international networks and organisations, input to regulatory authorities, contact with research bodies, and public communication of opinions and expectations. In selecting a tool one assesses, inter alia, the likelihood of achieving an impact versus the resources required.
Voting
Norges Bank exercises its rights as a shareholder to cast votes in general meetings (see box 4.6). Shareholders may attend to their interests by jointly deciding whether to approve board proposals in cases concerning share capital increases, major transactions, amendments to the articles and the appointment of directors. In a smaller number of general meetings votes are also cast on proposals that have been submitted by shareholders, without enjoying board support. Such proposals may concern proposed amendments to the articles, board requests or alternative candidates for appointment as directors. The Bank has adopted its own guidelines for voting and the publishing of its voting record on each matter.
Boks 4.6 More efficient voting
Norges Bank aims to vote in all general meetings of companies in which the Fund holds ownership interests. In 2011, the Bank has voted in more than 11,300 general meetings. The voting is carried out through an external electronic voting platform, which issues voting instructions on behalf of the Bank, and pursuant to the instructions and guidelines of the Bank. The voting instructions are sent from the electronic voting platform to Norges Bank’s global custodian bank, which implements the voting in the general meetings, most often with the assistance of local custodian banks or other representatives. The local custodian banks again depend on other subcontractors for gathering information in advance and for casting the votes. The number of players involved varies from market to market.
Few institutional investors vote in as many general meetings as does Norges Bank. Against this background, the Bank works continuously to improve the voting process. The Bank has also taken the initiative to establish an investor group working for a faster and more standardised cross-border voting process. Another objective is to improve the ability of systems to document and confirm the voting of the Fund. The Bank has discussed improvements and held meetings with the various players participating in the voting chain. The efforts have thus far resulted in more efficient voting, but there is still scope for improving the processes.
The Bank attaches special weight to board responsibility for monitoring and defining a good framework for company executives, as well as for keeping the shareholders informed and treating them equally. It is therefore necessary to measure board efforts against the long-term performance of the business. The Bank is committed to developing and protecting the right of the shareholders to force through board changes when necessary. The actual ability of the shareholders to hold the board responsible varies from market to market, and depends on legislation and standards, as well as on market practice. Nonetheless, the willingness and ability of the shareholders themselves to attend to their long-term ownership interests is also of decisive importance.
Norges Bank believes that a company board should be chaired by a person who is not an executive of the company. The Bank has, for the third year in a row, submitted shareholder proposals to the general meetings of four US companies, requesting amendments to the articles to prevent the CEO from also holding the chairmanship. None of the proposals have been adopted, but support has increased year by year.
A number of the shareholder proposals submitted in 2011 by investors worldwide demanded that companies aim to reduce greenhouse gas emissions and report on measures to reduce such emissions. The number of shareholder proposals addressing climate change declined in 2011, when compared to 2010. However, the number of shareholder proposals concerning improved water management increased over the same period. The increase can in large part be attributed to proposals in which shareholders request reporting of environmental consequences of shale gas production and of water pollution from coal-fired power plants. The Bank notes a reduction in the number of shareholder proposals demanding that companies adopt guidelines for promoting human rights or addressing global employment standards.
Shareholder proposals concerning environmental and social matters are examined separately by the Norges Bank analysts. Each proposal is evaluated on the basis of the general guidelines of the Bank.
Follow-up of individual companies
Norges Bank actively exercises ownership rights in individual companies within the selected focus areas. The Bank seeks to hold the board accountable for company performance and for the risk assumed by the company, as well as for ensuring that the minority shareholders are not treated unfairly. The Bank conveys expectations as to the qualifications of the directors and the quality of the board nomination process. In order to protect the minority shareholders against dilution, Norges Bank emphasises transparency in companies’ transactions with close associates, as well as protecting the pre-emptive rights of the shareholders in relation to share issues.
Norges Bank is, despite a low percentage ownership stake, often amongst the very largest shareholders of a company. The views of the Bank with regard to company strategy, operations, risk, capital structure and management are therefore solicited to an increasing extent. Companies are particularly interested in how Norges Bank will vote in general meetings and how the Bank reacts to special situations that might arise during the course of the year. Such contacts contributed, for example, to influencing the board compositions and nomination processes of several companies in 2011. That the Bank has good knowledge about individual companies and sectors is becoming increasingly important.
Norges Bank adopts a systematic approach to the focus areas of climate change, water management and children’s rights. Companies in sectors that are particularly exposed to risk within these three focus areas are reviewed, from the perspective of the Bank’s expectations, on an annual basis. The findings from the reviews are made public in annual sector reports. Selected companies are also followed up through dialogue.
In some cases Norges Bank will use legal action as a tool in its exercise of ownership. This may include legal action against issuers of equities or fixed income instruments if the Fund has suffered a financial loss as the result of the conduct of the company or its directors. In 2010, the Bank and some German investors requested a German court to examine whether the board of directors of Porsche SE has exceeded its powers and exposed the company to excessive risk in its attempt to acquire control of Volkswagen AG. In 2011, there was no longer any basis for pursuing the request after the German investors negotiated a solution that resulted in Porsche paying an extraordinary dividend to the holders of preferred shares and undertaking to improve corporate governance.
The Bank also uses litigation as a tool in its role of shareholder in other contexts. In 2011, Norges Bank and 14 other institutional investors joined up to bring a claim against Countrywide Financial Corporation before a US district court. Formerly, Countrywide was the largest US lender to the housing sector, and the litigation concerned incorrect information to the market. The case was resolved in late 2011 through the parties reaching an agreement.
Norges Bank has previously brought certain other shareholder actions, and three of these cases were still pending as per yearend 2011. In addition, the Bank files claims on the basis of settlements or legal rulings in class actions.
Cooperation with other investors
Norges Bank is in regular contact with other asset management institutions, to cooperate on dialogue with individual companies or to exchange information and evaluations. In 2011, the Bank discussed voting, share capital increases, board changes and matters relating to the focus areas water, climate and children’s rights.
The Bank has for a number of years cooperated with some other investors on companies’ handling of risk that may result from climate changes. In 2011, Norges Bank continued its cooperation with the financial institution TIAA-CREF on pursuing a dialogue with selected US companies in sectors that are particularly exposed to such risk. These efforts aim to improve companies’ handling and reporting of the risk to which they are exposed. In cooperation with the Dutch pension fund PGGM, Norges Bank embarked on a dialogue with Indian and Chinese companies in 2011 concerning their handling and reporting of risk associated with water consumption.
In 2011, the Bank signed an investor declaration supporting the UN Guiding Principles for Business and Human Rights, which were endorsed by the UN Human Rights Council on 16 June 2011. The work on the Guiding Principles was headed by Professor John Ruggie of Harvard University. Professor Ruggie is the UN Special Representative for Business and Human Rights. The Guiding Principles constitute a global standard that defines, inter alia, the role of companies in preventing human rights violations or negative impact on the human rights situation.
Norges Bank was one of the investors signing the «2011 Global Investor Statement on Climate Change» in October 2011 (see box 4.7).
Boks 4.7 The focus area climate change
Norges Bank considers climate change to pose a significant long-term risk to the investments of the Fund, and has selected this as a focus area for its active ownership activities. The activities are aimed at sectors that account for a high share of global greenhouse gas emissions, and that will be particularly affected by regulations attributing an economic cost to greenhouse gas emissions. These include sectors such as mining, cement, chemicals, oil and gas, manufacturing, energy production, transport and real estate.
Norges Bank expects companies to analyse how their activities are affected by climate challenges, and to prepare plans and targets for handling climate risk. The company boards should integrate climate change in their general risk management duties. The Bank would also like companies to disclose information that provides investors with a basis for assessing whether companies are meeting their own targets. The Bank gathers information from various sources to shed light on whether they meet these expectations. The Bank also evaluates, on an ongoing basis, how changes in regulations and environmental conditions affect the risk exposure of companies.
Norges Bank was one of the investors signing the «2011 Global Investor Statement on Climate Change» in October 2011. The investors encouraged the authorities, prior to political leaders meeting in Durban in South Africa in December to discuss new climate targets, to bring climate issues to the top of the agenda and agree on a binding international framework that can result in effective climate policy measures. The Bank is also a member of the Carbon Disclosure Project (CDP), which promotes corporate reporting within the climate area.
Norges Bank participates in organised investor networks such as, for example, the International Corporate Governance Network (ICGN) and the Principles for Responsible Investment (PRI). In order to strengthen its activities in Asia, the Bank has concluded a sponsorship agreement with the Asian Corporate Governance Association (ACGA). The ACGA works with investors, companies and regulatory authorities to improve corporate governance in Asia. Moreover, the Bank has renewed a three-year agreement as a main sponsor for CDP Water Disclosure.
Industry initiatives
The active ownership activities of Norges Bank are also conducted within the framework of various industry initiatives. The Bank thereby seeks to establish a dialogue between companies within the same sector.
Since 2008, Norges Bank has, together with the Dutch fund APG, paid special attention to monitoring child labour in cocoa production. In 2011, the Bank concluded its dialogue with the companies within this area. It was then of the view that the industry players had themselves made progress in several areas. This includes, inter alia, an industry initiative with an action plan to combat child labour in the cocoa production in West Africa, launched in the autumn of 2010. The companies have committed, through cooperation with the authorities in Ghana and Côte d’Ivoire and the US Department of Labor, to reducing the worst forms of child labour in cocoa production in these countries by 70 percent by 2020. In October 2011, the first report on these efforts was published. The industry initiative has also entered into cooperation with the International Labour Organization (ILO) to combat child labour in the cocoa production in West Africa. Norges Bank will continue to monitor industry developments and companies to ensure that the action plan delivers specific results.
Norges Bank has also for a long time been working on an industry cooperation initiative to combat detrimental child labour in seed production in India. There have been signs of improvement in recent years. The Bank nevertheless continued to pursue the dialogue with relevant companies in 2011.
Improvement of market standards
By getting the authorities and other standard setters to impose stricter corporate governance requirements, it becomes easier for the shareholders to hold the directors and company executives accountable for their decisions and to strengthen the protection of shareholder rights.
In its capacity as investor, the Bank submitted a consultative statement to the EU Commission’s document on corporate governance in companies in Europe. The Bank emphasised, inter alia, that it is the responsibility of the shareholders to monitor company boards and their activities, and that more open, standardised and implementable European regulations would facilitate such efforts. The Bank believed that it is necessary to obtain more information about the qualifications of directors. The Bank also called for a system that facilitates assessment of companies against corporate governance standards. The consultative statements of the Bank are available on the Norges Bank Investment Management website (www.nbim.no).
Norges Bank may submit proposed amendments to the articles of individual companies if the legislation does not offer sufficient protection of the interests of the shareholders. This approach has been used by investors in the US market to change actual market standards. One example is the introduction of qualified majority requirements for making board appointments. In 2011, Norges Bank submitted proposed amendments to articles intended to facilitate proposals for alternative directors in the US, cf. the discussion in box 4.8.
Boks 4.8 Alternative board candidates
In 2010, the US Securities and Exchange Commission (SEC) adopted a new rule facilitating the submission of proposals for alternative board candidates by shareholders. The SEC thereby complied with a requirement under the Dodd-Frank Act, which was adopted in the wake of the financial crisis. The new rule requires the company to provide information about the alternative board candidates in the notice of general meeting (the rule is labelled the proxy access rule in the US.) Such arrangements are anchored in corporate legislation in most other countries than the US. The current alternative for shareholders of US companies is to write to a sufficient number of shareholders, requesting them to vote for alternative candidates. This process, which is labelled proxy fight in the USA, is very costly and combative.
However, the so-called proxy access rule of the SEC was challenged in court by US business interest organisations, and was declared invalid. Together with a group of European and US investors, the Bank wrote anew to the SEC following the legal ruling, to express its concern over the future process. Support was expressed for the continuation by the SEC of the effort to introduce such a federal rule. The legal ruling allowed for shareholders to seek amendments to the articles of individual companies to enable shareholders to submit proposals for alternative board candidates.
Norges Bank decided to submit shareholder proposals in six US companies. The proposals call for amendments to articles to enshrine a right for shareholders to submit proposals for alternative board candidates for inclusion in the notice of general meeting. The proposals were submitted in 2011, and will not be voted over until 2012.
Norges Bank is also pursuing a dialogue with players that define financial market standards. The Bank thereby seeks to strengthen and harmonise international standards for the handling and reporting of environmental and social risk. In january, the Bank participated in public consultation under the auspices of the EU Commission concerning potential amendments to the regulations on corporate reporting of non-financial information. Norges Bank supports proposals for listed companies to report non-financial information of relevance to their activities.
The Bank also participated in the first consultative round of the Global Reporting Initiative (GRI) revision of its guidelines for sustainability reporting. Norges Bank encouraged the development of a reporting system for environmental and social issues that enables the measurement and comparison of companies. The Bank also voiced this opinion in a public consultation held by the International Integrated Reporting Committee (IIRC). The IIRC is developing a new international reporting framework intended to integrate such reporting. In a letter, Norges Bank argued, together with the investors APG and CalPERS, in favour of a framework encouraging companies to explain how environmental and social risk factors are of relevance to corporate financial performance and future value creation.
Communication and expectation documents
The ownership activities of Norges Bank are based on principles and the adoption of a long-term perspective. As an investor, the Bank formulates expectations within the various ownership focus areas. The published expectation documents facilitate communication with companies and other interested parties.
Expectation documents on companies’ climate change management, on child labour and on water management have been published earlier. The Bank will also issue three new expectation documents that describe the other focus areas of the Bank. Equal treatment of shareholders and board accountability are discussed in the corporate governance principles and voting guidelines of the Bank, and will be addressed in more detail in two of these expectation documents. Moreover, Norges Bank is preparing an expectation document on the focus area «well-functioning, legitimate and efficient markets». The Bank aims to complete the document after consulting a selection of interested parties, and thereafter to make it public. Company transparency and reporting are amongst the themes to be described in this document.
Since corporate transparency and reporting in general are important to the GPFG as a large international fund, this theme is addressed in several key documents relating to the ownership activities of Norges Bank. These issues are addressed both in the corporate governance principles and voting guidelines of the Bank and in the existing expectation documents.
The expectation documents form a key element of the ownership strategy of the Bank, but other types of communication are also used. In 2011, Norges Bank held a seminar on the benefits of corporate reporting on the risk of limited access to, and pollution of, water. The seminar was held as part of the World Water Week in Stockholm. On the World Day Against Child Labour, 12 June 2011, Norges Bank published, for the first time, the names of the companies that scored top marks for reporting on the risk of child labour and violation of children’s rights in their activities and supply chains. By disclosing the names of the companies with the highest scores, the Bank wished to promote good reporting standards within this area. The Bank also published status reports on the focus areas climate change and water management in 2011. The Bank evaluated the extent to which companies reported on their handling of risk relating to these areas.
4.4.3 Responsible management practice and active ownership activities with regard to the GPFN
The Board of Directors of Folketrygdfondet has defined principles for responsible investment activities that are based on the Norwegian Code of Practice for Corporate Governance (NUES) and the UN Principles for Responsible Investment (PRI), as well as on the OECD Principles of Corporate Governance.
Folketrygdfondet has previously had one set of ownership principles and one set of ethical principles. In order to better reflect the integrated nature of the work, the Board of Directors has in 2011 replaced these by a joint set of principles for the investment activities of Folketrygdfondet.
Folketrygdfondet is of the view that responsible management practice and active ownership activities can promote financial, social and environmental interests. Important ESG information is included in company analyses and used in making investment decisions. Failure by a company to adhere to responsible practices may also entail financial risk.
Focus areas in the active ownership activities of the GPFN
In its responsible investment practice work, Folketrygdfondet has chosen to give priority to themes like reporting and communication, anti-corruption and greenhouse gas emissions. The Fund assumes that the highest financial risk in relation to the overall portfolio of the GPFN is found within these areas. Furthermore, Folketrygdfondet has chosen to probe two themes of relevance to the Norwegian equity portfolio in more detail. These are the issues of aquaculture sustainability and unconventional oil and gas extraction.
As a financial investor, Folketrygdfondet also becomes involved in ownership issues like board composition, remuneration, reporting and communication, values and management principles, as well as capital structure and strategy. Folketrygdfondet deems it important to follow up on the executive salary policies of companies for purposes of safeguarding shareholder value. This involves, inter alia, assessing whether executive salary schemes are designed such as to actually contribute to more effective and performance-oriented corporate management. Folketrygdfondet also looks at any option schemes, and what these trigger in terms of the transfer of assets from the shareholders to company executives.
Tools in the active ownership and voting activities
Active participation in the general meetings of companies, based on Folketrygdfondet’s principles for responsible investment practice, forms an important part of the active ownership activities.
Folketrygdfondet reports annually on its exercise of ownership rights. The Fund will normally publish its ownership report in the autumn. The report describes which activities Folketrygdfondet has pursued to attend to its ownership interests. It includes, inter alia, specific discussion of some matters that have been deliberated in the general meetings, relevant matters raised by Folketrygdfondet with companies, as well as the number and types of appointments held by Folketrygdfondet employees on the governing bodies of companies.
Folketrygdfondet has during 2011 cast votes in the general meetings of all companies of which Folketrygdfondet was a shareholder as per the date of such general meeting. This implies that Folketrygdfondet has voted in 60 general meetings held by companies listed on the Oslo Stock Exchange. Folketrygdfondet has in twelve matters, and in the general meetings of seven different companies, voted against the board proposals. These proposals concerned executive salary statements and accompanying authorisations to issue shares under option programmes (Algeta, Noreco, Atea and RCCL), general authorisations to issue shares that were very broad in scope (Norwegian Property, Axis-Shield) and directors’ pay with options (Algeta). Voting explanations have been issued in relation to such voting, and are available on www.ftf.no. Folketrygdfondet has cast votes in a total of 116 general meetings of Nordic companies, all by proxy with accompanying voting instructions.
Principles for responsible investment practice in the asset management activities
Folketrygdfondet’s principles for responsible investment practice apply to all investments of the Fund. However, different methods are used to follow up the principles in the various sub-portfolios.
Active ownership and dialogue with companies are important tools in the management of the Norwegian equity portfolio. This involves, inter alia, Folketrygdfondet raising relevant ESG issues with company executives, thus enabling the companies to rectify unacceptable conditions. If the companies fail to take measures after such a discussion, Folketrygdfondet may contemplate raising the matter in the general meeting. If this does not succeed either, Folketrygdfondet must eventually consider a sale of equities in the company. Folketrygdfondet takes ESG issues in companies that have issued bonds that are included in the portfolio into consideration as well. Relevant measures will be evaluated and implemented in case a violation of the investment principles of Folketrygdfondet is uncovered. As far as concern any companies in which Folketrygdfondet holds both equity and fixed income investments, any measures will apply to both types of investment.
For investments in Nordic equities or fixed income instruments issued by Nordic companies, Folketrygdfondet adheres to the decisions of the Ministry on the exclusion of companies on the basis of recommendations from the Council on Ethics for the GPFG. This means that if the Ministry of Finance determines that the Government Pension Fund Global shall refrain from investing in certain companies, these securities shall also be excluded from the investment universe of Folketrygdfondet. Otherwise, votes are cast in general meetings by proxy with accompanying voting instructions.
Information gathering and company analysis
Folketrygdfondet continuously monitors the companies in the Norwegian equity and fixed income portfolios through searches in electronic editorial sources around the world. The searches are made systematically, and Folketrygdfondet is notified if companies in the portfolio are linked to social responsibility issues. The intention is to monitor whether the companies adhere to their own guidelines and do not act in contravention of international treaties and recognised norms for responsible operations.
Since 2009, Folketrygdfondet has expanded the resources devoted to its responsible investment efforts, in particular in relation to analysis of ESG issues. The analyses constitute a good basis for following up on the work of individual companies concerning environmental, social and corporate governance issues that may be of importance to value creation in the long run.
An ESG analysis has been prepared for each of the companies in the Norwegian equity portfolio by an analyst with the relevant qualifications. It has been examined whether the company has issued guidelines on the handling of various ESG issues, how these guidelines have been implemented and whether the company reports on compliance with the guidelines. The analysis also addresses whether the company observes internationally recognised social responsibility principles, such as the UN Global Compact and the OECD Guidelines for Multinational Enterprises.
The ESG analysis has been made available to the equity managers of Folketrygdfondet, thus implying that the information becomes an integrated part of the financial assessment of each company. The ESG analysis is updated by the analyst prior to any meetings with the companies, and any new ESG issues are reviewed by the equity managers. Thereafter, the analysis is used as a basis for the discussion of specific ESG issues in meetings with company executives.
Follow-up of individual companies
When Folketrygdfondet draws the attention of a company to an ESG-related problem, it is expected that the company will explain how it is addressing the problem and that it takes any necessary action. Weight is attached to following up on each individual case until the problem has been resolved in a satisfactory manner.
Folketrygdfondet is committed to pursuing a constructive and good dialogue with companies on corporate governance and social responsibility issues. Experience has shown that this type of dialogue may take several forms.
Proactive dialogue takes place before, or without, the occurrence of any violations of recognised norms for responsible business practice. The focus is here on areas where there is room for improvement on the part of the company. This type of dialogue is often pursued over a long period of time, and much follow-up is needed.
Reactive dialogue will for example take place if questions arise as to whether company is engaging in activities that are not in conformity with responsible business practice. This is often triggered by a specific event, with associated media coverage. Reactive dialogue will often take place swiftly once the question has arisen. In most cases the company must then take immediate measures to clarify the facts of the case and resolve any problems.
Folketrygdfondet has over the last year been involved in both types of dialogue with several companies on, inter alia, anti-corruption work, employee rights, environmental reporting, greenhouse gas emissions and other environmental issues. Folketrygdfondet has in each of these cases requested an explanation from the relevant company. In some cases Folketrygdfondet has requested specific measures. The dialogues with the companies are documented to ensure future follow-up.
Industry cooperation and cooperation with other investors
Folketrygdfondet has in 2011 expanded its participation in external initiatives, conferences and seminars relating to responsible investments, both in Norway and internationally. This facilitates the exchange of responsible investment practice information and experience with other players. Folketrygdfondet holds cooperation with other investors to be an important tool in relation to responsible management practice. The Fund has therefore participated in several cooperation projects with other investors and organisations in 2011.
Folketrygdfondet also participated in the Carbon Disclosure Project (CDP)in 2011. CDP prepares an annual survey on greenhouse gas emissions. The questionnaires are sent to listed companies on behalf of the participating investors. The responses of the companies have been made available on the CDP website. Folketrygdfondet incorporates the information gathered by the CDP from Norwegian companies in the company-specific ESG analyses that form the basis for the dialogues with the companies. Folketrygdfondet believes the CDP to be useful, and will support the project in 2012 as well.
Folketrygdfondet joined the UN Principles for Responsible Investment (PRI) in 2008 (see box 4.5). The six UN principles are based on the premise that a responsible owner and investor shall integrate ESG themes in its asset management activities. All participating investors are asked to report each year. The Ministry and Folketrygdfondet have in 2011 submitted reports on behalf of the GPFN for the second time.
Since 2008, Folketrygdfondet has participated in the project Sustainable Value Creation. This is a project launched by Norway’s largest institutional investors in order to influence Norwegian listed companies to pursue sustainable development and long-term value creation. Questions on the handling of specific ESG themes were sent by the project, on behalf of participating investors, to all companies included in the main index of the Oslo Stock Exchange in 2008 and 2009. There was no new activity associated with the project in 2011. Folketrygdfondet is of the view that the project has contributed to the initiation of positive processes in the companies. However, the information gathered should become more accessible.
4.4.4 Observation and exclusion of companies
Under the Guidelines for Observation and Exclusion from the Government Pension Fund Global’s Investment Universe, companies are to be excluded if they produce certain products, sell weapons to specific states, or contribute to, or are themselves responsible for, grossly unethical activities. The Ministry of Finance has excluded 55 companies on the basis of advice from the Council on Ethics. Furthermore, the Ministry has placed two companies under observation pursuant to the same guidelines. The criteria for product-based and conduct-based exclusion, as well as the companies that have been excluded or placed under observation on the basis of these criteria, are presented in tables 4.7, 4.8 and 4.9.
Tabell 4.7 Overview of companies excluded on grounds of production
Product | Date | Company |
|---|---|---|
Anti-personnel land mines | 26 April 2002 | Singapore Technologies Engineering |
Cluster munitions | 31 August 2005 | Alliant Techsystems Inc, General Dynamics Corporation, Lockheed Martin Corp., Raytheon Co. |
30 November 2009 | Poongsan Corporation New | |
31 December 2007 | Hanwha Corporation | |
31 December 2008 | Textron Inc. | |
Nuclear arms | 31 December 2005 | BAE Systems Plc, Boeing Co., EADS Co, EADS Finance BV, Finmeccanica Sp. A., Honeywell International Corp., Northrop Grumman Corp., Safran SA. |
31 December 2007 | Gen Corp. Inc. Serco Group Plc. | |
Sale of weapons and military materials to Myanmar | 28 February 2009 | Dongfeng Motor Group Co Ltd. |
Production of tobacco | 31 December 2009 | Alliance One International Inc., Altria Group Inc., British American Tobacco BHD, British American Tobacco Plc., Gudang Garam tbk pt., Imperial Tobacco Group Plc., ITC Ltd., Japan Tobacco Inc., KT&G Corp, Lorillard Inc., Philip Morris International Inc., Philip Morris Cr AS., Reynolds American Inc., Souza Cruz SA, Swedish Match AB, Universal Corp VA, Vector Group Ltd. |
28 February 2011 | Shanghai Industrial Holdings Ltd | |
31 July 2011 | Grupo Carso SAB de CV |
Kilde: Ministry of Finance.
Tabell 4.8 Companies excluded on grounds of conduct
Grounds for exclusion: | Date | Company |
|---|---|---|
Contribution to serious or systematic human rights violations | 31 May 2006 | Wal-Mart Stores Inc. and Wal-Mart de Mexico SA de CV |
Serious violations of individuals’ rights in situations of war or conflict | 31 July 2010 | Africa Israel Investments Ltd. Danya Cebus |
Severe environmental damage | 31 May 2006 | Freeport McMoRan Copper & Gold Inc. |
31 October 2007 | Vedanta Resources Plc.1, Sterlite Industries Ltd, Madras Aluminium Company | |
30 June 2008 | Rio Tinto Ltd. and Rio Tinto Plc. | |
30 November 2008 | Barrick Gold Corp | |
31 October 2009 | Norilsk Nickel | |
31 July 2010 | Samling Global Ltd. | |
31 January 2011 | Lingui Developments Berhad | |
Serious violations of fundamental ethical norms | 31 August 2009 | Elbit Systems Ltd. |
30 November 2011 | FMC Corporation Potash Corporation of Saskatchewan Inc. |
1 Also excluded due to contribution to human rights violations.
Kilde: Ministry of Finance.
Tabell 4.9 Companies placed under observation
Grounds for observation: | Date | Company |
|---|---|---|
Gross corruption | 6 December 2011 | Alstom SA |
13 March 2009 | Siemens AG |
Kilde: Ministry of Finance.
The Council on Ethics examines on a regular basis whether the grounds for exclusion of a company still apply. The Council may on the basis of new information recommend that the Ministry of Finance reverse an earlier exclusion decision. Since the adoption of the previous ethical guidelines, five companies have been accepted back into the investment universe of the GPFG because their exclusion was no longer justified.
Four recommendations have been published since the previous Report to the Storting on the management of the Fund. In these, the Council on Ethics recommended the exclusion of five companies from the Fund. The Ministry excluded three companies and placed one company under observation, whilst one company was neither excluded nor placed under observation.
Product-based exclusion
The guidelines establish that the assets of the Fund shall not be invested in companies that, themselves or through entities they control:
produce weapons that violate fundamental humanitarian principles through their normal use;
produce tobacco; or
sell weapons or military material to states that are affected by investment restrictions on government bonds as described in the management mandate for the Government Pension Fund Global Section 3-7 (10). At present, this applies to Myanmar (Burma).
The Revised National Budget for 2004 provides an exhaustive list of weapons covered by the product-based exclusion criteria: chemical weapons, biological weapons, anti-personnel mines, undetectable fragmentation weapons, incendiary weapons, blinding laser weapons, cluster munitions and nuclear arms. The Fund shall not be invested in companies that develop or produce key components for these types of weapons.
The criterion for the exclusion of companies that produce tobacco is limited to the actual tobacco products and does not include associated products such as filters and flavour additives or the sale of tobacco products. All companies that, themselves or through entities they control, grow tobacco plants or process tobacco into end products shall be excluded regardless of how large or small a share the tobacco production represents of the company’s overall operations.
Altogether, the Ministry has excluded 38 companies from the Fund on the basis of the product-based criteria. 18 of these companies have been excluded on the basis of production of weapons that violate fundamental humanitarian principles in their normal use. 19 companies produce tobacco and one company has sold military materials to Myanmar (Burma).
Conduct-based exclusion
A company shall be excluded from the Fund if it contributes to, or is itself responsible for:
serious or systematic human rights violations, such as murder, torture, deprivation of liberty, forced labour, the worst forms of child labour and other child exploitation;
serious violations of individuals’ rights in situations of war or conflict;
severe environmental damage;
gross corruption; or
other particularly serious violations of fundamental ethical norms.
All in all, 17 companies have been excluded from the GPFG pursuant to these criteria. Two of the companies were excluded on grounds of contributing to serious or systematic human rights violations, ten companies were excluded because they were deemed to cause severe environmental damage16, three companies were excluded on grounds of other particularly gross violations of fundamental ethical norms and two companies were excluded on grounds of serious violations of individuals’ rights in situations of war or conflict.
Two companies have been placed under observation, both of them under the gross corruption criterion. During the observation period, the Council on Ethics will be monitoring, inter alia, how the companies develop their systems to prevent corruption, how the companies handle the investigation of corruption events in the past, as well as whether allegations arise of new instances of corruption. The Council on Ethics annually informs the Ministry in a separate letter on the status of the companies under observation, and will issue a new recommendation after the observation period has been completed.
The Council on Ethics’ work on product-based exclusion
A considerable portion of the companies excluded from the investment universe of the Fund are removed because they produce certain products in contravention of the guidelines. In order to identify companies engaged in such production, the Council on Ethics uses an external consultancy firm that continuously monitors the Fund’s portfolio and the companies that have been excluded from the Fund. Each quarter, the consultant reports to the Council on companies that may have activities in violation of the criteria. The Council on Ethics is also collaborating with other financial institutions on a consultancy assignment to map which companies produce cluster munitions.
Normally, the Council on Ethics contacts the companies if there is reason to believe that they are engaged in production in violation of the guidelines. If a company confirms the information, the Council will render an exclusion recommendation. Companies that do not reply when approached are recommended for exclusion if the Council’s documentation shows that there is a high probability that the company has products that violate the exclusion criteria. By adhering to this procedure, the Council seeks to achieve a reasonable degree of assurance that companies producing products that violate the criteria in the guidelines will be excluded from the Fund. Nevertheless, it cannot be guaranteed that all companies will at all times be correctly screened by the Council’s monitoring system.
The Council on Ethics’ work on conduct-based exclusion
The Council on Ethics conducts its own thorough investigations to identify and assess companies that contribute to, or are themselves responsible for, serious human rights violations, serious violations of individuals’ rights in situations of war or conflict, severe environmental damage, gross corruption or other particularly serious violations of ethical norms. In order to identify companies engaged in such activities, the Council uses, inter alia, an external consultancy firm that carries out Internet-based searches for news items about all the companies in the portfolio, in six languages, on an ongoing basis. The Council receives monthly reports from the consultant on companies that may be engaged in activities that contravene the conduct-based criteria. Since 2009, the Council on Ethics has in addition maintained a consultancy agreement on special news searches on companies domiciled in certain parts of Asia. This agreement was terminated in 2011 because of a high degree of concurrence between this special monitoring and the general news monitoring.
The Council on Ethics also studies certain issues or sectors where it is particularly likely, in the view of the Council, that companies are engaged in activities in contravention of the ethical guidelines. Such sector studies will normally be initiated by the Council appointing an expert within the area to map all companies in the portfolio engaged in a certain type of activities and to collect information about the companies that may pursue activities that violate ethical guidelines. The Council evaluates, based on the consultancy report, which companies it should examine in more detail. This evaluation takes into consideration, inter alia, the magnitude and seriousness of the norm violations, the connection between the companies and the norm violations and the likelihood of future norm violations. Since the previous report to the Storting, the Council has for example embarked on several such sector studies within the environmental area. The studies address certain forms of oil production entailing major local pollution problems, certain types of mining activities in which waste handling poses special risk, unlawful logging and other particularly harmful logging, unlawful fishing and other particularly harmful fishing activities, harmful dam projects, as well as activities having an extensive impact on protected areas of particular value. Within the area of human rights, the Council on Ethics has for several years been paying special attention to infrastructure projects in Myanmar and natural resource extraction in particularly volatile areas in the Democratic Republic of the Congo. Amongst the cases identified through news searches and sector studies, the Council selects, for further investigation, those cases that appear to be the most serious. Weight is attached, inter alia, to how serious the norm violations are, whether a company is accused of several counts of unethical conduct, whether it is likely that such conduct will continue, and the scope for documenting the conduct of which the company is accused. The intention is to identify companies where there is an unacceptable risk that violations of the ethical guidelines are taking place and that such violations are expected to continue.
In order to document alleged norm violations, the Council on Ethics makes extensive use of consultancy firms, research institutions and non-governmental organizations based in the country where the violations of norms are alleged to take place. Such assignments may involve fieldwork and evaluation of documentation. Since 2009, the Council on Ethics has maintained a framework agreement with a consultancy firm that assists in the detailed investigation of companies.
As a result of the revision of the Guidelines for Observation and Exclusion in 2009, the Council on Ethics now contacts companies at a relatively early stage in its examination of the cases. The companies are requested to answer questions or to send specific documents to the Council. In 2011, the Council on Ethics contacted close to 30 companies, and about two-thirds of the companies responded to the Council’s contact. From time to time, companies request a meeting with the Council. In 2011, the Council met with close to ten companies. The Council on Ethics attaches weight to information obtained directly from companies, but also issues recommendations on companies that fail to respond to communication from the Council.
Financial implications of the exclusions
In the NOU 2003: 22 green paper, Management for the Future, the Graver Committee wrote that the exclusion of companies from the investments of the Fund may impair the ratio between return and risk on the part of the Fund. When companies are excluded from the benchmark of the Government Pension Fund, other companies are accorded a higher weight than would otherwise be the case. Since the benchmark of the Fund will therefore have a somewhat different composition than had the original benchmark, return and risk may also be different.
In Report No. 20 (2008-2009) to the Storting, The Management of the Government Pension Fund in 2008,the Ministry wrote that the effect of exclusion will increase in line with the weight accorded to the excluded companies in the original benchmarks for equities and fixed income instruments. The Ministry wrote, furthermore, that the effect would be higher if the exclusions are concentrated in sub-markets that make a special contribution to spreading the risk associated with the Fund.
In Report No. 20 (2008-2009) to the Storting, it was proposed that tobacco investments be excluded from the GPFG. The Ministry wrote, in that context, that tobacco equities had generated a higher return than the world index in 13 of the last 15 years, and that the realised ratio between return and risk was significantly better for companies that produce tobacco than for the market as a whole. The Ministry wrote, furthermore, that the stable consumption pattern characterising tobacco users may result in the value of tobacco companies suffering little exposure to changes in people’s consumption patterns during an economic slump. The Ministry therefore concluded that exclusion of the tobacco sector may mean that one excludes a sector that may reduce the loss incurred by the GPFG during periods of downturn in global equity markets. This appears to be reflected in new analyses performed by Norges Bank; see figure 4.40.
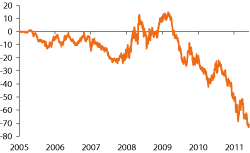
Figur 4.40 Reduced return on the equity portfolio, 2005 to 2011, due to exclusion. Basis points
Kilde: Norges Bank.
Norges Bank has compared the returns on a global equity portfolio with and without the exclusions made in the GPFG over the period from august 2005 to november 2011. The return difference over this period amounts to about NOK 10.6 billion. The return difference has varied, and during brief periods the return with exclusions has exceeded the return without exclusions. The exclusions have reduced the return since late 2009. The negative excess return resulting from exclusions is on par with the aggregate asset management costs of the Fund since 2005.
It is particularly the exclusions of tobacco-producing companies that have contributed to reducing the return on the Fund during the period, see table 4.10. If these are omitted, the difference in returns over the period amounts to about NOK 1 billion.
Tabell 4.10 The five largest sectoral contributions to a change in returns due to the exclusion of equities, 2005-2011. NOK million and basis points
Sector | Contribution in NOK million | Contribution in basis points |
|---|---|---|
Tobacco | - 9,591 | - 64.1 |
Mining | 2,774 | 18.5 |
Consumer goods | - 1,869 | – 12.5 |
Aviation and defence | – 839 | – 5.6 |
General manufacturing | – 400 | – 2.7 |
Kilde: Norges Bank.
The analyses referred to in Report No. 20 (2008-2009) to the Storting were unable to demonstrate any material actual difference in return or risk as the result of exclusion. Looking at the effect of the exclusions on the risk and return characteristics of the equity portfolio, the analysis performed by Norges Bank shows that the portfolio without exclusions would have generated an annual return over the period 2005-2011 of 1.41 percent with a risk (volatility) of 17 percent. The portfolio with exclusions generates an annual return of 1.31 percent with a risk of 17 percent. Over the period 2005-2011, the actual return has consequently been somewhat lower and actual risk more or less unchanged as a result of the exclusions. Historical return and risk do not necessarily provide a good estimate of future developments. The exclusions from the Fund are ethically motivated, not financially. For an investor with a long-term perspective there may, but will not necessarily, be concurrence between what is in the financial interest of the investor and what follows from taking ethical considerations into account. The Ministry believes that good returns in the long run depend on sustainable development in the economic, environmental and social sense, and applies the tools available to it as a financial investor to contribute to such development.
4.4.5 The Ministry’s assessment
It is the assessment of the Ministry that Norges Bank, Folketrygdfondet and the Council on Ethics are exercising their mandates relating to responsible investment practice in a satisfactory manner. The Ministry notes that the work is progressing, and that it seems as if the work is being linked ever more closely to the key objective for the savings through the Government Pension Fund, which is good long-term financial return.
The ownership activities constitute a key tool in the responsible investment practice of the Government Pension Fund. Both Norges Bank and Folketrygdfondet have expanded their ownership activities in line with international developments within the area, and have ensured interaction between the ownership activities and the asset management activities. Cooperation with other investors and participation in international forums or research projects generate knowledge. This enables the Fund to refine its own strategies, and to contribute to best practice internationally.
The exclusion of companies is a tool reserved for special cases. The Council on Ethics monitors the portfolio on the basis of guidelines laid down by the Ministry, but it cannot be guaranteed that all companies that may conceivably be in violation of the guidelines at any given time have been excluded from the Fund. One may also mistakenly exclude companies without sufficient grounds.
The Guidelines for Observation and Exclusion govern the efforts of the Council on Ethics, as well as those of Norges Bank and the Ministry. The exclusion and observation work involves three different players. This may entail certain operational challenges. It may, inter alia, be challenging to ensure a good flow of information between the players, and in some cases it may take a long time to process a matter.
It cannot be ruled out that changes may take place in company conduct or production during the period after a recommendation has been issued to the Ministry of Finance, but prior to the announcement of exclusion. It may be challenging to keep track of such information. In one case in 2011, an excluded company (FMC) argued that the circumstances that formed the basis for exclusion, the purchase of phosphate from Western Sahara, no longer applied as per the date of the announcement of the exclusion. The Council on Ethics immediately embarked on a dialogue with the company to establish the facts. The company has not provided any new information on the matter as per 22 March 2012.The Council on Ethics has adopted new procedures for the monitoring of companies to uncover any new information of significance to a recommendation, after a recommendation has been given by the Council. Such information will be passed on to the Ministry. The Ministry has also reviewed and amended its procedures. Nevertheless, the present system constitutes a source of operational risk, and it cannot be ruled out that exclusion may take place on the basis of circumstances that no longer apply as per the exclusion date. This may result in unmerited reputational damage on the part of the affected company. The policy of high transparency with regard to the decisions of the Ministry, as well as long and detailed recommendations, may in such cases have a negative impact on the companies.
It is important to be conscious of these consequences of the current system and organisation of the exclusion and observation work.
The Ministry will continue to work on the strategy for responsible investment practice for the Government Pension Fund. It aims for the strategy to contribute to defining best practice within the area. It will, inter alia, be appropriate to examine more closely which approaches are most meaningful for an investor with the special characteristics of the GPFG, i.e. very large, long investment horizon and with broad diversification of risk. Measures and initiatives aimed at improving market practice on the part of broad company segments may be particularly well suited for contributing to more sustainable solutions, as well as well-functioning and legitimate market conditions in the longer run.
5 Further development of the management framework of the Government Pension Fund
5.1 Introduction
The Storting has, in the Act relating to the Government Pension Fund, made the Ministry of Finance responsible for the management of the Fund. Operational management of the Government Pension Fund Global (GPFG) and the Government Pension Fund Norway (GPFN) is carried out by Norges Bank and Folketrygdfondet, respectively. The Ministry has issued provisions on Norges Bank’s and Folketrygdfondet’s management in separate mandates. The mandates describe the general investment frameworks for the two funds and stipulate requirements with regard to risk management, reporting and responsible investment practices.
The governance model underpinning the management of the Fund was outlined in Report No. 15 (2010-2011) to the Storting, The Management of the Government Pension Fund in 2010. This implies that the Storting, through its deliberation of the annual report on the Government Pension Fund, takes a view on important aspects of the management of the Fund. The comments of the Storting on the report form the basis for the limits and provisions laid down by the Ministry in the mandates for the GPFG and the GPFN. The mandates are general in nature and based on principles. The general investment limits and the provisions on the management and measurement of risk need to be supplemented by more detailed limits and rules at the various decision-making levels down through the management chain. Consequently, the model implies, all in all, very detailed regulation of the management of the Government Pension Fund, see figure 5.1, which presents the hierarchy of management documents governing the management of the GPFG.
The entire framework governing the management of the Government Pension Fund is available on the Ministry’s website (www.government.no/gpf), whilst supplementary management provisions adopted by the Executive Board of Norges Bank and the Board of Directors of Folketrygdfondet are available on the websites of the managers (www.nbim.no and www.ftf.no).
5.2 New financial reporting provisions for Folketrygdfondet
The Ministry laid down new financial reporting regulations for Folketrygdfondet on 8 December 2011. The regulations entered into force on 1 january 2012, with effect for the financial year commencing after 31 December 2011. The regulations imply that Folketrygdfondet:
is required to prepare annual financial statements and annual reports based on the International Financial Reporting Standards (IFRS).
shall include financial reporting in respect of the GPFN in annual financial statements.
shall prepare quarterly financial statements that include, at a minimum, quarterly financial reporting for the GPFN. The quarterly financial statements shall be signed by the board of directors and be subject to simplified auditor checks.
The structure and contents of the financial reporting regulations are in line with the Regulations relating to the Annual Financial Statements, etc., which were adopted for Norges Bank on 1 January 2011.
The purpose of the new financial reporting provisions is to evolve the framework governing Folketrygdfondet, with a view to ensuring that it is in line with recognised standards and best practice.
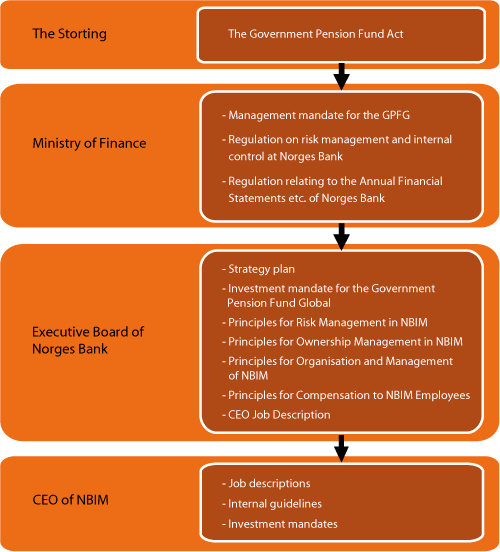
Figur 5.1 The hierarchy of management documents governing the management of the GPFG
Kilde: Norges Bank and Ministry of Finance.
Footnotes
In currencies from Asia/Oceania, the index included treasuries only.
See www.nbim.no/en/press-and-publications/discussion-notes/.
South Korea is classified as an emerging market in MSCI’s equity index, but as a developed market in the FTSE index. If the FTSE definition is used, Harvey’s recommended emerging-markets proportion is around 15 percent.
See the note “The History of Rebalancing of the Fund” (http://www.nbim.no/en/press-and-publications/discussion-notes/).
See the note “Time-varying Expected Return, Investor Heterogeneity and Rebalancing” (http://www.nbim.no/en/press-and-publications/discussion-notes/).
The price of an equity investment can be expressed as the present value of an uncertain future cash flow, where the required return takes risk into account. Expected returns in excess of a risk-free interest rate are referred to as the risk premium (or equity premium).
Cochrane, J. (2011), “Presidential Address: Discount Rates”, Journal of Finance, vol. LXVI, NO. 4, August 2011.
See the notes “Alternatives to a Market-Value-Weighted Index” and “Capturing Systematic Risk Premia” (www.nbim.no/en/press-and-publications/discussion-notes/).
See the note “Capturing Systematic Risk Premia”, which describes various methods for exploiting systematic risk premiums in the Fund’s share portfolio. Norges Bank is focusing on the five risk premiums of value, size, momentum, volatility and illiquidity.
See the note “Alternatives to a Market-Value-Weighted Index”.
The FTSE Global All Cap index is adjusted for free flow. This implies that the weights are adjusted downwards in respect of the ownership stakes of large long-term owners, as well as in respect of cross ownership, because these ownership stakes are not freely transferable.
Calculated by multiplying the excess return over the month by the assets at the beginning of such month, and thereafter adding up this number over all the months. Consequently, the calculation does not take the compound interest effect into consideration.
Calculated by multiplying the excess return over the month by the assets at the beginning of such month, and thereafter adding up this number over all the months. Consequently, the calculation does not take the compound interest effect into consideration.
See http://www.nbim.no/Global/Reports/2010/Executive%20Board%20Principles%20for%20Risk%20Management.pdf and http://www.nbim.no/Global/Reports/2010/Investment%20mandat.pdf.
This discussion is based on reports and other information published by Norges Bank, including, inter alia, through the ordinary quarterly reporting for the Fund and through postings on the Bank’s website; www.nbim.no.
One of these companies is excluded on the basis of both the environmental and the human rights criterion.