Part 1
The Management of the Government Pension Fund
1 Introduction
With effect from 1 January 2006, the Government Pension Fund was established as a superstructure encompassing the Government Pension Fund Global (GPFG) and the Government Pension Fund Norway (GPFN). The Government Pension Fund has no governing bodies or employees of its own, and is not a separate legal entity. The GPFG and the GPFN are managed by Norges Bank and Folketrygdfondet, respectively, under mandates set by the Ministry of Finance.
In this report, the Ministry of Finance presents management performance and assessments of the Government Pension Fund for 2012. Assessments of the investment strategy are also presented, and an account is given of the efforts made to further develop the management framework.
Good results
The Fund performed well in 2012. The return on the GPFG was 13.4 percent and the return on the GPFN was 12.2 percent, before the deduction of management costs. The return on the GPFG is measured in the currency basket of the Fund, whilst the return on the GPFN is measured in Norwegian kroner. The active management of both Norges Bank and Folketrygdfondet delivered a positive contribution to returns in 2012. The management costs associated with the GPFG and the GPFN, accounted for 0.06 percent and 0.09 percent of fund assets, respectively. The overall value of the Government Pension Fund was NOK 3,961 billion at the end of 2012; an increase in value of NOK 520 billion from the beginning of that year.
The performance reflects the favourable developments in global equity and bond markets in 2012. Equity prices appreciated over the year as the result of, inter alia, monetary policy measures in the Euro zone that contributed to increased risk appetite on the part of investors. Moreover, declining yields on long-term government bonds contributed to higher bond prices and returns.
Future economic developments are still subject to considerable uncertainty globally. Going forward, one needs to be prepared for significant fluctuations in the value of the Fund.
Returns in 2012 were considerably higher than the long-term expectations of the Ministry, although well within what must be characterised as normal year-by-year return fluctuations. The average annual return before management costs from January 1998 to December 2012 was 5.0 percent for the GPFG and 6.6 percent for the GPFN. Returns have fluctuated considerably. Over this 15 year period, the annual return on the GPFG has varied between -23 percent and 26 percent, whilst the annual return on the GPFN has varied between -25 and 34 percent.
The average real rate of return on the GPFG from January 1997 to December 2012 was 3.2 percent, net of inflation and management costs, compared to 2.7 percent at yearend 2011. The realised real rate of return is fairly close to the 4-percent real rate of return expected in the long run, given normal fluctuations in average returns.
Fund performance since 1998 reflects the fact that bond returns have been historically high over this period, and exceeded those on equities. This means that investors have not been compensated for the risk associated with the fact that the value of equities tends to be more volatile than bonds. The interest rate level has declined over the last 15 years. At the same time, the financial markets have suffered a number of major crises.
Although the overall return on the Fund varies considerably from year to year, the recurring income from equities, bonds and real estate in the form of dividends, coupons and rent is more stable. At present, the recurring income of the GPFG is in the range of NOK 110 billion per year, or about 3 percent of the fund capital, whilst the recurring income of the GPFN is about NOK 6 billion, or close to 4.5 percent of its capital.
The aggregate return on the GPFG’s investments since the initial capital contribution in 1996 was NOK 1,087 billion, net of management costs, at the end of 2012. The aggregate return on investments made through the GPFN since January 1998 was NOK 136 billion. The high return in NOK relative to the current size of the GPFN must be seen in the context of the repayment of NOK 101.8 billion worth of account loans to the State in December 2006. This just about halved the GPFN’s capital.
The Ministry is committed to cost-effective management of the Government Pension Fund. Comparisons with other funds show that the management costs of the GPFG and the GPFN are relatively low. From 1999 to 2012, the annual management costs of the GPFG have declined from 0.09 percent of the capital to 0.06 percent, whilst those of the GPFN have increased from 0.02 percent to 0.09 percent. The increase in the management costs of the GPFN must be seen in the context of the aforementioned reduction in assets under management in 2006, and a significant cost increase associated with new management systems at Folketrygdfondet, cf. Report No. 15 (2010-2011) to the Storting – The Management of the Government Pension Fund in 2010.
Further development of the investment strategy
The investment strategy of the Government Pension Fund is based on the Fund’s purpose, assumptions regarding the functioning of the financial markets, as well as the special characteristics and comparative advantages of the Fund. The strategy is premised on seeking the maximum possible return over time, given a moderate level of risk. The Ministry emphasises the Fund’s role as a responsible investor. Good long-term financial return is assumed to depend on sustainable development in economic, environmental and social terms, and on well-functioning, efficient and legitimate markets.
The Government Pension Fund has a very long investment horizon. The Fund has no clearly defined liabilities, and it is unlikely that the State will need to withdraw large amounts from the Fund over a short period of time. Generally speaking, these characteristics give the Fund a greater ability to absorb risk than many other investors.
The investment strategy of the Fund is characterised, in particular, by seeking to exploit the long investment horizon of the Fund and profiting from risk premiums over time, by the investments being widely diversified, as well as by responsible investment practices, cost effectiveness, a moderate element of active management and a clear governance structure. The investment strategy of the GPFG is outlined in more detail in chapter 2 of this report, whilst the strategy of the GPFN is discussed in chapter 3.
The investment strategy of the Fund is based on assessments of expected return and risk in the long run and the assumption that one has to accept a certain degree of risk to achieve a satisfactory expected return over time. Experience gained from the management of both the GPFG and the GPFN in recent years has demonstrated that one needs to be prepared for periods of considerable market volatility, during which the investments of the Fund may fluctuate significantly in value. One has managed to maintain the investment strategy even though there have been major fluctuations in the Fund’s return. Section 2.5 of the report takes a closer look at analyses of the risk associated with the GPFG.
Over time, a number of important decisions have been made in refining the strategy of the GPFG. The investments of the Fund have gradually been expanded to include new asset classes, countries and companies. By increasing the equity portion from 40 percent to 60 percent, both expected return and risk have increased.
In Report No. 15 (2010-2011) to the Storting – The Management of the Government Pension Fund in 2010, the Ministry outlined some perspectives on further developing the strategy of the GPFG. It was noted, inter alia, that the GPFG holds a significantly smaller portion of investments in private equity and infrastructure than do other major funds internationally. Furthermore, it was noted that the size and long investment horizon of the Fund make it appropriate to consider such investments. At the same time, the assessment was that it is uncertain whether the GPFG would be able to achieve a satisfactory risk-adjusted return on such investments, net of costs. The Ministry emphasised that one should first gain experience from the largest and most developed unlisted market; the market for real estate. At the same time it was pointed out that the GPFG’s characteristics make it appropriate to revisit the question about private equity and infrastructure at a later stage.
In 2012, the Ministry adopted a number of changes to the investment strategy of the GPFG; cf. Report No. 17 (2011-2012) to the Storting – The Management of the Government Pension Fund in 2011. A new, simplified benchmark index was introduced for the fixed income portfolio. Some types of government-related and securitised bonds were removed from the benchmark index, whilst it was expanded to include government bonds from emerging economies. A new geographical distribution was adopted for the equity benchmark index, implying a wider distribution of these investments. Overall, these changes amounted to a shift in the distribution of the benchmark indices across geographical regions. The changes are being implemented over time. In the autumn of 2012, the Ministry adopted a new rule for rebalancing of the GPFG, which entailed simplifications and increased management transparency; cf. Report No. 1 (2012-2013) to the Storting – The National Budget for 2013.
This year’s report does not present plans for major changes to the investment strategy of the Fund. On the other hand, the report discusses various aspects of the strategy and reports on and follows up on decisions made in recent years.
One theme in this year’s report is the composition of the equity investments of the GPFG and characteristics of strategies that seek to exploit systematic risk factors. One example of such a factor is “value”, which reflects the observation that companies with low valuations have over time delivered higher returns than companies with high valuations. Another example is “size”, which reflects the observation that small companies have over time delivered higher returns than large companies (measured by market capitalisation). Analyses of systematic risk factors in the equity portfolio of the Fund and a discussion of how one might implement investments focused on such risk factors, is found in section 2.2.
The Ministry’s assessment is that the benchmark index of the GPFG should not be adjusted for systematic risk factors. Any strategies for exploiting systematic risk factors should form part of the operational management of Norges Bank.
Another theme of this report is whether the fixed income benchmark index of the GPFG should be further simplified by removing so-called inflation-linked bonds, in line with the advice given by Norges Bank in its letter of 9 August 2012 to the Ministry. This issue is discussed in section 2.3. The analyses conducted by the Ministry thus far indicate that such bonds should continue to form part of the GPFG benchmark index. However, one may want to revisit the issue at a later date, from the perspective of a more comprehensive assessment of how changes in inflation may influence the overall risk and return characteristics of the Fund.
Norges Bank is in the process of building up a real estate investment portfolio in the GPFG. In section 2.4, the Ministry presents analyses of risk and return that compare different methods of implementing real estate investments. The analysis addresses investments in both unlisted and listed real estate.
Responsible investment practice
The Ministry is committed to managing the assets of the Government Pension Fund in a responsible manner. The asset management must therefore be organised in a way that achieves good long-term return, whilst at the same time maintains the Fund’s role as a responsible investor.
Responsible investment, including the exercise of ownership rights and the observation and exclusion of companies, forms an integrated part of the management of the Fund and is discussed in detail in section 4.4. Considerable experience has been gained through work within this area over the last decade, and the responsible investment strategy has been developed over time. In 2004, ethical guidelines were introduced. The guidelines were evaluated in 2009. The evaluation indicated that more emphasis should be given to the potential for contributing to positive change in the conduct of companies and that the interaction between exercise of ownership rights and exclusion of companies should be strengthened. 2010 saw the establishment of a new mandate for responsible investment to Norges Bank and new guidelines on observation and exclusion.
It is the ambition of the Ministry that all aspects of the management of the GPFG and the GPFN shall be in line with best practice internationally. The Ministry is therefore committed to the further development of the responsible investment strategy; see also Report No. 17 (2011-2012) to the Storting.
In January 2013, the Ministry instructed the Strategy Council for the GPFG to prepare a report on the overall responsible investment strategy of the Fund. Valuable expertise has been accumulated by the Council on Ethics, Norges Bank and the Ministry of Finance. In its report, the Strategy Council will, inter alia, examine how the collective resources and expertise can best be utilised to strengthen the responsible investment work further. An important premise underpinning the work is an ambition to eliminate any deviations from best practice internationally, thus placing the Fund at the forefront of developments. The Council may propose any changes it believes can strengthen the work on responsible investment, including operational and institutional changes. The report will be submitted in the autumn of 2013. The mandate of the Strategy Council is addressed in further detail in section 4.4 of this report.
Transparent management and a strategy which enjoys widespread support
It is important for the management of the Government Pension Fund to enjoy widespread support, thus enabling us to adhere to the long-term strategy, especially during times of market volatility. Prudent long-term management is necessary to ensure that the revenues originating from the petroleum resources will benefit both current and future generations.
The Ministry emphasises that the risk in the management of the Fund is communicated, managed and controlled in a clear and effective manner. Nonetheless, experience shows that it is challenging to uncover all types of risk. Section 4.3 addresses verifications of return data and independent control of frameworks and processes for the management and control of risk.
Transparency is a prerequisite for securing widespread confidence in the management of the Government Pension Fund. The Ministry seeks to facilitate a broad-based debate on important aspects of the Fund’s investment strategy. Material changes are submitted to the Storting. A thorough decision-making process is a strength of the investment strategy.
Alongside the reporting of Norges Bank and Folketrygdfondet, this report is intended to contribute to transparency and broad-based debate concerning the management of the Fund.
2 The investment strategy of the Government Pension Fund Global
2.1 The background to the investment strategy
2.1.1 Developments over time
The investment strategy of the GPFG has been developed over time and is based on comprehensive professional assessments. Key decisions in the development of the strategy have been submitted to the Storting. Figure 2.1 shows milestones in the development of the investment strategy.
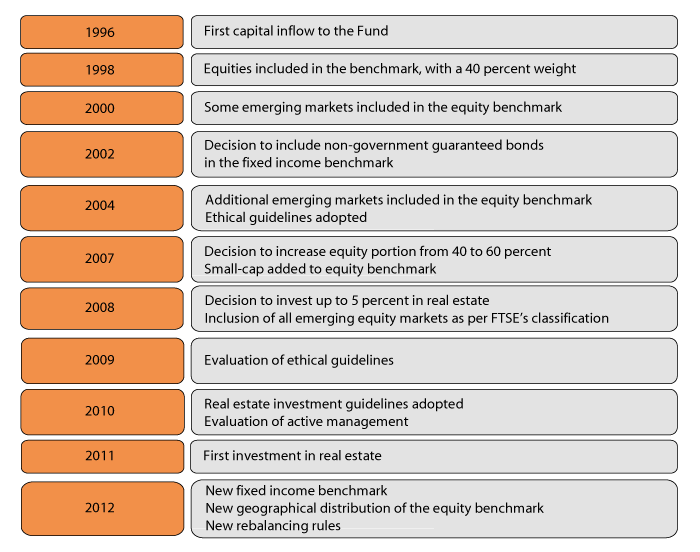
Figure 2.1 Milestones in the development of the GPFG investment strategy
Source Ministry of Finance.
The Government Petroleum Fund was established in 1990, upon the enactment of the Petroleum Fund Act by the Storting. The first transfer of capital to the Fund was made in May 1996 against the background of a fiscal account surplus for 1995. Until 1998, the fund capital was invested in government bonds from eight countries.
In 1998, equities were included in the benchmark index of the Fund, with the initial equity portion being 40 percent. The investment universe was expanded to include 21 countries. Two years later, in 2000, some emerging markets were also included in the equity benchmark. The fixed income benchmark was expanded through the inclusion of non-government guaranteed bonds from 2002.
In 2001, the Ministry introduced an arrangement for the exclusion of investments that were deemed to be in conflict with Norway’s commitments under international law, based on advice from the Petroleum Fund’s Advisory Commission on International Law. In 2004, ethical guidelines for the Fund were adopted. The ethical guidelines were evaluated in 2009. This resulted in new guidelines on responsible investment; cf. the discussion in section 4.4.
In 2007, it was decided to include the small-cap segment in the equity benchmark and to increase the equity portion from 40 percent to 60 percent. The increase in the equity portion was completed in the first half of 2009. In 2008, the equity benchmark was expanded through the inclusion of all emerging stock markets as per the classification of the index provider, FTSE.
Experience from the financial crisis in 2008–2009 demonstrated that there was a need for a new evaluation of the theoretical underpinnings of active management, as well as for clarifying the role of active management as part of the overall investment strategy. Active management was therefore subjected to a comprehensive evaluation in the report submitted to the Storting in the spring of 2010. The evaluation resulted in a number of changes to the guidelines. The limit for expected tracking error, which is of key importance in limiting the market risk associated with the Fund, was changed. At the same time, the Ministry announced regular evaluations of active management at the beginning of each term of the Storting and that such evaluations may lead to upwards or downwards adjustments in the scope of active management.
In 2008, it was decided to invest up to 5 percent of the fund capital in a separate real estate portfolio. The fixed income portion will be reduced correspondingly. Real estate investment guidelines were adopted on 1 March 2010; cf. Report No. 10 (2009–2010) to the Storting – The Management of the Government Pension Fund in 2009. The first investments were made in Europe. At the end of 2012, the real estate portfolio, which comprised investments in office and retail properties in several European countries, represented 0.7 percent of the value of the Fund. It has from the outset been the intention to permit global real estate investments. The mandate for the GPFG was amended with effect from 1 January 2013, to allow the real estate portfolio to be invested worldwide. The real estate portfolio is discussed in sections 2.4 and 4.3.1 and chapter 5.
Further changes to the investment strategy were presented in Report No. 17 (2011–2012) to the Storting – The Management of the Government Pension Fund in 2011. The purpose of these changes was to further improve the distribution of the Fund’s investments across countries and geographical regions.
The report proposed a new benchmark index for the fixed income portfolio. The currency weights of the benchmark index were previously fixed at 60 percent European currencies, 35 percent North-American currencies and 5 percent currencies from Asia and Oceania. The new benchmark index excludes some sub-segments of for government-related and securitised bonds. The fixed income benchmark index comprises a government fixed income portion (70 percent) and a corporate fixed income portion (30 percent). The role of the government fixed income portion is, in particular, to reduce the volatility of the Fund’s returns. The country composition of this sub-index is determined by the size of each country, as measured by GDP. Moreover, a provision was added to the mandate for the GPFG to the effect that Norges Bank shall seek to take account of differences in fiscal strength between countries in the composition of government bond investments. Bonds issued by corporations are expected to make somewhat more of a contribution to the expected return on the Fund as the result of, inter alia, an expected compensation for the credit risk associated with such investments. The corporate fixed income benchmark also includes covered bonds and is based on global market weights. In the report, the Ministry proposed that the government fixed income benchmark be expanded to include all currencies approved by the index provider, Barclays. The changes entailed a lower portion of European currencies and a higher portion of North American and Asian currencies. The Storting endorsed these changes, cf. Recommendation No. 361 (2011–2012).
Plans were also proposed for a new geographical distribution of the equity benchmark, which was endorsed by the Storting. The Ministry has adopted a new equity benchmark in the wake of the deliberations of the Storting. The equity benchmark previously featured a fixed distribution, with 50 percent Europe, 35 percent America and Africa and 15 percent Asia and Oceania. The distribution between companies within each region was based on the market value of the companies. The new benchmark does not feature fixed regional weights. Instead, the geographical distribution will change in line with relative developments in the size of the world’s stock markets. The portion of developed markets in Europe in the benchmark will remain somewhat higher than indicated by global market weights, whilst the portion of developed markets in North America will be somewhat smaller. The portion accounted for by emerging markets in all regions and developed markets in Asia and Oceania will be in line with global market weights. The specific rule for determining the benchmark is set out in the mandate for the management of the GPFG, which is available on the Ministry website (www.government.no/gpf).
Based on market values at the beginning of 2012, the new benchmarks implies that the portion in Europe is reduced by a total of 13 percentage points, from 54 percent to 41 percent, whilst the portion in emerging markets is increased by a total of 4 percentage points, from 6 percent to 10 percent. At the end of 2012, the overall European portion in the equity and fixed income benchmarks has been reduced to just short of 47 percent. The emerging market portion has been increased to just short of 9 percent. At yearend, adaptation of the benchmark had progressed further for bonds than for equities. European currencies then accounted for somewhat in excess of 43 percent of the fixed income benchmark, whilst the European stock market portion of the equity benchmark was just short of 49 percent. Adaptations to the new geographical distribution will continue in line with the targets outlined in Report No. 17 (2011-2012) to the Storting. It follows from the new benchmarks that the equity and corporate fixed income portions of various regions and countries will depend on market developments, whilst the government fixed income portions will depend on relative GDP developments.
Report No. 17 (2011-2012) to the Storting also presented the background to, and experience from, rebalancing of the benchmark index of the GPFG. The purpose of rebalancing is to ensure that the benchmark does not deviate significantly from the strategic distribution across various asset classes over time. Rebalancing may also contribute to increasing the return on the Fund, if one sells equities when equity prices are high and purchases them when prices are low. Rebalancing does, on the other hand, involve transaction costs because, inter alia, the necessary trades may affect market prices. New guidelines for rebalancing the benchmark index were adopted with effect from 8 October 2012; cf. the detailed discussion in Report No. 1 (2012-2013) to the Storting – The National Budget for 2013. The equity portion shall be rebalanced back to the strategic weight of 60 percent if the equity portion of the benchmark deviates by more than four percentage points from the strategic benchmark index as per month end.
Norges Bank provides investment strategy advice to the Ministry of Finance. Advice may be provided on the initiative of the Bank or on request from the Ministry. This report discusses various pieces of advice provided by Norges Bank, as well as discussion notes prepared as background to the advice provided by the Bank. These are available on the website of the Bank (www.nbim.no/en).
A Strategy Council, comprising external experts, has also been appointed to evaluate the work of the Ministry and provide professional inputs to further enhance the investment strategy. The mandate and the composition of the Council vary over time. The Strategy Council for the GPFG in 2013 evaluates the overall responsible investment strategy of the Fund, cf. section 4.4.5.
In addition, the Ministry commissions advice and assessments from academics and other recognised experts on relevant topics on a regular basis. This report discusses a report from the index and analytics provider MSCI on so-called systematic risk factors in the stock market, as well as a report from Professors Frank de Jong and Joost Driessen on liquidity. The reports are available on the Ministry website (www.government.no/gpf).
2.1.2 Main features of the investment strategy
The long-term investment strategy of the GPFG stipulates a fixed equity portion of 60 percent. The fixed income portion was 40 percent until 2010. The mandate was changed in 2010. Over time, Norges Bank will invest up to 5 percent of the fund capital in a separate real estate portfolio. The fixed income portion will be reduced correspondingly. The distribution between equities, fixed income and real estate is reflected in the strategic benchmark index of the Fund, cf. figure 2.2. The benchmark index constitutes a detailed description of how the fund capital would be invested if Norges Bank refrained from utilising its scope for deviating from the benchmark.
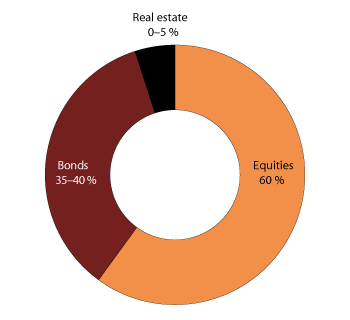
Figure 2.2 Strategic benchmark index for the GPFG. Percent
Source Ministry of Finance.
The development of the investment strategy of the GPFG is premised on seeking to maximize the international purchasing power of the fund capital, given a moderate level of risk. The strategy is based on assessments about expected risk and return in the long run and is derived from the purpose of the Fund, the special characteristics of the Fund, as well as assumptions regarding the functioning of the financial markets.
Over time, the Ministry of Finance and Norges Bank, in their respective capacities as the owner and manager of the Fund, have developed an investment strategy with the following characteristics:
harvesting risk premiums over time;
diversification of investments;
exploitation of the Fund’s long investment horizon;
responsible investment practices;
cost effectiveness;
a moderate degree of active management; and
a clear governance structure
The investment strategy is based on a premise that one has to accept a certain level of risk in order to achieve a satisfactory expected return over time. This expected additional return is referred to as a risk premium. Equities are, for example, more risky than bonds. Investors will expect compensation for this in the form of a higher expected return on equity investments. The size of this additional return, or equity premium, is uncertain and will vary over time.
The choice of equity portion is the decision with the main impact on the overall risk associated with the Fund. Other risk premiums are, inter alia, related to the fixed interest rate period of bonds (term premium) and to the risk of the borrower defaulting on its liabilities (credit risk). In section 2.2 assessments of potential systematic risk factors in the stock market are discussed.
The management of the Fund is not aimed at minimising the return volatility. Such a strategy would produce a significantly lower expected return. The GPFG has a greater ability to bear risk than many other investors. This is, inter alia, because the Fund has no clearly defined future liabilities, as well as a very long time horizon.
When investments are diversified across many securities, the overall risk may become smaller than the sum of the risk associated with each individual investment. The investments of the Fund have been diversified across several asset classes over time, and the Fund is currently invested in equities, bonds and real estate. Moreover, the investments of the Fund are diversified across markets in many countries. In each market, the investments are distributed across a number of individual companies and bond issuers. The new equity and fixed income benchmark indices discussed above, as well as a global real estate investment mandate, contribute to further diversification of the investments across various countries and regions.
The investments of the GPFG are of a long-term nature. It is unlikely that the State will need to withdraw large sums from the Fund during a short period. The Fund is a general savings instrument, and unlike a traditional pension fund it is not earmarked for any specific liabilities. Moreover, the Fund does not depend on short-term financing, and is not subject to regulations which could force sales at undesirable points in time.
The long horizon makes it easier to endure major fluctuations in the return on the Fund from year to year. Hence, this long-term nature supports the decision to invest 60 percent of the Fund in equities. The equity investments, which give us ownership stakes in global production capacity, are expected to contribute substantially to return over time. They do, at the same time, entail increased fluctuations in fund performance.
The strategy of the GPFG also exploits its long-term nature by investing in assets which are, for short or long periods, less liquid. The market for unlisted real estate investments is an example of a large market requiring a long time horizon as the result of, inter alia, low liquidity. Studies of the strategies of other funds show that large investors hold larger portions of unlisted investments than do small investors. This may indicate that there are advantages of scale in the management of such investments, which may originate in both lower costs and higher returns.
The time horizon of the Fund is also exploited by pursuing a strategy in which the equity portion is maintained over time through so-called rebalancing.
The GPFG shall adopt responsible investment practices that promote good corporate governance and take social and environmental factors into account, in accordance with international best practice. Responsible investment practices support the goal of achieving a satisfactory return over time, in addition to being a prerequisite for ensuring that the management of the Fund is supported by the Norwegian population. The Fund’s role as a responsible investor is expressed in, inter alia, the Guidelines on the Observation and Exclusion of Companies, of 1 March 2010. The Council on Ethics advises the Ministry on observation and exclusion, based on these guidelines. Norges Bank exercises the ownership rights of the Fund on the basis of internationally recognised principles and standards. The exercise of ownership rights shall contribute to ensuring that the interests of companies are better aligned with the interests of the GPFG as a long-term investor. Besides, Norges Bank shall integrate corporate governance, environmental and social considerations into its investment activities. Responsible investment practice is discussed in more detail in section 4.4.
The mandate stipulated for Norges Bank requires the Bank to seek to maximize the return net of costs. This is consistent with the stated aim of realising economies of scale in asset management. Nonetheless, the objective is not low costs per se, but high net returns. Comparisons with other large funds show that Norges Bank’s management costs are relatively low. Over time, management costs as a proportion of the fund capital have fallen; cf. the discussion in section 4.1. Management costs will vary more in unlisted markets than in listed markets, and can be high. However, large investors have historically incurred lower management costs than small investors, measured as a proportion of assets under management.
The mandate for the GPFG contains a framework for the fund’s management. It defines, inter alia, equity and fixed income benchmark indices. Most of the risk associated with the Fund over time is principally the result of developments in these benchmark indices. At the same time, the mandate also specifies the scope for deviations from the benchmarks, which implies a moderate element of active management of the Fund.
Norges Bank shall achieve the highest possible return within the limits set by the mandate. The Bank describes its strategy through NBIM’s strategic plan. Norges Bank’s fund managers use fundamental analysis of individual stocks or bonds to identify securities that are expected to generate good earnings and returns over time. When the strategic benchmark indices are changed or when the Fund receives a transfer of capital Norges Bank makes the necessary adjustments in the Fund in the most efficient way, for example by avoiding unnecessary transaction costs.
Norges Bank has developed operational reference portfolios for the management of the Fund, cf. the further discussion in sections 2.2, 2.3 and 4.1. These are tools for managing and communicating long-term adjustments made by the Bank in its management of the equity and fixed income investments, relative to the benchmark index from the Ministry of Finance. The objective is to achieve a better ratio between expected return and risk, net of costs.
The management of the GPFG is premised on a clear governance structure in which the Storting, the Ministry of Finance, the Executive Board of Norges Bank and the asset management unit Norges Bank Investment Management (NBIM), as well as internal and external asset managers, all have different roles and responsibilities. Duties and authorisations are delegated downwards through the system, whilst reports on results and risk are passed upwards, cf. chapter 5 and Report No. 15 (2010-2011) to the Storting – The Management of the Government Pension Fund in 2010.
2.2 Systematic risk factors in the equity portfolio
2.2.1 Introduction
The management of the equity portfolio of the GPFG is premised on a benchmark index defined by the Ministry. The composition of the equity benchmark is based on a principle of market value weights. This means that each company is included in the benchmark with a weight equal to the market value of the company as a proportion of the aggregate value of the equity market. A market value weighted benchmark reflects the investment opportunities available to a typical investor and may be considered the average portfolio held by all investors. Developments in a market value weighted benchmark show developments in the overall stock market value.
The risk associated with developments in the overall stock market is often referred to as market risk. Investors who are willing to accept market risk expect to be compensated in the form of higher expected returns over time than had they invested in less risky investments. The expected additional return is often referred to as the stock market risk premium. The stock market risk premium is the key risk premium for equities.
Over time, a number of systematic return patterns for equities have been uncovered. Research shows that several different stock characteristics appear to influence their value over time. It is common to focus on characteristics like value, size, momentum, liquidity and volatility. These characteristics have turned out to explain the returns on a broad range of stocks, and are therefore often called systematic risk factors, cf. definitions in table 2.1.
Table 2.1 Well-known risk factors in equity markets
Risk factor | Definition |
|---|---|
Value | Stocks of companies with low valuations (value stocks) have had a different and over time higher return than stocks with high valuations. Valuation is measured by the market value of equity relative to fundamentals like the company’s book value of equity, profits, sales or dividends. The value factor is calculated as the return on stocks with low valuations less the return on stocks with high valuations. |
Size | Stocks of small companies have had a different and over time higher return than stocks of large companies. Size is measured by the market value of the company. The size factor is calculated as the return on stocks of small companies less the return on stocks of large companies. |
Momentum | Stocks that have recently had high returns (stocks with high momentum) have had a different and over time higher return than stocks that have recently had low returns. The momentum factor is calculated as the return on stocks with high momentum less the return on stocks with low momentum. |
Liquidity | Stocks that are not readily tradable (low liquidity stocks) have had a different and over time higher return than stocks that are more readily tradable. This is particularly the case when stock liquidity declines during periods of market turbulence or when the liquidity of the overall stock market declines. It is difficult to measure liquidity, and many different measures are therefore being used. The liquidity factor is calculated as the return on stocks deemed to have low liquidity less the return on stocks deemed to have high liquidity. See also box 2.3. |
Low volatility | Stocks with small price fluctuations (low volatility stocks) have had a different and over time higher risk-adjusted return than stocks with large price fluctuations. By risk-adjusted return is meant the return per unit of risk, and more specifically market risk. Price fluctuations are measured as the standard deviation of stock prices. The factor low volatility is calculated as the return on stocks with low volatility less the return on stocks with high volatility. |
Source Ministry of Finance.
Statistical analyses show that tilting the composition of an equity portfolio towards these factors has delivered higher returns over time historically. For example, it has been profitable to hold somewhat more of the smallest companies and somewhat more of the stocks with the highest return preceding the time of investment. The factors have therefore received considerable attention, also in practical asset management.
Historical excess returns cannot in themselves justify expectations of future excess returns. They should be underpinned by theoretical models. However, the academic literature on systematic risk premiums shows there is no agreement as to the causes of the factors and why they have generated excess returns, cf. box 2.1 and chapter 6 in part II of this report.
Textbox 2.1 Underpinnings of the risk factors
There is extensive research on the underpinnings of systematic risk factors. Important points from this research include:
Systematic risk factors are important in explaining the return differences between stocks. Similar patterns have been uncovered in a number of different markets and time periods. Most patterns have already been known for more than twenty years. Hence, systematic risk factors are well-established and robust historical phenomena.
Over time, tilting investments towards systematic risk factors has delivered higher returns than a market value-weighted portfolio. A key issue is whether such excess returns can also be expected in the future.
The factors describe highly dissimilar phenomena. There is no unified economic model capable of explaining all the factors simultaneously. Instead, there are several different types of explanatory models.
Risk-based explanatory models are based on the premise that excess returns compensate for increased risk. This type of explanation appears to fit for several of the factors, including value and liquidity, but not for all of them. In particular, it has proven difficult to find good risk-based explanations for the factors momentum and low volatility.
Behavioural models are based on psychological studies of how humans make decisions and handle information. These show, inter alia, that people tend to misjudge probabilities, that they do not always interpret information rationally and that it takes time for them to change their opinions. These observations are often highlighted as explanations for factors like both value and momentum.
Models based on institutional considerations are based on the premise that asset managers do not act in perfect alignment with the interests of the capital owners. This may be due to skewed incentives in the investment mandate, and may result in asset managers adopting a more short-term perspective or assuming unnecessary risks. Such explanations appear to be of importance in explaining, inter alia, the low volatility factor.
There is, generally speaking, a low degree of consensus in the literature as to the causes of these factors and whether they will produce excess returns in the future. Risk factors remain a very active field among both researchers and practitioners.
The world’s capital markets are characterised by intense competition to achieve high returns. Consequently, there is little reason to expect that any excess return from risk factors can readily be exploited by an average investor. However, some investors may have special characteristics or qualities that make them better positioned to exploit various risk factors than others.
One example of a characteristic that may make investors well positioned to exploit systematic risk factors is a long time horizon for their investments. Strategies exploiting such factors may involve long periods of underperformance. Many professional asset managers would under such circumstances risk redemption and liquidation, and therefore choose to refrain from pursuing these strategies. However, long-term investors will be able to maintain their commitment to the strategy, and reap any potential excess returns over time.
In Chapter 6 in part II of this report the academic literature about systematic risk factors is presented in more detail.
2.2.2 Advice and recommendations
The work on systematic risk factors in the GPFG is a long-term effort. The Ministry has previously received advice and recommendations about risk factors from various sources.
Advice from external experts
In 2009, professors Ang, Goetzmann and Schaefer evaluated the active management of the GPFG. They found that active management had contributed significant positive excess returns until 2007, but that it delivered significant negative excess returns during the financial crisis in 2008, cf. the discussion in Report No. 10 (2009-2010) to the Storting, The Management of the Government Pension Fund in 2009. The professors noted that a major part of the excess returns delivered by active management, both before and during the financial crisis, could be explained by systematic risk factors.
Professors Ang, Goetzmann and Schaefer emphasised that they deemed it appropriate to tilt the investments in the Fund towards systematic factors, as the factors can be associated with risk premiums that a patient long-term investor may seek to reap over time. In their report, they argued that tilting investments towards systematic risk factors should be done deliberately, as part of the investment strategy of the Fund. The professors noted that if the Fund’s exposure to systematic risk factors had been communicated, and if the possibility of low returns as a result of these factors were known, the losses sustained by the Fund during the financial crisis in 2008 would not have been surprising.
In 2010, the Strategy Council for the GPFG prepared a report setting out recommendations on the further development of the investment strategy of the Fund. The Council argued that the investments in the Fund should be tilted towards the factors liquidity and value, cf. the discussion in Report No. 15 (2010-2011) to the Storting, The Management of the Government Pension Fund in 2010. The Council noted that tilting the investments in this way would be consistent with the long-term objectives of the Fund.
The Council observed that investment strategies focused on the value factor are patient and supply liquidity and stability to the market. Value stocks have typically experienced price declines and waning investor interest. This makes value strategies more appropriate for long-horizon investors.
The Strategy Council noted, in its report, that the need for liquidity in the Fund is very limited. It is unlikely that the State, as the owner of the Fund, will need to withdraw large amounts within a short space of time. This gives the Fund an inherent advantage in exploiting the fact that less liquid investments may entail higher expected returns. In 2011, the Ministry, in cooperation with the Strategy Council, held an international seminar on the investment strategy of the Fund. One of the topics was how the Fund might exploit such liquidity premiums. The conclusions from the seminar are outlined in Report No. 17 (2011-2012) to the Storting, The Management of the Government Pension Fund in 2011.
Advice from Norges Bank
Norges Bank has given advice about systematic risk factors several times in recent years.
In a letter of 23 December 2009 to the Ministry of Finance, the Bank argues that systematic risk factors must be considered in the context of the other aspects of the active management of the Bank. The Bank writes:
“Active management will expose the fund to systematic risk factors to a greater or lesser extent. The management and control of systematic risk must therefore be part of our management task. Some systematic risk factors may result in high short-term return variability. It is important that a strategy which aims to profit from systematic risk is properly communicated, understood and anchored in the management structure. In the long term, the exclusion of such opportunities will probably be a cost for the fund. Strategies of this kind can improve the trade-off between expected return and risk. Norges Bank must therefore take an active approach to systematic risk.”
Norges Bank notes, in a letter of 6 July 2010 to the Ministry of Finance, that discretion must be exercised in formulating strategies aimed at exploiting systematic risk factors. The Bank is of the view that such discretionary assessment must form part of the operational management. The Bank writes:
“There are no generally accepted definitions or ways of constructing risk factors. Nor is there any answer as to what the optimal composition of dynamic factors of this type might be. An approach where the owner attempts to define a benchmark portfolio which reflects all dimensions of risk to which the fund should be exposed would, to a great extent, need to be based on discretion. This discretion should be part of the operational management of the fund. The Ministry of Finance should avoid introducing systematic risk factors in the benchmark portfolios which undermine transparency and verifiability or which increase transaction volumes or are not investable in practice.”
Norges Bank has examined, in designated discussion notes, the impact of well-known risk factors in the stock market, as well as weighting principles that may serve as alternatives to market value weights1. The analyses show, inter alia, that there are several different ways of exploiting systematic risk factors, that it is difficult to isolate each individual risk factor in the asset management and that alternative weighting principles to market value weights often imply tilts towards systematic risk factors. The discussion notes are available on the Bank’s website (www.nbim.no/en).
Norges Bank recommends, in a letter of 2 February 2012 to the Ministry of Finance, that systematic risk factors be exploited in the management of the GPFG. The Bank writes:
“A global market-weighted benchmark index will not necessarily offer the best possible trade-off between risk and return for a fund such as the Government Pension Fund Global. The investment strategy should therefore be designed in such a way that the Fund can harvest risk premia dynamically, and the portfolio can be constructed in ways that build on its natural advantages.”
Regarding the Fund’s advantages, the Bank writes:
“The combination of a long time horizon, no short-term liquidity requirements and a patient owner means that the Fund may be particularly well-suited to taking on certain types of risk. This will, above all, be the case in periods of great uncertainty about future returns.”
The Bank is of the opinion that exploiting systematic risk factors can best be done as part of the operational management, rather than by changing the benchmark index of the Fund. The Bank writes:
“Norges Bank believes that the strategic benchmark index should not be adjusted to take account of systematic risk premia for equity investments.”
The Bank writes the following with regard to the benchmark index:
“The strategic benchmark index should be a long-term, objective yardstick for the operational management of the Fund and must be based on a leading, readily available market-weighted index.”
In 2012, Norges Bank introduced an operational reference portfolio for equities. This is a tool used by the Bank in its management of the Fund to better tailor the investments to the purpose and special characteristics of the Fund. The operational reference portfolio assists the Bank in changing the composition of the portfolio to take systematic risk factors into account. These adjustments seek to improve the ratio between expected return and risk.
In the annual report on the management of the GPFG in 2012, the Bank provided a more detailed account of the design and workings of the operational reference portfolio for equities. Norges Bank writes the following with regard to systematic risk factors:
“NBIM may also use alternative principles for weighting and portfolio construction to obtain exposure to various systematic risk factors.
The fund’s characteristics mean that we may take a different view of long-term investment opportunities from the typical investor. We also consider whether, and to what extent, the portfolios’ exposure to different risk factors should change over time. The desired exposure to systematic risk factors can be achieved in various ways, and expected return and risk characteristics may vary significantly depending on the method chosen. Adjusting the operational reference portfolios to harvest systematic risk premiums is an integral part of NBIM’s management mission.
NBIM has so far introduced exposure to two such risk factors in the operational reference portfolio for equities: the value effect and the small-firm effect.”
In the autumn of 2012, Norges Bank published two discussion notes on the foundations for the factors value and size.2 The notes are available on the Bank’s website (www.nbim.no).
2.2.3 Analyses of return and risk
A key issue is how return and risk may be affected if the composition of the GPFG’s equity portfolio is tilted towards the risk factors value, size, momentum, liquidity or volatility.
Extensive research has been conducted on the properties of systematic risk factors. However, academic studies will rarely take account of whether the findings from such studies can be implemented in practical asset management. The issue of investability is of decisive importance to large funds like the GPFG.
The index and analytics provider MSCI has been commissioned by the Ministry to calculate the implications of tilting large equity portfolios towards systematic risk factors. The assignment was to analyse simple rule-based factor strategies, with an emphasis on risk, return and investability. Simple rule-based strategies provide a good basis for analysing the effects of exploiting systematic risk factors in the management of the GPFG. The purpose of the analysis is to provide a basis for the Ministry’s assessment and further development of the Fund’s investment strategy. MSCI has not provided advice on whether or how one should exploit systematic risk factors in the management of the Fund. The work carried out by MSCI is summarised in a report available on the Ministry’s website (www.government.no/gpf).
MSCI’s report shows that the size of an equity portfolio restricts the extent to which its composition can be tilted away from market value weights towards systematic risk factors. When the composition of the portfolio is changed, both the ownership stakes in individual companies and the volume of rebalancing trades can become large, cf. box 2.2. MSCI demonstrates that many weighting principles that are popular amongst smaller investors cannot be practised for equity portfolios of the magnitude of that held by the GPFG. These include, inter alia, equal-weighted portfolios and portfolios weighted to minimize volatility.
Textbox 2.2 Investability
In practice, the size of an equity portfolio is of decisive importance in determining portfolio composition. A composition based on market values implies equal pro-rata ownership stakes in every company. Generally speaking, this entails a limited need for buying and selling stocks in the portfolio, and facilitates low management costs. The principle of market value weights, on which the equity benchmark index of the GPFG is premised, gives high investability. It is fairly straightforward to invest according to such a benchmark, even for a large fund like the GPFG.
Portfolio compositions that deviate from market value weights will have lower investability. If the GPFG’s equity portfolio is tilted towards systematic risk factors it would, inter alia, involve the following challenges:
Large ownership stakes in individual companies. Whilst market value weights imply equal pro-rata ownership stakes in each listed company, a tilt towards risk factors implies that ownership stakes will be larger in some companies and smaller in others. The size of the Fund means that the ownership stakes in individual companies may readily become very large.
Large trading volume upon rebalancing. Unlike market value weights, a bias in favour of risk factors implies that one will not have a fixed ownership stake in a company over time. When the strategies indicate that ownership stakes should be changed (rebalancing), one will purchase the stocks of some companies and sell others. The size of the Fund implies that the trading volume in many individual stocks may readily become very large.
It is fairly straightforward to invest in accordance with a market value weighted index, even for a large fund like the GPFG. Against this background, MSCI has calculated alternative indices that take market value weights as their point of origin, but then cautiously tilt their composition towards a systematic risk factor. The report calls this a factor index. A factor index will feature larger portions of stocks exhibiting the characteristics of the factor in question. A factor index for size will, for example, include larger portions of companies with low market capitalisations and smaller portions of companies with high market capitalisations, compared to a market value weighted index. This approach implies that one retains all stocks included in a market value weighted index, but somewhat modifies the weight of each stock. MSCI shows that this broad-based approach is preferable for large portfolios, since investability is increased considerably when compared to more purely factor-based alternatives. The factor indices have been calculated for large and medium-sized listed companies in the world’s developed markets for the period 1992–2012.
MSCI’s calculations indicate that it may be possible to tilt the composition of the equity portfolio of the GPFG towards systematic risk factors to a certain extent. As a technical assumption, MSCI has examined factor indices for portfolios of USD 100 billion. This is approximately NOK 600 billion, or currently about one fourth of today’s equity portfolio of the GPFG. The findings suggest that it should be possible, at that scale, to tilt the composition of the portfolio towards the factors value, size and low volatility. Concerning the factor momentum, the scale of a tilt would be considerably more limited.
Table 2.2 Key figures for factor indices over the period 1992–2012
Individual factor indices | Combined index | |||||
|---|---|---|---|---|---|---|
Marketweighted | Value | Size | Low volatility | Momentum | Value, size and low volatility | |
Gross annual return (percent) | 7.2 | 8.4 | 7.9 | 8.2 | 8.1 | 8.1 |
Annual standard deviation (percent) | 15.5 | 16.1 | 15.7 | 13.2 | 15.8 | 14.9 |
Return divided by standard deviation | 0.47 | 0.51 | 0.50 | 0.62 | 0.51 | 0.55 |
Sharpe ratio | 0.23 | 0.29 | 0.27 | 0.34 | 0.28 | 0.30 |
Annual tracking error (percent) | 3.2 | 2.6 | 3.4 | 3.6 | 2.2 | |
Information ratio | 0.32 | 0.25 | 0.27 | 0.22 | 0.41 | |
Highest number of consecutive years of negative excess return over the period | 3 | 6 | 2 | 2 | 3 | |
Average number of days to trade at rebalancing | 3.1 | 4.7 | 5.5 | 5.0 | 11.1 | 3.1 |
Average annual turnover (percent) | 4.3 | 18.6 | 12.4 | 12.5 | 41.0 | 12.0 |
Annual trading cost as a portion of total assets, assuming a cost of 0.5 percent for each trade (basis points) | 4.3 | 18.6 | 12.4 | 12.5 | 41.0 | 12.0 |
The table assumes a portfolio of USD 100 billion invested in large and medium-sized listed companies in the world’s developed stock markets. All indices are calculated in U.S. dollars.
Source MSCI.
The calculations show that the overall risk of the factor indices is largely in line with the risk of a market value weighted index, cf. table 2.2. Developments in the factor indices are dominated by general stock market fluctuations. There is, nonetheless, a considerable risk that factor indices will either over- or underperform a market value weighted index. These return differences vary considerably from year to year and from quarter to quarter. The factor indices have delivered positive excess returns in just over half of the periods, and negative excess returns in the remaining periods. In its report, MSCI emphasises that a tilt towards systematic risk factors may entail periods of consecutive negative excess returns lasting for several years. Small company stocks, for example, generally performed relatively poorly during the 1990s.
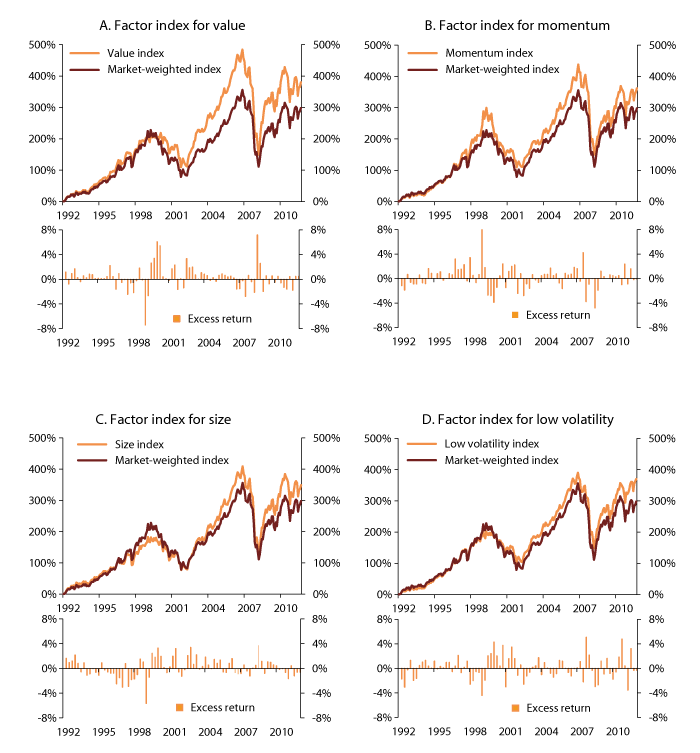
Figure 2.3 Accumulated total return and periodical excess return on factor indices over the period 1992–2012. Percent
Source MSCI and the Ministry of Finance.
The return contribution from risk factors depends on economic and financial developments, as well as on the characteristics of the factors, cf. figure 2.3. Important observations include:
A tilt towards the value factor implies increased holdings in companies with low valuations. Lower valuations may reflect that these companies are more vulnerable to recessions than other companies. During the financial crisis in the years 2008–2009, a tilt towards the value factor would have increased the losses incurred by an equity portfolio.
However, a tilt towards the value factor may also protect the investments against potential overpricing of individual equities or sectors, like during the so-called technology bubble at the turn of the millennium.
A tilt towards the low volatility factor implies increased holdings in companies with less volatile stock prices. The value of these companies tends to be less exposed to broad stock market fluctuations. Generally speaking, a tilt towards low volatility has therefore reduced the volatility of an equity portfolio.
One must be prepared for the possibility that a tilt towards low volatility may entail negative excess returns during periods of high returns in the general stock market. An example of this is the recoupment in the wake of the financial crisis from the autumn of 2008 onwards.
A tilt towards the momentum factor implies increased holdings in companies that have recently delivered high returns, and lower holdings in companies with low returns. Such a tilt may reinforce strong up- and downturns, such as was the case for example with technology stocks during the years 1999–2000.
A tilt towards momentum will be attractive when trends hold steady, but unattractive when trends are reversed. Historically, the return contribution from the momentum factor has often been more volatile in times of uncertainty, which often coincide with periods of major changes in the economy or the financial markets.
MSCI’s analysis demonstrates that there are benefits from combining tilts towards several systematic risk factors. The patterns generated by each factor are smoothed out, cf. figure 2.4 and table 2.2. Over the period analysed by MSCI, a combination of risk factors would have delivered a more stable contribution to the portfolio return. The periods of consecutive negative excess returns were fewer and shorter for the combination of several factors than for each individual factor taken in isolation. MSCI also notes that it becomes easier to invest when the composition of the portfolio is tilted towards several factors simultaneously.
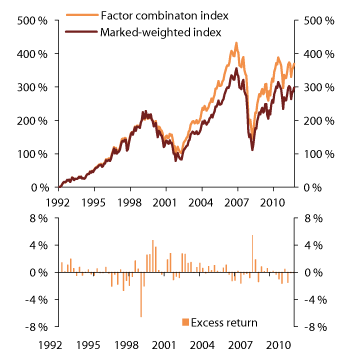
Figure 2.4 Accumulated total return and periodical excess return from a combination of factor indices for value, size and low volatility over the period 1992–2012. Percent
Source MSCI and the Ministry of Finance.
MSCI shows that the return contributions from the factor indices are, by and large, similar to the returns described in leading academic studies of systematic risk factors, cf. figure 2.5. However, the magnitude of this contribution is considerably smaller in the factor indices than in the academic studies. MSCI notes that for large portfolios, the investability requirement restricts the magnitude of potential excess returns that can be derived from systematic risk factors.
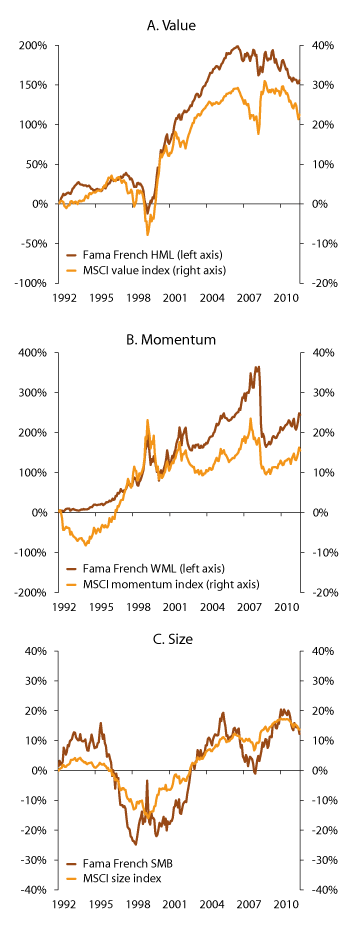
Figure 2.5 Accumulated excess return from a tilt towards systematic risk factors over the period 1992–2012. Percent
Source MSCI, Kenneth French’s website and the Ministry of Finance.
MSCI’s calculations show that the factor indices have delivered higher gross returns (returns before the deduction of costs) than a market value weighted index over the period 1992–2012 as a whole, cf. table 2.2. Since the risk level of the factor indices is largely in line with that of a market value weighted index, the calculations indicate that a tilt towards systematic risk factors would have offered a more attractive ratio between return and risk over that period. MSCI emphasises that all calculations in the report are based on historical data and, consequently, are not necessarily good indicators of future expected returns from systematic risk factors. MSCI also emphasises that the calculations do not take into account what it would actually cost to implement the investments in line with the computed indices. Besides, there is a major difference between the first and second halves of the period they study. For the factors value, momentum and low volatility, most of the excess return was generated in the first half, whilst it was the opposite for stocks in smaller firms.
The report from MSCI attaches special emphasis on investability. Investability is closely related to management costs. A tilt towards systematic risk factors implies more trades in the portfolio (increased turnover), compared to a market value weighted portfolio, cf. table 2.2. Stock trades entail various transaction costs, such as commissions charged by brokers or electronic market places. For a large fund, however, a tilt towards systematic risk factors means that the volume of trades in individual stocks may readily become very large, cf. box 2.2. Consequently, one may incur costs, in addition to ordinary transaction costs, as the trades influence the price at which one is able to purchase or sell the stock, i.e. so-called market impact. MSCI emphasises that its report does not provide a basis for determining the potential amount of such costs, although these may be considerable for large portfolios. MSCI notes that few funds have adjusted the composition of their equity portfolios on the scale examined in the report.
MSCI’s report provides no dedicated analysis of trading costs. MSCI has assumed, for technical calculation purposes, that costs were 0.5 percent (50 basis points) per trade. Based on this estimate, MSCI concludes that overall trading costs would increase considerably for certain factor indices, cf. table 2.2. Nonetheless, the estimated cost increase is less than the aggregate gross excess return on the factor indices over the period examined by MSCI.
The factor indices computed by MSCI are simple and rule-based. They have not been developed with a view to providing the maximum possible investability. In its report, MSCI notes the scope for further improving investability. One may, for example, restrict large ownership stakes in individual companies and reduce or smooth out the volume of rebalancing trades. MSCI observes that such adjustments may be of major importance to large portfolios, although these adjustments would need to be tailored. MSCI emphasises that it will be a challenging task to identify the most suitable adaptations. Which adaptations are the most suitable may also change over time.
MSCI’s work does not focus on the liquidity factor, but the Ministry of Finance has requested professors de Jong and Driessen to prepare a report on the consequences of tilting investments towards the liquidity factor, both in listed markets for equities and bonds and in unlisted markets, cf. box 2.3. The considerations in the report are based on a survey of relevant academic research. Distinction is made between premiums for investing in less tradable assets (liquidity premiums) and risk premiums for assets that become less tradable during periods of market turbulence or when overall liquidity declines. The report concludes, as far as the market for listed equities is concerned, that there is limited evidence to support the existence of any significant liquidity premiums. On the other hand, professors de Jong and Driessen are of the view that there is a certain potential for the Fund to exploit liquidity premiums in the bond market, and that there may be a somewhat greater potential for exploiting risk premiums for liquidity more generally.
Textbox 2.3 Liquidity
A security or asset is deemed to be liquid or easily tradable if the purchase and sale of large orders can be executed swiftly at a low transaction cost without appreciable changes to the price as the result of the transactions. How prices are affected by changes in liquidity may be a characteristic of an asset class or a market.
Differences in how easy it is to purchase or sell an asset reflect how easy it is to find a counterpart to trade with. It is reasonable to expect that one gets paid for offering liquidity because it makes it possible for others to execute a desired transaction. Such payment will here be referred to as a liquidity premium.
A strategy premised on offering liquidity will involve risk. Historical data show that the liquidity of risky assets is correlated over time. Consequently, differences in liquidity may give rise to a risk premium in addition to a liquidity premium. A liquidity premium reflects differences in expected returns as the result of differences in tradability between individual assets. A risk premium for liquidity reflects differences in expected returns as the result of assets reacting differently to changes in the overall liquidity in the market.
In academic research, distinction is made between four strategies for profiting from liquidity premiums and liquidity risk premiums. The strategies require investors to adopt a long time horizon and to not be forced to sell securities when market prices decline:
Strategies that vary with market levels, i.e. to purchase assets that have a high liquidity premium or liquidity risk premium when the market slumps.
Invest passively in an asset class characterised by low liquidity, for example unlisted real estate.
Selecting securities with low liquidity within an asset class, for example the least liquid companies traded on a stock exchange.
Operate as a so-called market maker, for example by offering liquidity for large holdings of stocks or bonds.
The Ministry has commissioned a report from Professors Frank de Jong and Joost Driessen of Tilburg University in the Netherlands, for the purpose of examining the prospects for the GPFG to harvest liquidity premiums. Professors de Jong and Driessen base their advice on available research literature. The most important conclusions of the report are as follows:
There is limited scope for profiting from liquidity premiums in the markets for listed equities. The scope for reaping liquidity risk premiums is somewhat higher, but the magnitude of the premium varies quite considerably between various studies.
Prospects for reaping liquidity premiums in the market for corporate bonds seem better. However, liquidity premiums are highest in those segments of the market that involve the highest credit risk and the least liquidity. Transaction costs are high in both of these segments. Hence, it may be challenging for a large fund like the GPFG to implement active strategies for reaping liquidity premiums. A passive strategy based on overweighting market segments with high credit risk and low liquidity in the fixed income portfolios of the GPFG may be considered. The market for corporate bonds appears not to offer any significant liquidity risk premiums.
It also seems possible to reap liquidity premiums in the markets for bonds with a government guarantee, as well as for inflation-linked bonds. The size of the GPFG will represent less of a challenge in these markets.
There exist no reliable data that can form the basis for recommendations for unlisted markets.
Nor is there any research literature that can form the basis for recommendations with regard to the profitability of, and the risks associated with, time-dependent liquidity strategies.
The report from professors de Jong and Driessen will form part of the basis for the Ministry’s ongoing effort to assess the importance of liquidity for the investments of the GPFG.
The report is available on the Ministry’s website (www.government.no/gpf).
2.2.4 The Ministry’s assessment
The Ministry has, based on previous advice and recommendations assessed the prospects for tilting the composition of the Fund’s equity investments towards various systematic risk factors like value, size, momentum, liquidity and low volatility. In particular, the Ministry has assessed whether the equity benchmark index of the Fund should be adjusted for such factors. The assessments are based, inter alia, on analyses of how tilts towards such factors might affect expected return and risk, and which restrictions and challenges result from the large size of the Fund.
The analyses carried out by MSCI suggest that it may be possible to tilt the composition of the equity portfolio of the GPFG towards systematic risk factors to a certain extent. Investment strategies focused on exploiting systematic risk factors may therefore become important in the Fund. The analyses show, at the same time, that very large portfolios face a number of restrictions. The Fund’s equity portfolio is already about four times the size of the portfolios used in MSCI’s calculations, and it is expected to increase further in coming years. Investability will be a constraint to exploiting such strategies in the equity portfolio. Any strategies should therefore be designed with special regard to investability.
The constraints implied by the size of the Fund imply that the overall risk in the equity portfolio will under any circumstance be dominated by the fluctuations in the general stock market, as it is today. If the equity portfolio of the GPFG is tilted towards one or more systematic risk factors, the overall risk in the Fund will not be changed materially.
At the same time, a tilt towards systematic risk factors implies a considerable risk of either over- or underperformance relative to a market value weighted index. These return differences vary considerably from year to year and from quarter to quarter. One needs to be prepared for the possibility that a tilt towards systematic risk factors may result in consecutive negative excess returns over periods of several years. One also needs to be prepared for the possibility that a tilt may increase the losses incurred in the equity portfolio of the Fund during periods of major stock market slumps, as was the case during the financial crisis in 2008.
The Ministry is of the view that the GPFG seems well positioned to take on the additional volatility that might be implied by tilts towards systematic risk factors. This is because the Fund is invested with a very long time horizon, and because the State, the owner of the Fund, has limited liquidity needs and a high ability to absorb risk.
Analyses of historical data indicate that tilting the equity investments towards systematic risk factors would have delivered higher returns without any material change in risk, compared to a market value weighted portfolio. Historical excess return does not in itself justify expectations of future excess returns. The results should be underpinned by theoretical models. The Ministry notes that there is no broad agreement as to the causes of the factors and why they should produce expected excess return. This makes assessments of future returns uncertain.
The analyses of risk factors value, size, momentum, liquidity and low volatility are based on historical data. It is not certain that the same factors will explain future patterns in stock returns. Expectations about these risk factors cannot be compared to expectations about the risk premium for variations in the overall stock market, which is comprehensively supported by theoretical models and verified by more than a hundred years of data.
The size of the Fund entails some important challenges if one chooses to tilt the portfolio towards risk factors. One such challenge is that both ownership stakes in individual companies and trading volumes in individual stocks may readily become large. In addition to ordinary transaction costs, one may thus incur costs as the trades influence the price at which one is able to purchase or sell. The Ministry notes that the implementation costs are uncertain, and that one is not aware of other major funds internationally having adjusted the composition of their equity portfolios on a scale similar to the size of the GPFG. In the Ministry’s view, this favours a gradual approach.
The Ministry agrees with the assessment of Norges Bank that tilts towards systematic risk factors in the equity portfolio is best achieved as part of the operational management, rather than through a change in the Fund’s benchmark index. The development of strategies for exploiting systematic risk factors must be based on discretionary assessment. Moreover, the size of the Fund makes it highly necessary to tailor the strategies with regard to investability. Identifying the most suitable adaptations will be a challenging task, and which adaptations are the most suitable may change over time. The work of the Ministry of Finance on the strategic benchmark of the GPFG is therefore not a process suited to making these decisions. Changes to the benchmark index are the outcome of a lengthy decision-making process. This provides a solid basis for overarching decisions with the most impact on the overall risk in the Fund. This process is not, however, suitable for decisions that to a large extent involve adjustments based on discretionary assessments, and that require continuous maintenance and modification.
To the extent that systematic risk factors are to be exploited, it should therefore be done within the scope of Norges Bank’s management framework. The Bank may design factor strategies based on the characteristics and advantages of the Fund, including the size and long time horizon. The design of such strategies forms an important part of the management mission of the Bank.
The Ministry notes that Norges Bank has embarked on the development and assessment of factor strategies. This work is in an early phase. Norges Bank has chosen to introduce an operational reference portfolio for equities that implies, inter alia, a certain degree of tilt towards the risk factors value and size. The purpose of the adjustments is to achieve an improved ratio between expected return and risk.
The Ministry is of the view that strategies for exploiting systematic risk factors must be long term and designed such that they can still be followed in periods during which expected returns fail to materialise. This makes it necessary to identify, manage and communicate the risks associated with the strategies in a good manner.
The work on systematic risk factors in the GPFG is long-term. Strategies for exploiting such factors will have to be developed gradually over many years. It is appropriate to revisit this work in the context of the planned evaluation of Norges Bank’s management of the GPFG in 2014.
2.3 The fixed income benchmark index
2.3.1 Introduction
In Report No. 17 (2011-2012) to the Storting, the Ministry presented a new fixed income benchmark index. The new benchmark index consists of a government fixed income portion (70 percent) and a corporate fixed income portion (30 percent), thus highlighting the roles of the various parts of the fixed income portfolio. The role of the government fixed income portion is, in particular, to reduce the total risk of the Fund. The benchmark comprises nominal government bonds issued in 21 currencies, including emerging markets, inflation-linked government bonds that are only issued in developed markets, as well as bonds issued by international organisations like the European Investment Bank and the World Bank. The weight accorded to each country in the government fixed income benchmark index is determined by the size of its economy, as measured by GDP.
The corporate fixed income portion of the benchmark index is expected to contribute more to the return on the Fund due to, inter alia, an expected compensation for credit risk associated with investments in such bonds; so-called credit premium. It comprises both corporate bonds and covered bonds. Covered bonds are issued by banks and secured by an underlying portfolio of bank loans. The corporate fixed income portion weights each bond by its share of the market value of all bonds in this benchmark component. Seven currencies are approved for benchmark component.
The new fixed income benchmark is simpler than the previous, as a result of the removal of several sub-segments. Following advice from Norges Bank, the Ministry has examined whether the fixed income benchmark should be further simplified by removing the sub-segment of inflation-linked government bonds.
Unlike nominal bonds, inflation-linked bonds offer protection against unexpected changes in inflation. Investors earn a real return, and a compensation for developments in a price index agreed in advance
Inflation-linked government bonds have formed part of the fixed income benchmark index since 2005. The Ministry’s decision to include inflation-linked bonds was made in 2004 and was in line with advice provided by Norges Bank in letters of 21 March 2002 and 6 September 2004, cf. the discussion in the National Budget for 2005. At that time, the Ministry attached weight to the analyses carried out by Norges Bank, which showed that the ratio between expected return and risk in the Fund would improve, under reasonable assumptions, although this effect would be modest. The Ministry also attached weight to the anticipated growth in the issuance of inflation-linked bonds.
2.3.2 Advice from Norges Bank
In a letter of 9 August 2012, Norges Bank proposed that inflation-linked bonds be removed from the benchmark index of the GPFG. The reason given for this by the Bank is that inflation-linked and nominal bonds have different, and in some cases conflicting, characteristics during periods of variations in real interest rates and inflation risk. The Bank also writes that the market for inflation-linked bonds is not sufficiently broad, deep and uniform to provide diversification of the risk associated with the GPFG in the event of a swift and unexpected increase in inflation. The Bank is therefore of the view that no specific strategic allocation for such bonds should be established.
The Bank believes that such a change will clarify the strategic role played by government bonds in the benchmark and make the benchmark simpler, more transparent and more readily verifiable.
The Bank also notes that inflation-linked bonds may exhibit different characteristics across countries. Important differences between countries include, inter alia, the tax treatment of the inflation compensation and the degree to which the nominal value of the bonds, or their principal, is subjected to downward adjustment in the event of deflation. Norges Bank has published its own discussion note on the market for inflation-linked bonds.3 It follows, inter alia, from the note that the United Kingdom and Japan do not guarantee repayment of the original principal upon maturity if the price index were to decline over the loan term. Such guarantee is called a “deflation floor”.
The return on nominal bonds is more vulnerable to an increase in inflation than is the return on inflation-linked bonds. The Bank is of the view that the inflation risk associated with nominal bonds is a type of risk that the Fund is particularly well placed to take on. The combination of a long time horizon, limited ongoing liquidity needs and a patient owner are characteristics that may, generally speaking, make the Fund well placed to assume various forms of systematic risk, including inflation risk.
During periods of financial turbulence, the market for inflation-linked government bonds is less liquid than the market for nominal government bonds. However, it is not necessarily the case, according to the Bank, that one can expect to systematically harvest a liquidity premium through a strategic allocation to inflation-linked bonds.
The Bank writes that the overall composition of the investments should enable the Fund to take part in the real growth of the world economy. The Bank is of the view that inflation-linked bonds will provide a safeguard against inflation, but not necessarily a return that reflects the real growth of the economy.
Norges Bank has developed an operational reference portfolio for bonds. This portfolio is a tool for managing and communicating long-term adaptations made by the Bank in its active management, cf. the discussion in sections 2.2 and 4.1. In 2012, the Bank chose to remove inflation-linked bonds from the operational reference portfolio. The Fund’s holdings of such bonds declined from NOK 105 billion to NOK 42 billion during the course of the year.
2.3.3 The market for inflation-linked bonds since 2004
In 2004, inflation-linked government bonds accounted for 3.8 percent of the fixed income benchmark index, cf. the National Budget for 2005. At present, inflation-linked bonds account for about 6 percent of the new fixed income benchmark index. In general terms, the portion of inflation-linked bonds in the market for government bonds has increased from about 6.5 percent in 2004 to 9.5 percent in 20124.
In 2004, inflation-linked government bonds were issued in 14 countries, cf. letter of 6 September 2004 from Norges Bank. At present, inflation-linked bond indices include up to 20 countries.5 The Barclays World Government Inflation Linked Bond Index (WGILB) comprises nine developed countries and has an aggregate market capitalisation of about USD 2,000 billion. The market for inflation-linked government bonds remains focused on a small number of countries. The main issuers of such bonds are the United States, the United Kingdom and France, with market shares of 43 percent, 28 percent and 11 percent, respectively.
Developments in the interest rate level and sensitivity to interest rate changes
Figure 2.6 shows that both U.S. nominal interest rates and real interest rates declined over the period 2003–2012. The difference between nominal interest rates and real interest rates is made up of expected inflation and various risk premiums. It follows from the figure that the difference between nominal interest rates and real interest rates has remained fairly stable over the last nine years, with the exception of a brief period during the financial crisis in 2008–2009. The figure also shows that interest rates are currently very low.
Figure 2.6 Yield on U.S. nominal and inflation-linked government bonds with a five-year maturity. 2003-2012. Percent
Source U.S. Department of the Treasury.
The market value of bonds declines when the interest rate level increases, and vice versa. Long-term bonds are more sensitive to changes in the interest rate level. Duration is, in simplified terms, a measure of how much a bond declines in value when the interest rate level increases by one percentage point. A duration of 6 means that the value of the fixed income portfolio will decline by about 6 percent if the interest rate increases by one percentage point. The Ministry has not adopted any target for the duration of the fixed income benchmark index. The effect of changes in market interest rates on the value of the benchmark follows from the characteristics of the fixed income instruments included in the benchmark at any given time. For nominal bonds, duration shows how much the bonds decline in value when nominal interest rates increase. For inflation-linked bonds, duration shows how much the bonds decline in value when real interest rates increase. Table 2.3 shows the duration of the various components of the fixed income benchmark index as per 30 June 2012. Inflation-linked bonds have a longer time to maturity (duration) than nominal bonds. Changes in the general interest rate level may be caused by changes in both real interest rates and inflation expectations. Compared to nominal bonds, the return on inflation-linked bonds will be more exposed to changes in real interest rates and less exposed to changes in inflation expectations.
Table 2.3 Interest rate sensitivity (duration) of the various components of the fixed income benchmark index as per 30 June 2012
Sub-segment | Duration | Portion of the benchmark (percent) |
|---|---|---|
A. Sensitivity to changes in nominal interest rates | ||
Corporate bonds | 5.5 | 30.0 |
Bonds issued by international organisations | 5.1 | 2.9 |
Nominal government bonds | 6.5 | 60.5 |
B. Sensitivity to changes in real interest rates | ||
Inflation-linked government bonds | 10.9 | 6.6 |
Source Barclays
Return
In return analyses, the Ministry has examined inflation-linked bonds issued by the U.S. government, so-called TIPS (Treasury Inflation Protected Securities). These account for more than 40 percent of the market for inflation-linked bonds. TIPS were first issued in 1997. Over the period from January 1997 to December 2012, these have delivered a higher return than U.S. nominal government bonds, U.S. corporate bonds with high credit ratings, so-called “investment grade” bonds, and the U.S. stock market (S&P 500), cf. figure 2.7. Since the decision was made in 2004 to include inflation-linked bonds in the benchmark index of the GPFG, TIPS have also delivered the highest return of these four assets.
Figure 2.7 Returns on U.S. inflation-linked and nominal government bonds, investment grade corporate bonds and equities (S&P 500). Index 1 January 1997 = 100
Source Thomson Reuters Datastream and the Ministry of Finance.
The high return on U.S. inflation-linked bonds is primarily caused by their long maturities and the fact that the period in question has been characterised by declining real interest rates.
Risk and correlation with the stock market
The annual standard deviation of returns is a common measure of risk. It is a statistical measure of return fluctuations and is also referred to as volatility.
Since 1997, risk as measured in this way has been higher for U.S. inflation-linked government bonds than for U.S. nominal government bonds. The annual standard deviation has been 5.8 percent, as compared to 4.6 percent. The standard deviation has also been somewhat higher than for U.S. investment grade corporate bonds, with the latter being measured at 5.6 percent.
The return on U.S. inflation-linked bonds has exhibited low correlation with the U.S. stock market, but not as low as the return on nominal government bonds, cf. figure 2.8. Nonetheless, the correlation with the stock market has been considerably lower than for U.S. corporate bonds. The correlation increased during the financial crisis in 2008, but has now reverted to negative territory. Over the period since 1997, the correlation between the U.S. stock market and U.S. inflation-linked government bonds, nominal government bonds and corporate bonds has been 0.02, -0.27 and 0.23, respectively.
Figure 2.8 36-month rolling correlation with the U.S. stock market (S&P500) for U.S. inflation-linked and nominal government bonds and investment grade corporate bonds
Source Thomson Reuters Datastream and the Ministry of Finance.
The inflation-linked bonds’ low correlation with the stock market and high return have improved the ratio between return and risk in the GPFG. However, the effect has been small since inflation-linked bonds constitute a minor part of the benchmark index.
2.3.4 Preservation of purchasing power
Inflation-linked bonds are often considered to be the closest one gets to risk-free investments, under certain assumptions. When an inflation-linked bond is purchased and held until maturity, the real rate of return for the entire period as a whole is known to a great extent at the time of purchase. Although the price of the bond may vary over the period, the long-term real rate of return will be virtually risk-free.
The issue of the Fund’s need for safeguarding long-term purchasing power or obtaining inflation protection is of relevance to the assessment as to whether inflation-linked bonds should be included in the benchmark. However, other types of investment may also offer elements of inflation protection.
In its discussion note “Risks and Rewards of Inflation-Linked Bonds”, Norges Bank writes the following:
“In future work, we therefore intend to broaden this research project on ILB into a wider study of long-term inflation and real assets”.
A more comprehensive analysis of the need for inflation protection and real asset investments may thus be carried out.
2.3.5 The Ministry’s assessment
Inflation-linked government bonds and nominal government bonds differ somewhat in their characteristics. The Ministry is of the view that both types of bonds may reduce the risk associated with the Fund over time. Differing characteristics may mean a low correlation of returns, which creates opportunities for risk diversification and an improved ratio between expected return and risk.
Besides, inflation-linked bonds are often considered to be as close as one can get to risk-free investments, provided that the bonds are held until maturity, involve no credit risk and are linked to a price index of importance to the investor’s purchasing power. Inflation-linked bonds therefore fit well into the government fixed income benchmark index, which is intended to reduce the risk associated with the overall portfolio.
In order to invest in nominal bonds, investors will normally require some compensation for the uncertainty associated with future inflation, so-called inflation premium. This is not the case for inflation-linked bonds. Everything else being equal, the expected return on inflation-linked bonds will therefore be somewhat lower than for nominal bonds. It is not obvious that a long-term investor like the GPFG should invest in inflation-linked bonds. In its advice, Norges Bank writes that the inflation risk associated with nominal bonds may be a type of risk that the Fund is particularly well placed to bear.
The Ministry is of the opinion that the ability of the Fund to take on inflation risk should be examined in more detail before a conclusion can be drawn in this regard. The market for inflation-linked bonds is, at the same time, less liquid than the market for nominal government bonds. This characteristic became especially clear during the financial crisis in 2008–2009. The economic literature reviewed by the Ministry indicates that inflation-linked bonds have historically offered a liquidity premium of about the same magnitude as the inflation premium offered by nominal government bonds. The estimates for these premiums are uncertain, since both vary over time and are difficult to calculate. See box 2.3 for a more detailed discussion of liquidity risk.
Nonetheless, the scope for earning a liquidity premium in the market for inflation-linked bonds means that the special characteristics of the Fund as a long-term investor is not a decisive argument for removing inflation-linked bonds from the benchmark.
Moreover, the Ministry has attached weight to the fact that most large countries adhere to the same type of contract structure for inflation-linked bonds. Consequently, differences between the markets for such bonds would not appear to be a major problem in practice.
All in all, the Ministry has not identified arguments that are sufficiently weighty to remove inflation-linked bonds from the benchmark. In making this assessment, more weight has been attached to risk diversification considerations than to the need for further simplifying the fixed income benchmark index. However, one may want to revisit the question of inflation-linked bonds in the presence of a more comprehensive analysis of the need for inflation protection and real asset investments.
The Ministry has considered whether inflation-linked bonds should be separated from the government fixed income portion and instead be assigned a separate strategic allocation. However, such a solution would violate the rule adopted by the Ministry last year, to the effect that the weights of the government bonds of various countries should be equal to the relative GDP weights of the countries. The Ministry has therefore concluded that inflation-linked bonds should remain a component of the government fixed income benchmark index, alongside nominal government bonds and bonds issued by international organisations.
2.4 Listed real estate equities in the real estate portfolio
2.4.1 Introduction
On 1 March 2010, the Ministry of Finance laid down guidelines for real estate investments, cf. Report No. 10 (2009-2010) to the Storting – The Management of the Government Pension Fund in 2009. According to the mandate for the GPFG, Norges Bank shall invest up to 5 percent of the Fund in a separate real estate portfolio. The portion invested in bonds shall be reduced correspondingly.
The Ministry has, as described in Report No. 10 (2009-2010) to the Storting, operated on the assumption that it will take several years to build up the real estate portfolio. At the outset, the portfolio has been focused on a small number of selected real estate markets. The mandate for the GPFG includes a provision to the effect that Norges Bank shall seek to build the real estate portfolio over several years and across relevant risk factors. Moreover, the establishment of the real estate portfolio shall be based on the Bank’s long-term expectations with regard to net returns and risks in the real estate market and potential investments made by the investment portfolio in other markets. The development of the management organisation at Norges Bank will also be of importance to the establishment of the real estate portfolio.
At the end of 2012, the real estate portfolio comprised unlisted investments in office and retail properties in England, France and Switzerland, valued at NOK 22 billion. This represents 0.7 percent of the value of the Fund. Besides, Norges Bank has signed agreements for purchases of additional real estate, which are expected to be completed in 2013.
The mandate for the GPFG has since 2010 allowed for Norges Bank to invest in the real estate portfolio in several ways, including in equities of listed real estate companies. Section 3-1 c) of the mandate is worded as follows:
“The real estate portfolio may be invested in real estate, equity and interest-bearing instruments issued by listed or non-listed companies, fund structures and other legal entities whose primary business is the acquisition, development and management or financing of real estate. The investments may be made through Norwegian or other legal entities. Investments in unlisted equity instruments shall be carried out on regulated and recognised markets. Real estate means rights to land and buildings that are found upon it.”
The mandate laid down by the Ministry of Finance implies that Norges Bank may hold real estate equities in both the equity portfolio and the real estate portfolio. It follows from the mandate that Norges Bank shall specify, in its internal guidelines, limits as to the portion of the real estate portfolio that may be invested in listed equity instruments. Norges Bank has specified 25 percent of the strategic real estate allocation of up to 5 percent as an upper limit for such investments, cf. chapter 5.
The return and risk characteristics of listed and unlisted real estate may differ. Norges Bank is in the process of expanding the real estate investments to countries and regions with large markets for listed real estate companies. This makes it more likely that such investments will be included in the real estate portfolio in the near future. Section 2.4.2 therefore describes differences between equity capital investments in unlisted real estate and listed real estate companies.
2.4.2 Listed real estate equities compared to unlisted real estate
The index provider IPD has estimated that the value of real estate managed by professional real estate managers was about NOK 31,000 billion in 2011. Professional real estate managers include, inter alia, sovereign investment funds, life assurance companies, pension funds, real estate funds and listed and unlisted real estate companies. However, the aggregate value of all real estate is much higher. Small investors and companies that are primarily engaged in other activities than real estate management do, for example, also own real estate. Just under ¼ of the estimated value of NOK 31,000 billion for 2011 was held by listed real estate companies. This shows that a major part of the real estate market is only accessible through unlisted investments.
Furthermore, the data from IPD show that the portion of the real estate market held by listed real estate companies is highest in North America and Asia, and lowest in Europe. Real Estate Investment Trusts (REITs) constitute the largest group of listed real estate companies. REITs are companies that invest in, and manage, real estate or real estate mortgages. What distinguishes REITs from other limited liability companies is that they do not pay corporate tax on income that is distributed to their shareholders, as long as they comply with certain requirements. The requirements that their revenues shall originate from real estate, that the investments shall be made in developed real estate and that their profits shall be distributed, mean that REITs are more readily comparable to direct real estate investments. A separate topic article in chapter 7 of this report provides a more detailed discussion of listed REITs.
Although the revenues of listed REITs have their origin in real estate investments, historical return and risk data show that there is a low degree of correlation between the index return on listed REITs and that of unlisted real estate in the short run. Generally speaking, the return on listed REITs fluctuates more than the return on unlisted real estate, and more in line with the stock market.
A possible explanation for the weak short-term correlation is that good data for the market return on unlisted real estate are not available. Studies seeking to adjust for various weaknesses in the unlisted real estate indices find more of a correlation between these two parts of the real estate market.
A weakness of unlisted real estate investment indices is that the real estate included in an index has a low turnover. The low turnover in the unlisted real estate market means that broad indices are typically based on developments in real estate appraisals. In contrast, equity indices are based on market prices. Historical data show that index values based on real estate appraisals are less volatile and lag the return of listed real estate companies. Some unlisted real estate indices are instead based on actual transactions. Low and variable turnover mean that such indices do not reflect overall market returns either. Transaction-based indices may nonetheless provide a more accurate impression of fluctuations in the real estate market than indices based on real estate appraisals.
Figure 2.9 shows developments in the value of an index comprising listed REITs and two indices comprising unlisted real estate in the U.S. market. One of these is based on real estate appraisals (NCREIF Property Index, NPI) whilst the other one is based on actual transactions (NCREIF Transaction Based Index, NTBI). In order to make the indices more comparable, the return on REITs is adjusted for leverage and differences in sectoral composition. The figure shows that the index value based on real estate appraisals (NPI) reacts more slowly and is less volatile than the two other indices. The REIT index appears to lead the two other indices. This is in conformity with a number of other studies of historical returns.
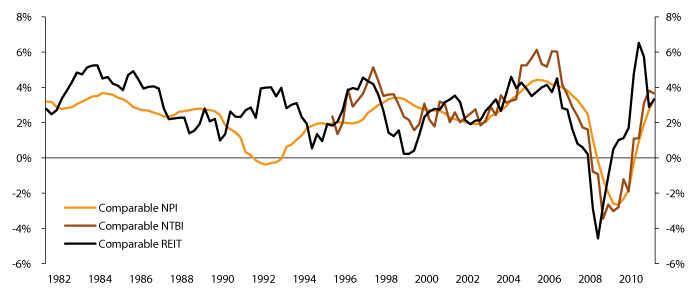
Figure 2.9 Two-year average quarterly returns on comparable indices of listed and unlisted real estate in the United States. 1st quarter 1982 – 4th quarter 2011
Source Ang, A., Nabar, N., and Wald, S. (2012), Searching for a Common Factor in Public and Private Real Estate Returns, Working paper.
Figure 2.9 shows that real estate returns have rarely been negative over periods of two years. The return of the indices represents real estate investments without leverage. This leads to lower volatility. However, all the real estate indices underwent major contractions in 2008–2009, during the financial crisis.
Most real estate investments are leveraged. Hence, problems in the credit markets may affect real estate returns. During the financial crisis, listed REITs exhibited a high correlation with the stock market in general and the banking sector in particular. The topic article in chapter 7 examines the correlation between listed REITs and the stock market in more detail.
In the long run, it would be reasonable to expect developments in the value of listed REITs to reflect developments in the underlying real estate markets. The average quarterly return on the REIT index in the United States over the period 1994–2011 was 2.4 percent, whilst the corresponding return on the unlisted real estate index based on appraisals (NPI) was 2.3 percent. Consequently, returns have not differed significantly between the two indices over this period overall.
Compared to unlisted real estate, listed REITs are characterised by high liquidity and represent a cost- and tax-effective investment form for many investors. Low transaction costs make it easier to diversify the investments across many properties, when compared to unlisted investments. However, a negative characteristic from the perspective of investors may be that listed REITs offer less transparency and control over real estate management. This may make it more attractive to invest in unlisted real estate through forms of investment that permit higher ownership stakes and provide better opportunities for following up on, and influencing, real estate management, including the selection of the properties in which investments are to be made. Stable performance may also be of value to many investors. If such is the case, they will prefer unlisted investments because the volatility of appraisals is less than that of listed REITs in the short run. It is also possible that investors are compensated for the low liquidity in the unlisted real estate market or that individual investors or investor groups may achieve special advantages in the management of unlisted investments, such as economies of scale.
The Ministry has commissioned a report examining the potential of the GPFG for reaping liquidity premiums through investments in various asset classes, cf. box 2.3 of section 2.2. However, the report notes that the available data are not robust enough to permit conclusions as to whether liquidity premiums exist in unlisted markets, such as real estate.
2.4.3 The Ministry’s assessment
The mandate for the GPFG allows for the real estate portfolio to be, inter alia, invested in stocks of listed real estate companies in addition to unlisted real estate. This is supported by the discussion of the characteristics of listed real estate equities in section 2.4.2. Analyses of historical data suggest that there are no material differences in the return and risk characteristics of broad indices of listed real estate companies and unlisted real estate in the long run. In addition, listed real estate companies hold major parts of the real estate markets of many sub-markets and countries. Consequently, the unlisted and listed markets complement each other, and together make up the overall real estate market.
At the same time, investments in listed real estate companies differ from investments in unlisted real estate. For example, listed investments are, generally speaking, more liquid than unlisted ones. Another difference is that it is common for unlisted investments to involve higher ownership stakes. This offers investors more transparency and control over management. On the other hand, large ownership stakes in individual properties make it more challenging to diversify the investments. Besides, investors may have different prospects for developing advantages in listed and unlisted markets. Whether it is most attractive to invest in unlisted real estate or listed real estate companies may also vary between markets and over time. The Ministry is therefore of the view that it should be up to the asset manager to choose between listed and unlisted real estate in the real estate portfolio.
On average, listed real estate companies are more leveraged than the investments Norges Bank has made in unlisted real estate so far. Higher leverage means higher expected equity return. However, the returns will be more volatile. In the short run, the method of valuation will also mean that the return on investments in listed real estate companies fluctuates more than the return on investments in unlisted real estate. Unlisted real estate is primarily valued by way of appraisals, whilst listed real estate companies are priced in the stock market. Appraisals are updated less frequently and have historically varied less than market prices.
Increased leverage in the real estate portfolio as the result of listed investments will increase the overall risk associated with the Fund. However, as noted in Report No. 16 (2007–2008) to the Storting, the expected effect of a 5-percent allocation to real estate on the Fund’s risk over periods of 15 years will in any case be modest. This also holds true with a certain level of leverage in the real estate portfolio.
The Ministry has chosen a tailored version of a global real estate index from the index provider International Property Databank (IPD) as the return target for the real estate portfolio of the GPFG. The index is adjusted for the actual leverage in the real estate portfolio in respect of both unlisted and listed investments. IPD prepares an annual report for the Ministry on the real estate management of the GPFG, including the return on the portfolio. The report for 2011 is discussed in section 4.1 and is published on the Ministry’s websites (www.government.no/gpf).
Report No. 10 (2009–2010) to the Storting noted that the Ministry had assumed, in selecting the return target, that the scale of the real estate portfolio investments in listed real estate companies would be limited over time. It was further noted that if such assumption was to be modified, the Ministry would consider using an index of listed real estate companies as the return target for the listed part of the portfolio. This continues to be the case. A significant expansion of listed investments would make it appropriate for the Ministry to consider alternative return targets for the real estate portfolio. The return targets selected by other investors are described in more detail in box 2.4.
Textbox 2.4 Return targets selected by other investors for their real estate portfolios
A number of the largest funds internationally have selected different return targets for their real estate investments. Data from CEM Benchmarking, for 12 large funds internationally shows the that most of the return targets for real estate investments are based, in full or in part, on unlisted real estate indices, like the indices from IPD and NCREIF. This probably reflects the fact that the real estate portfolios are primarily invested in unlisted real estate.
Some investors, like the New Zealand Superannuation Fund, use indices of listed real estate companies as return target for their entire real estate portfolio. This is often based on the premise that the asset manager may choose freely between listed and unlisted investments. Using indices of listed real estate companies may make it more challenging to evaluate the performance of the asset managers as far as unlisted investments are concerned. Such indices may, on the other hand, reflect the long-term risk associated with the real estate portfolio in a good manner if adjusted for differences in leveraging, country and property composition. An index of listed real estate companies will also constitute an investable and transparent alternative for the asset manager. In comparison, indices of unlisted real estate will include properties that are not necessarily for sale, nor does the index provider disclose which assets are encompassed by the index. However, a weakness of the listed real estate market is that it is small, and that its country and sectoral composition deviates from that of the overall real estate market.
An alternative to using indices of listed real estate companies may be to use a return target comprising listed equities and bonds. The Canada Pension Plan Investment Board (CPPIB) does, for example, apply a benchmark comprising 65 percent listed equities and 35 percent bonds in determining its return target for unlisted investments. The CPPIB aims to preserve the risk characteristics of the fund, as expressed through the equity and fixed income portions of its benchmark, when making new investments. It therefore defines an equity and fixed income weight for each new investment, which may be deemed to represent the funding or opportunity cost of the investment. As per the end of September 2012, the CPPIB was invested in 10.6 percent real estate, 16.5 percent unlisted equities and 6.2 percent infrastructure.
Indices of listed equities and bonds are, like indices of listed real estate companies, simple and investable. The asset manager may reduce the scale of the real estate investments if the trade-off between return and risk is not deemed to be attractive. The weakness is that the return will not always vary in line with the real estate return, and that it may therefore be difficult to use such indices as a basis for evaluating the performance of the asset manager. On the other hand, a return target made up of listed equity and bond indices may represent a simple and investable return target that can also be used for portfolios that include other unlisted investments, such as infrastructure and unlisted equities.
2.5 Analyses of risk
2.5.1 Introduction
The special characteristics of the Fund as a long-term investor without clearly defined liabilities means that is has a greater ability to absorb risk than many other investors. What is an appropriate risk level for the Fund will depend on the risk tolerance of its owners, represented by the Storting. The Storting’s endorsement, in 2007, of an increase in the equity portion from 40 percent to 60 percent has contributed to defining what constitutes an acceptable level of risk for the Fund.
Experience shows that one needs to be prepared for periods of considerable turbulence and volatility in the return on the Fund. This section uses historical returns and model-based forward looking simulations over five-year periods to illustrate the risk level implied by the adopted strategy for the Fund.
2.5.2 Historical return and risk
The economists Dimson, Marsh and Staunton have gathered data on the return on equities and government bonds in a number of countries for the period from 1900 to 2011. The Ministry has, based on these data6, calculated the historical real return and risk for a portfolio comprising 60 percent equities and 40 percent government bonds over the period 1903–2012.
The calculations do not take into account the fact that a portion of the GPFG is invested in corporate bonds and real estate. Data going back to such an early date are not available for those investments. There are also other differences between the available data and the asset composition of the Fund, one of which is that the maturity of the bonds included in the historical data is generally longer than that of the fixed income investments of the GPFG. This increases their sensitivity to changes in the interest rate. Nonetheless, the calculations provide a reasonable illustration of the real return fluctuations that would have been experienced by a fund pursuing the investment strategy of the GPFG over this period.
Figure 2.10 shows the historical real return for a portfolio comprising 60 percent equities and 40 percent bonds from 1903 to 2012. Each bar in the figure shows the average annual real return over a five-year period. The figure shows that the real return has been positive over most of these five-year periods. However, it was negative over four of these periods.

Figure 2.10 Average annual real return (geometric) on a global portfolio comprising 60 percent equities and 40 percent bonds over 22 five-year periods. 1903–2012. Percent
Returns measured in U.S. dollars for equities and in local currency for bonds.
Source Dimson, Marsh and Staunton, Global Returns Data (2012), Thomson Reuters Datastream and the Ministry of Finance.
There have been major variations in the real return between the periods. The return was as high as 15.5 percent annually over the best-performing five-year period, whilst it was as low as minus 5.8 percent annually over the worst-performing five-year period, cf. table 2.4. The standard deviation, which is a common measure of return volatility, is 6 percent. This indicates that fluctuations of 6 percentage points in the average real return over periods of five years have been common. When the volatility of returns is measured over shorter periods, the standard deviation is higher. For example, the standard deviation of the annual real return since 1903, for a portfolio comprising 60 percent equities and 40 percent bonds, is calculated to be 12.2 percent.
Table 2.4 Historical real return and risk for a global portfolio comprising 60 percent equities and 40 percent bonds over 22 five-year periods. 1903-2012. Percent
Average annual real return (geometric) over 5-year periods | 4.4 |
Standard deviation of average return over 5 years | 6.0 |
68-percent confidence interval for 5-year return | -1.2 – 10.5 |
5-year period with the lowest average return | -5.81 |
5-year period with the highest average return | 15.52 |
1 1913-1917
2 1983-1987
Returns measured in U.S. dollars for equities and in local currency for bonds.
Source Dimson, Marsh and Staunton, Global Returns Data (2012), Thomson Reuters Datastream and the Ministry of Finance.
The historical calculations show that one must be prepared for the return on the GPFG to fluctuate considerably from year to year, and also over periods of several years. The risk implied by the investment strategy does, at the same time, form the basis for a higher expected return over time. On average over all the five-year periods, a portfolio comprising 60 percent equities and 40 percent bonds would have delivered a real return of 4.4 percent. This is considerably higher than the real return on bonds alone, which on average was 1.7 percent.
2.5.3 Projection of the value of the Fund
The risk associated with the management of the GPFG can also be illustrated by forward looking model projections (simulations). Such model projections make it possible to take into account several considerations that are of relevance to developments in the value of the GPFG, but not reflected in the historical return data described above. Such considerations include, inter alia, the following:
There is an inflow of capital to the Fund from the net cash flow of the State from petroleum activities, and capital is contributed from the Fund to the fiscal budget in accordance with the fiscal policy guideline. Net inflows will contribute to increasing the value of the Fund, independently of the return.
There is considerable uncertainty associated with the future return on the Fund, and it is not reasonable to expect future developments to mirror historical developments.
The model projections for the future value of the GPFG is based on the forecasted net cash flow from the petroleum activities, cf. Report No. 1 (2012–2013) to the Storting – The National Budget for 2013, as well as the fiscal policy guideline on contributions from the Fund to the fiscal budget. Return and risk for equities and bonds are based on long-run estimates, cf. Report No. 10 (2009–2010) to the Storting – The Management of the Government Pension Fund in 2009. The model simulates the Norwegian kroner value of the Fund. It takes into account the fact that both the oil price and the Norwegian kroner exchange rate may fluctuate. The projections presented below focus on five-year periods. The Ministry has previously presented corresponding analyses examining longer periods (15 to 20 years), cf. Report No. 15 (2010–2011) to the Storting – The Management of the Government Pension Fund in 2010.
Figure 2.11 shows the simulated development in the real value of the Fund (after adjusting for inflation). The black line shows the expected future value of the Fund, whilst the fans around the line illustrate the uncertainty. The projections indicate a 68-percent probability that the value of the Fund will fall within the orange fan, whilst there is a 95-percent probability that the value will fall within the orange or the brown fan. The projections indicate a 68-percent probability that the real value of the Fund after five years will fall within the range from NOK 4,200 to 6,500 billion. The expected value is NOK 5,200 billion.
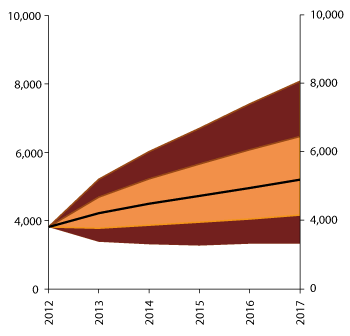
Figure 2.11 Projection of the real value of the GPFG five years into the future (until the end of 2017)1 based on long-term assumptions. NOK billion at 2013 prices
1 Based on the Ministry’s long-term assumptions concerning the future real return and risk, forecasted net cash flows from petroleum activities as per the National Budget for 2013, and oil price and Norwegian kroner exchange rate uncertainty. The value of the Fund as per yearend 2012 is NOK 3,816 billion.
Source Ministry of Finance.
These forward looking model projections confirm the results from the above historical analysis which shows that one must be prepared for considerable fluctuations in future returns on the Fund.
The Ministry’s return and risk estimates are long-term expectations. These are intended to reflect, in line with the investment horizon of the Fund, the expectations of the Ministry with regard to the real return and risk for periods that include many upturns and downturns in the financial markets. In the shorter run, for example over specific five-year periods, the financial market outlook may deviate considerably from the long-term expectations. The uncertainty in the future value of the Fund may therefore be greater than illustrated in figure 2.11.
3 The investment strategy of the Government Pension Fund Norway
3.1 Background
The capital base of the Government Pension Fund Norway (GPFN) originates primarily from national insurance scheme surpluses from the introduction of the scheme in 1967 and until the late 1970s. The capital of the GPFN is deposited with Folketrygdfondet, which manages the assets in its own name and in accordance with a mandate issued by the Ministry. The return on the GPFN is not transferred to the Treasury, but is added to the fund capital on an ongoing basis. Hence, there are no transfers between the fiscal budget and the GPFN, or any capital transfers between the GPFG and the GPFN.7 The market value of the GPFN was NOK 145 billion at yearend 2012, cf. the discussion in section 4.2.
The main part of the assets of the GPFN is invested in the Norwegian stock and bond markets. The characteristics of the Fund, such as size and a long investment horizon, distinguish the GPFN from many other investors in the Norwegian capital market. Size entails certain benefits, including the ability to exploit economies of scale in asset management. At the same time, the size of the Fund somewhat restricts opportunities for major portfolio composition changes within a short space of time. The Norwegian market is, moreover, characterised by low liquidity in the stocks and bonds of several companies. This adds to the challenges associated with major short-term portfolio adjustments.
The GPFN is a major owner and lender in the Norwegian capital market. The Norwegian equity portfolio represents in excess of 10 percent of the market value of the main index of the Oslo Stock Exchange (adjusted for ownership stakes that are not freely tradable; so-called free float), thus making the Fund one of the principal investors on that exchange. The Norwegian portion of the GPFN fixed income portfolio represents about 5 percent of the value of the benchmark index for the Norwegian bond market. The large long-term holdings of the GPFN in the Norwegian stock and bond markets contribute to market stability. The rebalancing rules are an important part of this. These imply that the Fund acquires additional holdings in the asset class whose value has declined, in order to maintain the distribution between stocks and bonds stipulated by the Ministry. Hence, the Fund will purchase stocks during periods when others are selling, and thus contribute liquidity to the market.
3.2 The investment strategy
The Ministry of Finance has adopted a benchmark index for the investments of the GPFN. The benchmark index reflects the investment strategy chosen by the Ministry. The index provides a detailed description of how the assets of the Fund should, as a main rule, be invested. The strategic benchmark index is divided into stocks (60 percent) and bonds (40 percent), and is also divided into two geographical regions; Norway (85 percent) and the Nordic region excluding Iceland (15 percent); cf. figure 3.1.
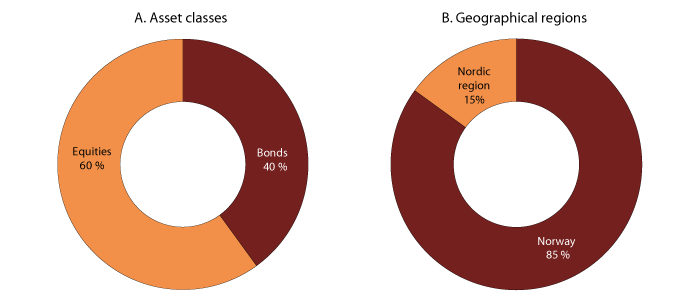
Figure 3.1 Strategic benchmark index for the GPFN. Percent
Source Ministry of Finance.
Folketrygdfondet may, within certain limits, deviate from the benchmark index. The purpose of such deviations is to generate excess return. The Ministry requires Folketrygdfondet, under the mandate for the GPFN, to organise asset management with a view to making the annualised standard deviation of the excess return between the actual portfolio and the actual benchmark index not exceed 3 percentage points on an ex ante basis (expected tracking error). This requirement implies, under certain assumptions relating to normal distribution, that the expected return difference between the Fund and the benchmark index does not exceed 3 percentage points in two out of three years. In one out of three years the difference is expected to exceed 3 percentage points. The method for calculating expected tracking error shall be approved by the Ministry. In addition, a number of supplementary risk limits have been adopted, cf. Report No. 15 (2010-2011) to the Storting – The Management of the Government Pension Fund in 2010.
The mandate adopted by the Ministry for the GPFN allows for the fund assets to be invested in unlisted companies (private equity) whose board of directors has expressed an intention to seek a listing on a regulated market place. Hence, it does not allow the fund assets to be invested in private equity on a general basis.
The rebalancing rules form an important part of the investment strategy for the GPFN. Experience from the rebalancing of the GPFG was discussed in Report No. 17 (2011-2012) to the Storting – The Management of the Government Pension Fund in 2011. The Ministry emphasised that the purpose of rebalancing is to ensure that the risk of the Fund does not over time deviate materially from the risk implied by the long-term asset class allocation adopted for the Fund. The Ministry notes, at the same time, that rebalancing is somewhat countercyclical in nature, inasmuch as the Fund will be adding to its holdings in the asset class whose value has declined in relative terms. The Ministry concluded that rebalancing should continue, although revision of the detailed rules was called for. The new rebalancing rules for the GPFG were presented in the National Budget 2013, cf. Report No. 1 (2012-2013) to the Storting.
In view of the amendments to the GPFG rebalancing rules, the Ministry will consider, after taking advice from Folketrygdfondet, whether the current rebalancing rules for the GPFN are also in need of adjustment. The Ministry will inform the Storting of such adjustments.
4 Asset management follow-up
4.1 Performance of the Government Pension Fund Global
4.1.1 Market developments in 2012
The sovereign debt crisis and uncertainty about the funding prospects of European banks influenced financial market developments in 2012. The beginning of the year was characterised by major market uncertainty. European authorities announced measures to calm the markets during the first quarter. The US economy did, at the same time, show several signs of improvement, including strengthening consumer confidence indicators and unemployment declining to a three-year low. Moreover, a number of central banks, including the US, European, Japanese and Chinese, launched new measures to keep interest rates low and stimulate economic growth. This contributed to reduced stock and bond market volatility over the quarter.
The second quarter brought indications of slower growth in the world economy and renewed fear of aggravation of the European sovereign debt crisis. This again dampened investors’ risk appetites. Several key institutions lowered their growth estimates in the wake of weaker than expected developments in Europe, the US and China. In April, Chinese authorities announced that Chinese economic growth fell towards 8 percent in the first quarter, the lowest level for almost three years. At the same time, weaker growth prospects in Europe gave rise to concerns about lower demand for Chinese products in China’s main export market. In May, the OECD cautioned about potentially serious consequences for the world economy unless the authorities took steps to stimulate growth and prevent contagion of the debt crisis. In June, Spain and Cyprus became the fourth and fifth eurozone country, respectively, to request financial support from the eurozone authorities and the IMF since 2010. The stock markets contracted significantly through the quarter due to the mounting uncertainty. Yields on, inter alia, US, UK and German government bonds fell to record lows, driven by demand from investors seeking safe havens. Conversely, yields on government bonds from Italy and Spain, the third and fourth largest eurozone economies, increased on mounting concern about potential default on their national debts.
In July, the President of the European Central Bank (ECB) stated that the bank would use any means to combat the sovereign debt crisis in Europe and to save the euro. A number of other central banks, including the US and Chinese, announced a number of growth-stimulating measures in the second half of the year. Fear of stagnating economic growth in China also abated in the second half of the year. This contributed to a significant stock market upturn in the second half of 2012.
The end of last year was characterised by the challenging US budget situation.
4.1.2 The market value of the Fund
At yearend 2012, the market value of the GPFG was NOK 3,816 billion. The assets comprised NOK 2,336 billion in stocks, NOK 1,455 billion in bonds and NOK 25 billion in real estate, cf. figure 4.1. The equity portion of the benchmark index increased over the year due to stock market returns outpacing bond market returns. The rebalancing rules allow the equity portion of the benchmark index to vary between 56 percent and 64 percent as a result of stock and bond markets not moving in step. When the equity portion of the benchmark index moves outside this range, the rebalancing rules ensure that the equity portion is reverted to 60 percent. The rebalancing rules were described in chapter 5 of the National Budget for 2013.
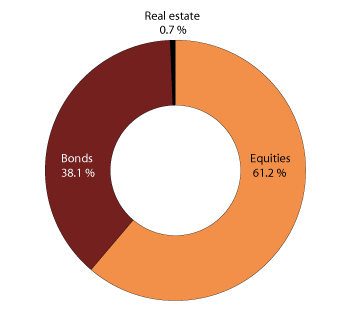
Figure 4.1 Distribution of the actual investments of the GPFG at yearend 2012. Percent
Source Norges Bank.
The market value of the GPFG increased by NOK 504 billion during the course of 2012. Figure 4.2 shows the change in the Norwegian kroner market value of the Fund in 2012 and since its inception in 1996, split into capital inflows, returns, changes in the Norwegian kroner exchange rate, as well as asset management costs. Total capital inflow to the Fund since its inception in 1996 is NOK 3,058 billion, whilst the total foreign currency return before asset management costs is NOK 1,107 billion. The kroner exchange rate has appreciated over the period, which has reduced the fund value, as measured in Norwegian kroner, by NOK 331 billion. Figure 4.3 shows fund value developments since inception.
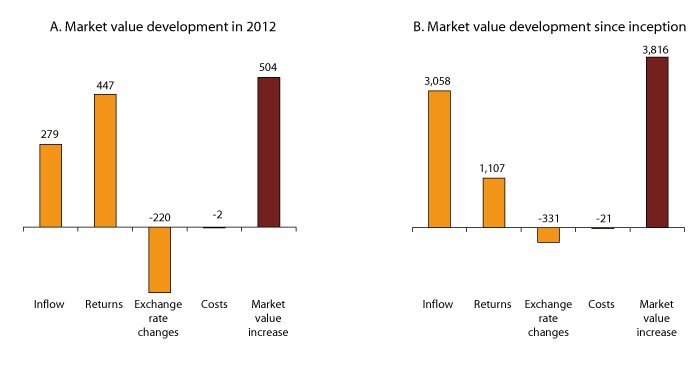
Figure 4.2 Developments in the market value of the GPFG in 2012 and since inception of the Fund in 1996. NOK billion
Source Norges Bank and the Ministry of Finance.

Figure 4.3 Developments in the market value of the GPFG. 1996–2012. NOK billion
Source Norges Bank.
Of the NOK 279 billion inflow in 2012 about NOK 2.5 billion was used to cover GPFG asset management costs for 2011. About 56 percent of the remainder was invested in equities. A further 39 percent was invested in bonds, whilst real estate accounted for 5 percent. The Ministry of Finance adopted a number of changes to the strategy for the GPFG in 2012, cf. Report No. 17 (2011-2012) to the Storting – The Management of the Government Pension Fund in 2011. The changes imply somewhat of a reduction in the portion of European securities over time and an increase in the portion of emerging market securities, cf. the discussion in section 2.1. The changes resulted in about 40 percent of the capital inflow in 2012 being invested in emerging markets.
At yearend 2012, the GPFG held an average of about 1.2 percent of the global listed stock market, as measured by the market value of the FTSE Global All Cap equity index, cf. figure 4.4. Ownership stakes were larger in developed markets, but the strategy changes contributed to an increase in the emerging market ownership stake to about 1.1 percent, from 0.8 percent at yearend 2011. Ownership stakes in global bond markets were about ¾ percent, measured as share of the market value of fixed income indices constructed by Barclays.

Figure 4.4 Ownership stakes of the GPFG in global stock and bond markets. 2002–2012. Percent
Source Norges Bank.
During 2012, the Fund acquired real estate in Switzerland, France and the UK valued at just over NOK 11 billion, principally in the form of office premises and shopping centres. In addition, the Fund has concluded an agreement for the acquisition of two office buildings in Germany at about NOK 2.8 billion, as well as a stake in a portfolio comprising 195 logistics properties in 11 European countries at about NOK 8.9 billion.
External management
At yearend 2012, 3.9 percent of the GPFG was managed by external managers, down from 4.4 percent a year earlier. The remainder of the assets are managed internally by Norges Bank. External management predominantly involves equity mandates in emerging markets and small companies in developed markets. These are markets and segments where Norges Bank does not deem it appropriate to develop internal expertise, whilst the Bank believes that prospects are good for outperforming the general market.
Effect of inflows
Figure 4.5 shows that annual inflows to the GPFG have varied considerably. Since 1996, oil price increases have tended to be accompanied by stock market appreciation. Oil prices have again determined the magnitude of inflows to the GPFG. Hence, this period has been characterised by a tendency for high inflows to the GPFG to take place in years of relatively high stock market pricing, and vice versa. These developments may, when taken in isolation, imply that the Fund’s purchases of securities have increased during periods of stock markets appreciation. On the other hand, the benchmark index rebalancing rules have contributed to the Fund purchasing stocks during periods that in retrospect have turned out to be favourable.

Figure 4.5 Annual inflows to the GPFG. 1996–2012. NOK billion
Source Ministry of Finance.
Figure 4.6 shows the average annual return on the capital inflow for each of the years since 1996. It may be noted that capital inflows from the 1990s have generated annual returns, before the deduction of asset management costs, of about 5 percent until and including 2012. Capital inflows from 2007 and 2008 have generated average annual returns in excess of 3 percent over the period until and including 2012. In other words, this capital has retained its purchasing power with a good margin despite being invested just before and during the financial crisis. The capital inflows after 2008 have generated higher returns. Differences are largest for the last few years. This is, inter alia, due to the capital having been invested for a few years only.
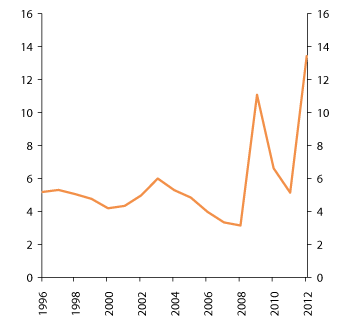
Figure 4.6 Average annual return on the GPFG for the capital inflow for each of the years until and including 2012. 1996–2012. Percent
Source Norges Bank and the Ministry of Finance.
4.1.3 Return
Reporting of the return on fund assets is focused on developments measured in the currency basket of the Fund, cf. box 4.1. The investments of the GPFG seek to maximise international purchasing power, given a moderate level of risk. Changes in the Norwegian kroner exchange rate may in some years have a major impact on fund value measured in Norwegian kroner, but do not affect the international purchasing power of the Fund.
Textbox 4.1 Return measured in the currency basket of the Fund and in Norwegian kroner
GPFG assets account for the majority of State savings. The Norwegian kroner value of the Fund is therefore of relevance to State finances when taken in isolation. The fiscal policy guideline is, for example, based on the premise that transfers to the fiscal budget correspond to four percent of the Norwegian kroner value of the Fund. However, the Norwegian kroner value of the Fund is of less relevance to Norway as a nation.
Oil and gas sales leave Norway with a considerable trade surplus. A major part of this surplus accrues to the State, most of which is saved through the GPFG. Hence, the Fund plays an important role in national savings.
Oil and gas sales generate foreign currency revenues for Norway. The foreign currency revenues are reinvested in international currency stocks, bonds and real estate through the transfers to the GPFG. A major part of the petroleum revenues is never converted into Norwegian kroner. The foreign currency revenues of the State from SDFI (the State’s Direct Financial Interest) are, for example, transferred directly to Norges Bank, which then invests these revenues in the Fund.
In a national perspective, the savings held in the GPFG shall finance future purchases of goods and services produced internationally – i.e. future imports. The quantity of foreign goods and services that may be financed by the fund capital depends on the fund value measured in international currency, and not on its value measured in Norwegian kroner. Hence, the investments of the Fund seek to maximise international purchasing power, given a moderate level of risk.
No single currency is appropriate for reporting the return measured in international currency. A basket comprising several currencies is used instead. The currency basket of the Fund is a weighted combination of the currencies included in the benchmark indices for the equity and fixed income investments of the Fund; currently a total of 36 currencies.
The Norwegian kroner exchange rate has appreciated in recent years, in both nominal and real terms. This Norwegian kroner appreciation has taken place over a period characterised by oil revenue inflows and high petroleum sector activity. Inflation in Norway is likely to develop more or less in step with that of other countries in the long run. Norwegian kroner cannot appreciate indefinitely. In the long run, when the petroleum activities decline in importance, we must, on the contrary, expect a Norwegian kroner depreciation in both nominal and real terms, cf. the discussion in section 4.6.2 of Report No. 12 (2012-2013) to the Storting – Long-Term Perspectives for the Norwegian Economy 2013.
The overall portfolio
The GPFG registered an aggregate return of 13.4 percent in 2012, measured in the currency basket of the Fund and before the deduction of asset management costs, cf. table 4.1. This was the second best performance in the history of the Fund, cf. figure 4.7. This favourable outcome reflects strong stock market performance, along with high bond market returns. The return on the Fund is evaluated against a benchmark index adopted by the Ministry of Finance. All in all, Norges Bank outperformed the benchmark index by 0.2 percentage point in 2012. The asset management costs reduced the aggregate return on the Fund by 0.06 percentage point.
Table 4.1 Return on the GPFG in 2012, the last 3, 5 and 10 years, as well as over the period 1998–2012. Measured in the currency basket of the Fund and before the deduction of asset management costs. Annual geometric average. Percent
Last year | Last 3 years | Last 5 years | Last 10 years | 1998–2012 | |
|---|---|---|---|---|---|
GPFG incl. real estate | |||||
Actual portfolio | 13.42 | 6.61 | 3.14 | 5.99 | 5.05 |
Inflation | 1.95 | 2.26 | 2.00 | 2.15 | 1.92 |
Management costs | 0.06 | 0.08 | 0.10 | 0.10 | 0.09 |
Net real return | 11.18 | 4.17 | 1.02 | 3.66 | 2.97 |
GPFG excl. real estate | |||||
Actual portfolio | 13.45 | 6.62 | 3.15 | 6.00 | 5.05 |
Benchmark index | 13.24 | 6.26 | 3.14 | 5.79 | 4.78 |
Excess return | 0.21 | 0.36 | 0.01 | 0.20 | 0.27 |
Equity portfolio | |||||
Actual portfolio | 18.06 | 6.85 | -0.59 | 7.52 | 4.43 |
Benchmark index | 17.54 | 6.65 | -0.59 | 7.09 | 3.94 |
Excess return | 0.52 | 0.20 | 0.01 | 0.42 | 0.49 |
Fixed income portfolio | |||||
Actual portfolio | 6.68 | 5.93 | 5.87 | 4.93 | 5.37 |
Benchmark index | 6.97 | 5.33 | 5.44 | 4.70 | 5.16 |
Excess return | -0.29 | 0.60 | 0.43 | 0.23 | 0.21 |
Real estate portfolio | |||||
Actual portfolio | 5.77 |
Source Norges Bank and the Ministry of Finance.

Figure 4.7 Annual nominal return on the GPFG sorted by magnitude. Measured in the currency basket of the Fund and before the deduction of asset management costs. 1998–2012. Percent
Source Norges Bank and the Ministry of Finance.
Returns have been positive in 11 of the 15 years since 1998, with only one year (2008) registering a large negative return. Appendix 1 shows the return measured in Norwegian kroner and other selected currencies. In 2012, the return on the GPFG was 6.7 percent when measured in Norwegian kroner.
Since 1 January 1998, the average annual return on the GPFG was 5.0 percent when measured in the currency basket and 4.3 percent when measured in Norwegian kroner. The return was 6.2 percent when measured in US dollars.
Stocks
The equity portfolio achieved a 18.1-percent return last year. Reduced uncertainty about the funding of eurozone countries and European banks resulted in higher demand for risky assets. The financial sector accounts for a major part of the European stock market, and market developments favoured this sector in 2012. Hence, Europe was the region with the highest overall return in 2012, but other regional markets also delivered high returns.
Bonds
The return on the fixed income portfolio in 2012 was 6.7 percent. Bond yields declined to a very low level during the year, cf. figure 4.8. Declining bond yields entail increasing bond prices, and thus higher returns.
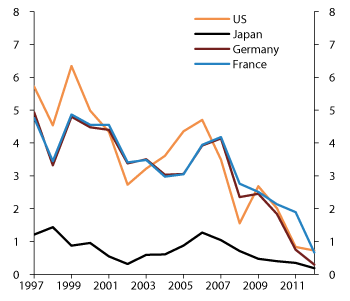
Figure 4.8 Yields on 5-year government bonds from selected countries. 1997–2012. Percent
Source Thomson Reuters EcoWin.
Increasing risk tolerance amongst investors resulted in securitised bonds and corporate bonds registering the highest price increases. Government bonds delivered the lowest return; just over 4 percent. The return was nevertheless attractive, given the low yields at the beginning of the year. At yearend 2012, the average effective yield on bonds held by the Fund was 1.9 percent, with a duration of 5.4 years. Duration is the average time until an investor receives the entire cash flow from a bond. A fixed income portfolio with a long duration will be more sensitive to yield changes than a portfolio with a short duration.
Real estate
The overall real estate investment return in 2012 was 5.8 percent, measured in the currency basket of the Fund. Net earnings from current rent revenues were 4.2 percent. The market value of some buildings was adjusted upwards as the result of an increase in expected rent revenues from the properties. This contributed 0.4 percentage point to the overall return. Transaction costs incurred in acquiring additional real estate reduced the return by 0.6 percentage point. The return on each property is measured in local currency. The overall return on the real estate portfolio is, however, measured in the currency basket of the GPFG. Since the Fund holds real estate in a small number of countries only, exchange rate changes may have a major impact on the overall return. In 2012, exchange rate changes increased the return on the real estate portfolio, as measured in the currency basket of the Fund, by about 1.8 percentage points.
It takes a long time for index providers to prepare return data for unlisted real estate in Europe. England is amongst the first markets for which return data are available, and data from the index provider IPD shows that returns in the UK market were slightly above 3 percent in 2012. Average returns were just below 5 percent in the other European countries for which the index was available by early April. On the whole, real estate values have declined somewhat in 2012. Current rent revenues nonetheless ensured a positive return.
The Ministry of Finance has commissioned a report from IPD on real estate investment returns in the GPFG. This report compares, inter alia, the return on the GPFG real estate portfolio with an index from IPD. The report is available on the Ministry website (www.government.no/gpf).
In managing the real estate portfolio, the Bank shall attach weight to environmental considerations like, inter alia, energy efficiency, water consumption and waste handling. The portfolio is under development and Norges Bank’s real estate management is still in an early phase. It will be appropriate for the Bank to report on how environmental concerns are attended to as and when the real estate investments reach a certain scale.
Stock and bond performance over time
On the whole, bonds have somewhat outperformed stocks since January 1998. This pertains both to the benchmark indices of the Fund, cf. figure 4.9, and to the actual return on the Fund, cf. figure 4.10. Norges Bank’s annual report on the GPFG shows, at the same time, that stocks have contributed returns of NOK 579 billion since 1996. Bonds have contributed returns of NOK 528 billion. Bond yields have declined over this period, thus contributing to the high return on bonds. Company earnings have increased over the same period, relative to stock prices, cf. figure 4.11. A possible reason for this is a lowering of future growth expectations, which reduces investors’ willingness to pay for stocks. Another possibility is that investors believe future earnings to have become more uncertain, thus demanding a higher risk premium to invest in stocks. A higher risk premium entails higher expected future stock returns.

Figure 4.9 Developments in the benchmark indices of the GPFG. 1998–2012. Index 31 December 1997 = 100
Source Norges Bank and the Ministry of Finance.
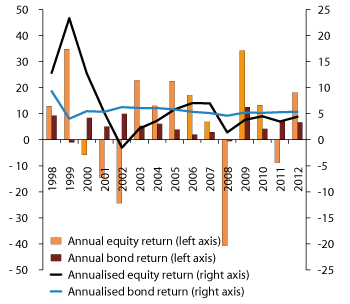
Figure 4.10 Return on the equity and fixed income portfolios of the GPFG over time. Measured in the currency basket of the Fund. 1998–2012. Percent
Source Norges Bank and the Ministry of Finance.
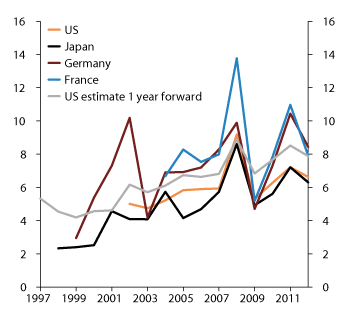
Figure 4.11 Average earnings over the last 12 months relative to market value. Stock markets in selected countries. 1997–2012. Percent
Source Thomson Reuters EcoWin.
Relative return
Norges Bank shall, within the mandate stipulated by the Ministry of Finance, seek the maximum possible return net of costs, as measured in the currency basket of the Fund.
The return on the investments of the Fund is compared to the return on the benchmark index for the Fund. All in all, Norges Bank achieved a return before the deduction of costs in 2012 that outperformed the benchmark index by 0.2 percentage point. The Ministry has previously described the excess return before the deduction of asset management costs as an estimate of the net value added from active management, cf. Report No. 10 (2009-2010) to the Storting – The Management of the Government Pension Fund in 2009.
The equity portfolio outperformed the benchmark index by 0.52 percentage point. The individual stock holdings acquired by Norges Bank for the actual portfolio may be higher or lower than those of the benchmark index. Such over- and underweighting in individual stocks contributed to the excess return on the equity portfolio. The excess return was not much influenced by the over- and underweighting of countries and sectors.
The fixed income investments of the Fund underperformed the benchmark index by 0.29 percentage point. Such underperformance reflected, inter alia, overweighting in emerging country sovereign debt relative to the benchmark index, as well as underweighting in US corporate bonds. The average duration of the bonds held by the Fund was somewhat lower than that of the bonds in the benchmark index. The Fund therefore benefited less than the benchmark index from declining yields over the year. Overweighting in government-related bonds and covered bonds denominated in euro contributed positively. See also the discussion of the internal operational reference portfolios of the Bank; section 4.1.7.
Since 1 January 1998, Norges Bank has achieved an average gross annual excess return of 0.27 percentage point, cf. figure 4.12. The Ministry has estimated the total gross excess return on the Fund for the period from January 1998 to December 2012 at about NOK 53 billion8, cf. figure 4.13.
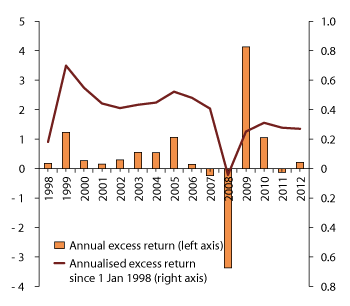
Figure 4.12 Gross excess return performance of the GPFG over time. 1998–2012. Percent
Source Norges Bank and the Ministry of Finance.
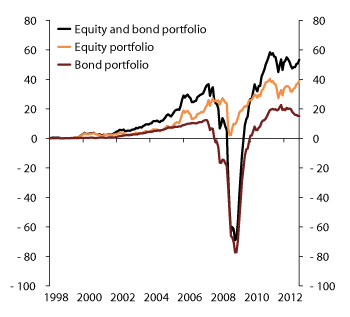
Figure 4.13 Total excess return on the GPFG. 1998–2012. NOK billion
Source Norges Bank and the Ministry of Finance.
Real return
The return on the GPFG in 2012 after the deduction of asset management costs and inflation; the net real return, was 11.2 percent, cf. figure 4.14. The average annual net real return over the period from January 1997 to December 2012 was 3.2 percent. Measured from January 1998, the average annual net real return was 3.0 percent. This is 0.5 percentage point higher than the corresponding figures at yearend 2011.
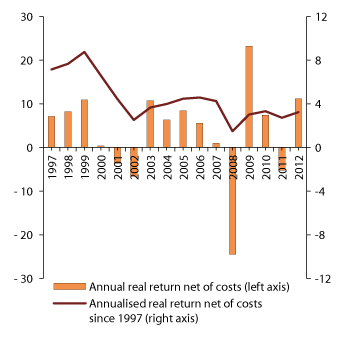
Figure 4.14 Real return on the GPFG over time, measured in the currency basket of the Fund. 1997–2012. Percent
Source Norges Bank and the Ministry of Finance.
The Ministry has presented analyses of long-term real return on the GPFG in several reports to the Storting, most recently in Report No. 17 (2011-2012) to the Storting. Future real return estimates are subject to considerable uncertainty. Dimson et.al (2013) argue that market prices provide the best estimate for future real return on fixed income instruments. In their yearbook for 2013, they predict, based on current yield levels, a real return on bonds of close to zero over the next 20 years.
Last year, the OECD presented long-term and medium-term development paths for global economic growth, cf. OECD Economic Outlook No. 91 from May 2012. Real interest rates vary with economic developments in the OECD models and are determined by, inter alia, inflation targets and the economic growth potential. The OECD models several development paths. Its reference path sees real interest rates increasing towards 2030, to levels in line with the long-term return estimate of the Ministry.
4.1.4 Risks and limits
Fund risk
Standard deviation is a statistical measure of risk. Standard deviation can, under simplified assumptions concerning normal distribution of returns over time, be used to indicate the expected normal volatility of fund value. Standard deviation is, for example, used in model computations of future returns and risks, cf. Report No. 10 (2009-2010) to the Storting. The standard deviation of the annual real return on the Fund is estimated at about 10 percent. With fund assets of almost NOK 4,000 billion and simplified assumptions concerning normal distribution, a 10-percent standard deviation means that fluctuations in the real return on the Fund will fall within a range of +/- NOK 400 billion in two out of three years. Fluctuations will fall outside the said range in one out of three years. Historically, volatility has exceeded that implied by the normal distribution assumptions. In 2008, the real return on the investments of the Fund was -24.5 percent. This corresponds to about NOK 1,000 billion at the current fund value.
Figure 4.15 shows how the standard deviation of the GPFG benchmark indices has developed since 1998. The figure reflects the standard deviation at any given time as computed on the return over the preceding 12 months. The figure shows that risk measured in this way increased somewhat in the first half of 2012, and thereafter declined significantly during the second half of the year. Stock market developments had the most impact on the overall risk assumed by the Fund. Bond market risk did not change much during 2012, but declined somewhat towards yearend.
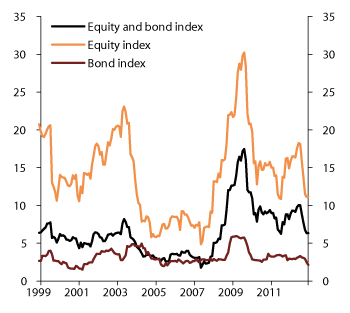
Figure 4.15 Development in the 12-month rolling standard deviation of the GPFG benchmark indices. 1999–2012. Percent
Source Norges Bank and the Ministry of Finance.
At yearend 2012, measured risk was low for both stocks and bonds when compared to historical developments, as reflected in figure 4.15 and the long-term expectations of the Ministry.
Relative risk
The mandate for the GPFG includes guidelines on return deviations between the actual portfolio and the portfolio defined by the benchmark index.
Expected tracking error is a statistical measure as to how much the actual return on the Fund can be expected to deviate from the return on the benchmark index. The mandate for the GPFG stipulates that Norges Bank shall organise asset management with a view to preventing expected tracking error from exceeding 1 percentage point. This implies, under certain normal distribution assumptions, that the difference in returns between the Fund and the benchmark index can be expected to not exceed 1 percentage point in two out of three years. In one out of three years the expected difference will exceed 1 percentage point. The Ministry has emphasised that the expected tracking error may, under extraordinary circumstances, be higher without representing a violation of the Norges Bank mandate. Moreover, in some situations the actual return deviation between the benchmark index and actual portfolio may be higher than indicated by the expected tracking error. One reason for this is that tracking error does not capture all types of risk that may arise in active management. The experience from 2008 and 2009 is an example of this.
The method for calculating tracking error is determined by Norges Bank. The method is subject to the approval of the Ministry. According to Norges Bank, expected tracking error during 2012 was well below 1 percentage point, and was calculated to be 0.5 percentage point at yearend.
The relative risk limit in the mandate for the GPFG concerns expected future deviation. In retrospect, it may be useful to look at whether this matches actual deviations. Figure 4.16 shows tracking error developments based on actual deviations between the return on the Fund and the return on the benchmark index. At any given time in the figure, tracking error is computed on the basis of the excess return over the preceding 12 months. The figure is in conformity with the expected tracking error calculated by Norges Bank. Actual tracking error in 2012 was 0.2 percentage point, based on monthly observations.
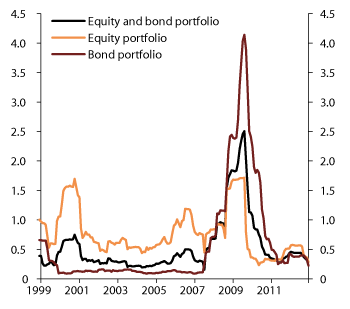
Figure 4.16 Rolling 12-month realised tracking error of the equity and fixed income portfolios of the GPFG, as well as of the Fund as a whole. 1999–2012. Percent
Source Norges Bank and the Ministry of Finance.
Figure 4.17 shows developments in the standard deviation of the Fund and of the benchmark index. The risk in the Fund has been more or less on a par with the risk in the benchmark index during most of the period since 1998. An exception was registered during and after the financial crisis in 2008, when the measured risk in the Fund was higher than that of the benchmark index. The figure illustrates that it is predominantly the risk in the benchmark index that determines the overall risk in the Fund. Active management only makes a minor contribution. The risk in the Fund has been somewhat higher than the risk in the benchmark index during 2012.
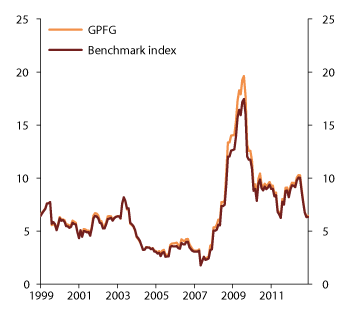
Figure 4.17 Rolling 12-month standard deviation of the actual portfolio of the GPFG vs. the benchmark index. 1999–2012. Percent
Source Norges Bank and the Ministry of Finance.
The excess return that Norges Bank is able to generate through its active management of the GPFG depends on how large a deviation is permitted relative to the benchmark index. The ratio between the achieved excess return and tracking error is called the information ratio, and expresses the risk-adjusted excess return on investments. With an expected excess return of about ¼ percentage point, and tracking error of less than 1 percentage point, the expected information ratio over time should be somewhat above ¼. Norges Bank achieved an information ratio of just below 0.4 over the period 1998–2012. The information ratio of the equity portfolio was just below 0.6 over the same period, whilst that of the fixed income portfolio was 0.2; see table 4.2. The calculated information ratios show that Norges Bank has achieved an excess return more or less in line with the expected ¼ percentage point, whilst the measured relative risk has been below the 1-percentage point limit. This results in a risk-adjusted excess return that exceeds expectations.
Table 4.2 Absolute and relative risk measures for the GPFG. Annual data based on monthly observations. January 1998–December 2012
Last year | Last 3 years | Last 5 years | Last 10 years | 1998–2012 | |
|---|---|---|---|---|---|
GPFG excl. real estate | |||||
Absolute volatility (percent) | 6.44 | 8.25 | 11.31 | 8.44 | 7.74 |
Tracking error (percent) | 0.22 | 0.37 | 1.20 | 0.89 | 0.77 |
Skewness1 | -1.31 | -0.21 | -0.74 | -1.07 | -0.95 |
Kurtosis2 | 5.62 | 2.56 | 4.28 | 7.10 | 6.83 |
Information ratio3 | 0.95 | 0.99 | 0.01 | 0.23 | 0.36 |
Equity portfolio | |||||
Absolute volatility (percent) | 11.25 | 14.29 | 19.11 | 15.09 | 15.94 |
Tracking error (percent) | 0.29 | 0.40 | 0.84 | 0.80 | 0.87 |
Skewness | -1.53 | -0.26 | -0.58 | -0.86 | -0.75 |
Kurtosis | 6.28 | 2.79 | 3.70 | 5.26 | 4.18 |
Information ratio | 1.80 | 0.49 | 0.01 | 0.52 | 0.56 |
Fixed income portfolio | |||||
Absolute volatility (percent) | 2.08 | 2.72 | 4.27 | 3.70 | 3.50 |
Tracking error (percent) | 0.22 | 0.49 | 1.96 | 1.40 | 1.16 |
Skewness | 0.24 | -0.53 | -0.63 | -0.49 | -0.45 |
Kurtosis | 3.06 | 4.42 | 4.36 | 4.40 | 4.23 |
Information ratio | -1.27 | 1. 24 | 0.22 | 0.16 | 0.18 |
1 Skewness is a measure of the asymmetry in the distribution of returns. A positive skewness implies that there are more very high values than very low values compared to the median value, and vice versa.
2 Kurtosis is a measure of how likely it is that extreme positive or negative values will occur. A value in excess of 3 indicates that extreme values occur more often than under the normal distribution.
3 Information ratio (IR) is a risk-adjusted measure expressing how much excess return a manager has achieved as measured against the active risk (tracking error).
Source Norges Bank and the Ministry of Finance.
Credit risk
All the bonds included in the benchmark index of the GPFG have been accorded a credit rating by at least one of the leading rating agencies. The purpose of credit ratings is to indicate how likely it is that the borrower will be able to meet the interest costs and repay the loan. The portion of bonds rated A or lower increased to 29 percent in 2012, from 20 percent at yearend 2011. The increase reflects, inter alia, the Ministry of Finance expanding the benchmark index to include emerging market government bonds from 2012.
Bonds with low credit ratings, so-called high-yield bonds, are not included in the benchmark index of the GPFG. Norges Bank may nevertheless invest in such securities within the defined active management limits. The Ministry has stipulated that asset management shall be organised with a view to ensuring that such bonds do not represent more than 5 percent of the market value of the fixed income portfolio. This ensures that Norges Bank does not immediately have to sell fixed income instruments when downgraded. At yearend 2012, Norges Bank reported that the portion of the fixed income portfolio classified as high-yield bonds was 0.7 percent, as compared to 1.1 percent at the beginning of the year.
Individual investments
The role of the Fund is to be a financial investor. It seeks to diversify risk across many different securities. The Ministry has therefore stipulated that the Fund can hold a maximum of 10 percent of the voting shares of any one company. At yearend 2012, its largest ownership stake in one single company was 9.5 percent. The largest investment of the Fund in one single company had a market value of NOK 30 billion.
At yearend 2012, the Fund held stocks of just over 7,400 companies, down from about 8,000 companies one year earlier. See section 4.4.2 for a detailed discussion of the ownership stakes held by the Fund.
Limits defined by Norges Bank
In addition to the above requirements, the Executive Board of Norges Bank shall define further limits in order to manage and curtail the risk in the management of the GPFG. Any changes to such limits shall be presented to the Ministry of Finance before entering into effect. The limits concern minimum overlap between the portfolio and the actual benchmark index, credit risk9 at both individual issuer level and portfolio level, liquidity risk10, counterparty risk11, leverage, as well as limits on the reinvestment of received cash collateral. Table 4.3 shows the thresholds defined by the Executive Board for the various categories, as well as the actual levels as per yearend 2012.
Table 4.3 Limits applicable to the GPFG, laid down by the Executive Board of Norges Bank. Percent
Risk | Limits | Actual as per 31 December 2012 |
|---|---|---|
Counterparty risk | Maximum 0.5 percent for any one counterparty | 0.2 |
Credit risk | Any one issuer of bonds with a credit rating below Baa3/BBB- can represent a maximum of 1 percent of the fixed income investments | 0.1 |
Overlap between actual holdings and benchmark index | Stocks: minimum 60 percent Bond issuers: minimum 60 percent | 85.3 71.6 |
Liquidity requirement | Minimum 10 percent in government bonds issued by the US, the UK, Germany, France and Japan | 14.9 |
Leverage | Maximum 5 percent of the equity and fixed income investments | 0.0 |
Securities lending | Maximum 35 percent of the equity and fixed income investments | 3.2 |
Issuance of options | Maximum 2.5 percent of the equity and fixed income investments | 0.0 |
Securities borrowing through borrowing programmes | Maximum 5 percent of the equity and fixed income investments | 0.0 |
Investment in any one company | Maximum 1 percent of the equity and fixed income investments | 0.8 |
Assets managed by any one external management organisation | Maximum 1 percent of the equity and fixed income investments | 0.4 |
Source Norges Bank.
Real estate investment limits
The mandate for the management of the GPFG stipulates that Norges Bank shall invest up to 5 percent of the Fund in a real estate portfolio. The Fund made its first investment in unlisted real estate in 2011, and Norges Bank will spread these investments over several years. The Ministry of Finance has laid down limits on the distribution of real estate investments across countries and sectors, cf. table 4.4. In addition, the Executive Board of Norges Bank shall impose additional limits to curtail the real estate investment risk, cf. table 4.5.
Table 4.4 Limits applicable to the GPFG real estate investments, laid down by the Ministry of Finance. Percent
Risk | Limits | Actual as per 31 December 2012 |
|---|---|---|
Country distribution | France, Germany and the UK: No limit | 75.8 |
Other countries: Up to 25% of the real estate investments | 24.2 | |
Sector distribution | Office premises: 0–100% of the real estate investments | 61.0 |
Retail premises: 0–100% of the real estate investments | 37.5 | |
Housing: 0–25% of the real estate investments | 0.2 | |
Industrial premises: 0–25% of the real estate investments | 0.0 | |
Other real estate: 0–25% of the real estate investments | 1.3 |
Source Norges Bank.
Table 4.5 Limits applicable to the GPFG real estate investments, laid down by the Executive Board of Norges Bank. Percent
Risk | Limits | Actual as per 31 December 2012 |
|---|---|---|
Investments in real estate under development | Maximum 20% of the real estate investments | 1.2 |
Investments in unoccupied real estate | Maximum 25% of the real estate investments | 4.9 |
Investments in interest-bearing instruments | Maximum 20% of the real estate investments, but not more than NOK 5 billion | 0.0 |
Investments in listed real estate stocks | Maximum 20% of the real estate investments, but not more than NOK 5 billion | 0.0 |
Debt-equity ratio | Maximum 50% of the real estate investments Maximum 70% for each investment | 15.6 56.9 |
Assets managed by any one external management organisation | Maximum 15% of the real estate investments, but not more than NOK 5 billion | 0.0 |
Source Norges Bank.
An adjusted mandate entered into effect on 1 January 2013, cf. chapter 5. The Executive Board of Norges Bank has laid down new supplementary limits in compliance with such mandate.
Systematic risk factors
Norges Bank shall, according to the mandate for the GPFG, seek to organise asset management to ensure that the return on active positions is exposed to several different systematic risk factors. One example of such a risk factor is company size. Stocks of small companies have delivered different, and over time higher, returns than stocks of large companies. Size is measured as the market value of the company’s share capital. Another example is value. Stocks of companies with low valuations (value stocks) have delivered different, and over time higher, returns than stocks with high valuations. Valuation can be measured by the market value of equity relative to fundamentals like the company’s book value of equity, profits, sales or dividends. Section 2.2 discusses systematic risk factors in more detail. How dependent the return on the Fund is on developments in such factors can be analysed by comparing variations in the excess return on the Fund to variations in the excess return from such factors.
Figure 4.18 shows the findings from such an analysis of the equity portfolio carried out by Norges Bank. The analysis indicates that variations in the excess return on the equity portfolio over the last two years have been positively correlated with small company returns. Moreover, variations in the excess return on the equity portfolio in the first half of 2012 can to some extent be explained by variations in general stock market developments. The other factors register minor impacts only. What portion of the excess return volatility can be explained by the model varies over time. According to Norges Bank, the risk factors used in the analysis explain no more than about 10 percent of the excess return volatility of the equity portfolio at yearend 2012. Hence, the findings generated by the model should be interpreted with caution.
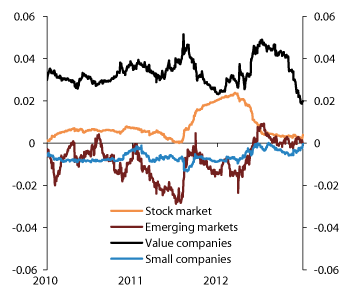
Figure 4.18 Systematic risk in the equity portfolio. Coefficients from regression analysis of daily observations. 2010–2012
Source Norges Bank.
Figure 4.19 presents an analysis of systematic risk factors in the fixed income portfolio. The analysis indicates that the fixed income portfolio was, towards the end of 2012, somewhat less exposed to increasing bonds yields than was the benchmark index. According to Norges Bank, the model can explain no more than about 12 percent of the excess return volatility, and the findings generated by the model should thus be interpreted with caution.
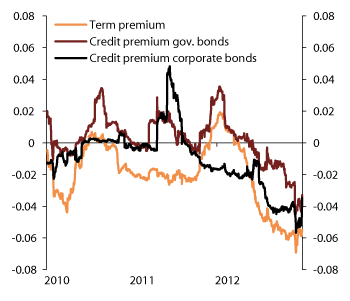
Figure 4.19 Systematic risk in the fixed income portfolio. Coefficients from regression analysis of daily observations. 2010–2012
Source Norges Bank.
4.1.5 Costs
The mandate given by the Ministry to Norges Bank implies that the actual management costs of the Bank are covered up to an upper limit, which for 2012 was fixed at 0.09 percent (9 basis points) of the average market value of the Fund. In addition, Norges Bank is compensated for fees to external managers that result from achieved excess returns.
The asset management costs declined to NOK 2.2 billion in 2012, from NOK 2.5 billion in 2011. The decline was primarily caused by lower fees to external managers, cf. figure 4.20. Simplifications and renegotiated agreements reduced IT costs, as well as settlement and custodianship costs. The number of employees increased from 315 to 336 during 2012, which resulted in higher salary and personnel costs.
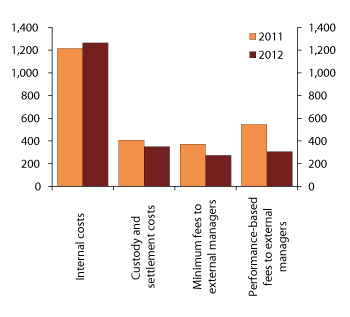
Figure 4.20 GPFG costs in 2011 and 2012. NOK million
Source Norges Bank.
Asset management costs, excluding performance-based fees for external managers, amounted to about NOK 1.9 billion in 2012. This corresponds to 0.05 percent of the average market value of the Fund. The costs represented 0.061 percent when performance-based fees for external managers are included.
Operating and administration costs are incurred in subsidiaries established in connection with the real estate investments. These costs are deducted, in line with the accounting provisions adopted by Norges Bank, from the return on the real estate portfolio, and are not charged to the asset management costs that are reimbursed from the Ministry of Finance to the Bank. These costs amounted to NOK 45 million in 2012, but are likely to increase in coming years as the real estate portfolio grows. As from 2013, these costs are required to be included in the 9 basis points limit on reimbursements to Norges Bank from the Ministry of Finance.
International cost comparison
The company CEM Benchmarking Inc. has compared the costs of the Fund in 2011 with the costs of other funds, cf. report published on the Ministry of Finance website. The comparison shows that the costs of the GPFG are significantly lower than the average for the other funds. One of the reasons for this is that the GPFG has few investments in asset classes that entail high costs, like for example private equity and real estate. Another reason is that most of the assets are managed internally by Norges Bank and that the Bank makes only limited use of external managers. CEM also finds that internal management at Norges Bank is cost effective compared to the management activities of the other funds.
Cost developments over time
The costs of the Fund increased year by year until and including 2009, in both absolute terms and as a portion of assets under management. The costs have declined over the last few years due to, inter alia, a reduction in the portion under external management. This has resulted in a reduction in both fixed and performance-based external management costs. The internal costs of Norges Bank, however, increased somewhat, due to both a general salary increase and a higher number of staff. Additional man-labour years have been needed to, inter alia, invest in real estate. Growth in the value of the Fund has nonetheless outpaced internal costs increases, thus implying a reduction in costs as a portion of assets under management, cf. figure 4.21.
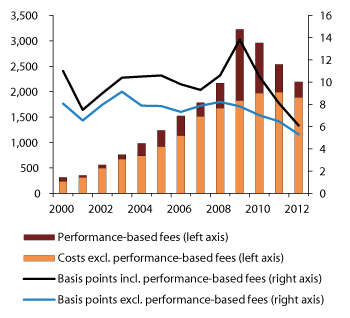
Figure 4.21 Developments in the GPFG asset management costs. 2000–2012. Measured in NOK million (left axis) and in basis points (right axis). One basis point = 0.01 percent
Source Norges Bank.
Some of the costs of Norges Bank are incurred in other currencies than Norwegian kroner. The appreciation of Norwegian kroner in recent years has thus contributed to some reduction in costs as measured in Norwegian kroner. A depreciation of Norwegian kroner at any given time would, everything else being equal, increase costs. One must also expect expanded real estate investments to result in higher asset management costs than would otherwise have been incurred.
4.1.6 Environment-related investments
In 2009, it was decided to establish specific mandates for environment-related investments in the GPFG, cf. Report No. 20 (2008-2009) to the Storting – The Management of the Government Pension Fund in 2008. The investments are made under the same regulatory framework as governs the Fund’s other investments, and form part of the active management performed by Norges Bank. In Report No. 15 (2010-2011) to the Storting – The Management of the Government Pension Fund in 2010, the Ministry wrote that it is intended for the investments to normally be in the range of NOK 20-30 billion.
In 2012, the GPFG had ten environment-related equity mandates. Eight of the mandates were externally managed, and were valued at NOK 13 billion at yearend. Two of the mandates were internally managed by Norges Bank. These were also valued at NOK 13 billion.
Seven of the mandates invested in companies within renewable energy and environment-related technology. These include, according to Norges Bank, companies that produce and distribute renewable energy, as well as companies that develop equipment for such production. Companies that develop technology for efficient use or distribution of energy are also included.
Three of the mandates focused on water management and waste handling. These include companies developing or operating infrastructure for cleaning and distributing water. The mandates also include companies that develop technology for improving water quality, as well as companies handling and making use of waste.
The total return on the environment-related investments was about 9 percent in 2012, measured in the currency basket of the Fund.
4.1.7 Operational reference portfolios
Norges Bank has established so-called operational reference portfolios for the equity and fixed income portfolios. The operational reference portfolios start out from the strategic benchmark index of the Ministry of Finance, and any deviations take place within the limits for active management. The deviations between the benchmark index adopted by the Ministry and the operational reference portfolios may be larger and apply for a longer investment horizon than would normally be the case for active management.
Some of the adjustments address methodological weaknesses in the benchmark indices, whilst others seek to benefit from various systematic risk factors. Thus far, the factors “size” and “value” have been included in Norges Bank’s operational equity reference portfolio. The Ministry of Finance has requested Norges Bank to seek to take differences in the strength of government finances into account in determining the composition of the government bond investments. Consequently, the Bank has developed government fiscal strength indicators that are included in the operational reference portfolio for bonds. The operational portfolios both encompass a number of markets that are not included in the benchmark index. In 2012, Norges Bank included, inter alia, government bonds issued in the currencies of emerging economies like India, Brazil, Russia, Turkey and Indonesia in the operational reference portfolio for bonds. Moreover, the stock markets of Qatar, Kenya, Romania, Croatia and Jordan were included in the operational reference portfolio for equities.
Norges Bank has also opted to omit certain palm oil companies from the operational reference portfolio for equities. This was because the Bank considers the business model of these companies to be unsustainable in the long run. In its annual report on the management of the GPFG in 2012, Norges Bank writes that the Bank divested its holdings in 23 palm oil producers in the first quarter of 2012.
The portfolio characteristics of inflation-linked bonds differ from those of nominal bonds, cf. the discussion in section 2.3. Norges Bank has decided, against this background, to omit the former from the operational reference portfolio for bonds. Bonds issued by international organisations have also been omitted from the operational reference portfolio.
The operational reference portfolios serve as internal benchmark indices for Norges Bank’s asset managers. Norges Bank’s annual report presents deviations between the actual portfolio and the operational reference portfolio adopted by the Bank. The Bank did, for example, reduce the Fund’s inflation-linked bond holdings from NOK 106 billion to NOK 42 billion during 2012. The holdings of bonds issued by international organisations were about NOK 34 billion at yearend 2012. Both of these sub-segments have been omitted from the operational reference portfolio.
The operational reference portfolio for equities comprised 7,195 companies at yearend 2012. The portfolio registered a return of 17.5 percent, more or less on a par with the return on the benchmark index adopted by the Ministry of Finance. The operational reference portfolio for bonds comprised 4,226 bonds at yearend 2012 and registered a return that was 0.1 percentage point in excess of that on the benchmark index adopted by the Ministry of Finance.
4.1.8 The Ministry’s assessment
The return on the GPFG last year, of more than 13 percent, was the second best performance since the Fund was established. Both the equity and the fixed income portfolio generated high returns. The equity portfolio outperformed the benchmark index, whilst the fixed income portfolio somewhat underperformed the benchmark index. All in all, the GPFG investments outperformed the benchmark index by just over 0.2 percentage point.
The Ministry is satisfied with the fact that the average annual return since 1998 is 0.27 percentage point higher than that on the benchmark index. This performance conforms well with the expectation of about ¼ percentage point previously expressed by the Ministry.
Unlisted real estate investment is a new asset class for Norges Bank. It is necessary to develop expertise and experience with such an asset class. This takes time. The Bank shall, in line with the mandate from the Ministry, seek to spread the building-up of the real estate portfolio over several years, as well as across relevant risk factors like geographical distribution and property type. The Bank shall also consider the rate at which the portfolio is established from the perspective of expected net returns and risks in the property market and investment opportunities in other markets.
Norges Bank has established so-called operational reference portfolios that deviate from the benchmark indices defined in the mandate from the Ministry. The deviations take place within the limits for active management. The Ministry deems it positive that the operational reference portfolios may contribute to increased transparency in the management of the Fund.
The Ministry is satisfied with the fact that asset management costs have been reduced in recent years, measured both in Norwegian kroner and as a portion of assets under management. This indicates that Norges Bank is able to exploit economies of scale in asset management. Nonetheless, the Ministry anticipates that going forward costs may increase somewhat in line with the increased portion of real estate investments held by the Fund. Norwegian kroner exchange rate fluctuations may also influence both the cost level and costs as a portion of assets under management.
4.2 Performance of the Government Pension Fund Norway
4.2.1 Market developments in 2012
Developments in the sovereign debt crisis in Europe had a major impact on stock markets in Norway and the Nordic region last year. The measures announced by authorities and central banks around the world over the summer also lifted the Nordic stock markets quite substantially. The top performer was Denmark, with a total return of 29 percent, as measured by the OMXCB index. In Norway, the main index of the Oslo Stock Exchange gained 15 percent. Total returns in Sweden and Finland were 17 percent (the OMXSB index) and 14 percent (the OMXH index), respectively.
At yearend 2012, the yield on Norwegian government bonds with a long time to maturity was somewhat lower than at the beginning of the year. The yield on government bonds that were closer to maturity remained more or less unchanged. In the other Nordic countries, government bond yields declined to very low levels. When businesses borrow money in the bond market, they need to offer a yield in excess of the government bond yield. These yield premiums declined in all Nordic countries, but Norway saw the steepest decline. This contributed to lifting corporate bond returns.
4.2.2 The market value of the Fund
At yearend 2012, the market value of the GPFN was NOK 145 billion; about NOK 16 billion higher than at the beginning of the year, cf. figure 4.22. About NOK 77 billion of the fund assets were invested in Norwegian stocks, whilst NOK 46 billion were invested in bonds issued by Norwegian entities. The Nordic portfolio comprised stock holdings of NOK 14 billion and bond holdings of NOK 8 billion. Consequently, the overall holdings of the Fund at yearend comprised NOK 91 billion in stocks and NOK 54 billion in bonds. The distribution of fund assets is presented in figure 4.23.
Figure 4.22 Developments in the market value of the GPFN. 1996–2012. NOK billion1
1 A major part of the GPFN assets was invested with the Treasury in the form of mandatory deposits until 2005. The mandatory deposits were discontinued in December 2006. This implied that the State redeemed deposits valued at NOK 101.8 billion, and that a corresponding amount was repaid to the State from fund assets.
Source Folketrygdfondet.
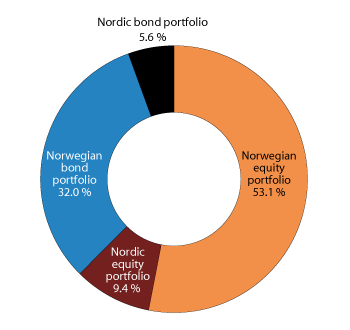
Figure 4.23 Distribution of the actual investments of the GPFN at yearend 2012. Percent
Source Folketrygdfondet.
The GPFN is a major investor in the Norwegian stock market. At yearend 2012, the Norwegian equity portfolio of the GPFN represented 10.2 percent of the market value of the stocks included in the main index of the Oslo Stock Exchange, which is the benchmark index for the Norwegian equity portfolio. The value of the Norwegian equity portfolio of the Fund accounts for 5.0 percent of the market value of all stocks listed on the Oslo Stock Exchange. The GPFN is a smaller investor in the rest of the Nordic region. The Nordic equity portfolio of the Fund accounts for 0.4 percent of the market value of the stocks included in the Nordic equity index VINX, excluding Norway and Iceland.
4.2.3 Return
The overall portfolio
The GPFN registered an aggregate return of 12.2 percent in 2012, measured in Norwegian kroner and before the deduction of asset management costs, cf. table 4.6. The strong performance was primarily the result of high stock market returns, but falling yields ensured favourable returns in the Norwegian bond market as well.
Table 4.6 Return on the GPFN in 2012, the last 3, 5 and 10 years, as well as over the period 1998–2012. Measured in Norwegian kroner. Annual geometric average. Percent
Last year | Last 3 years | Last 5 years | Last 10 years | 1998-2012 | |
|---|---|---|---|---|---|
GPFN | |||||
Actual portfolio | 12.16 | 7.50 | 4.43 | 7.81 | 6.58 |
Benchmark index | 11.92 | 6.78 | 3.31 | 7.43 | 6.08 |
Excess return | 0.24 | 0.72 | 1.11 | 0.38 | 0.50 |
Norwegian equity portfolio | |||||
Actual portfolio | 14.71 | 6.78 | -0.32 | 14.88 | 7.42 |
Benchmark index | 15.36 | 6.12 | -1.98 | 14.45 | 5.87 |
Excess return | -0.65 | 0.66 | 1.66 | 0.43 | 1.55 |
Nordic equity portfolio1 | |||||
Actual portfolio | 15.69 | 6.96 | -0.65 | 10.32 | |
Benchmark index | 15.16 | 7.55 | -1.09 | 10.01 | |
Excess return | 0.54 | -0.59 | 0.44 | 0.31 | |
Norwegian fixed income portfolio | |||||
Actual portfolio | 9.08 | 8.13 | 8.65 | 6.61 | 6.41 |
Benchmark index | 7.68 | 6.88 | 7.36 | 6.34 | 6.22 |
Excess return | 1.40 | 1.25 | 1.29 | 0.27 | 0.20 |
Nordic fixed income portfolio2 | |||||
Actual portfolio | 2.27 | 4.62 | 5.78 | ||
Benchmark index | 1.10 | 3.98 | 5.08 | ||
Excess return | 1.16 | 0.64 | 0.70 | ||
Real return | |||||
Inflation3 | 0.77 | 1.49 | 2.07 | 1.78 | 1.99 |
Costs | 0.09 | 0.08 | 0.09 | 0.06 | 0.04 |
Net real return | 11.24 | 5.85 | 2.22 | 5.87 | 4.46 |
1 Nordic equity investments commenced in May 2001.
2 Nordic fixed income investments commenced in february 2007.
3 As measured by the retail price index (CPI).
Source Folketrygdfondet, Statistics Norway and the Ministry of Finance.
The return on the Fund is compared to a benchmark index adopted by the Ministry of Finance. All in all, Folketrygdfondet outperformed the benchmark index by 0.2 percentage point, before the deduction of asset management costs, in 2012.
Asset management costs were equivalent to 0.09 percent of average fund assets in 2012.
Stocks
The Norwegian equity portfolio delivered a return of 14.7 percent in 2012, whilst the Nordic equity portfolio returned 15.7 percent. The Norwegian and other Nordic stock markets largely tracked the international markets through the year, with developments in the sovereign debt crisis and bank funding challenges in Europe having a major impact. The upturn in the second half of 2012 was, however, somewhat less pronounced in the Norwegian and Nordic markets than that of international markets.
The Norwegian equity portfolio underperformed the benchmark index by 0.6 percentage point. This must be considered from the perspective that Folketrygdfondet has stated, in its strategic plan, that it expects some degree of underperformance during periods of very steep stock price increases in the Norwegian equity market. The main negative contribution came from the energy sector, but the manufacturing and consumer sectors also contributed negatively. Investments in information technology and healthcare companies delivered positive contributions. The return differences between the actual equity portfolio held by Folketrygdfondet and the benchmark index are primarily explained by the over- and underweighting of individual companies.
Folketrygdfondet achieved an excess return of 0.5 percentage point in the Nordic equity portfolio. All in all, stock picking within each sector contributed positively to the excess return, whilst over- and underweighting between sectors made negative contributions.
Bonds
The Norwegian fixed income portfolio delivered a return of 9.1 percent, whilst the Nordic fixed income portfolio returned 2.3 percent. In Norway, yields on bonds with a long time to maturity declined. This boosted the return. The premium businesses have to pay on top of the yield offered on government bonds also declined through the year. This meant that the return on corporate bonds exceeded government bond returns. In the Nordic bond market, yield levels were already very low at the beginning of 2012, but declined further during the year. At yearend, the yield on Danish government bonds with five years to maturity was close to zero, whilst Finnish government bonds offered a yield of 0.3 percent. In comparison, the yield on Norwegian government bonds with the same time to maturity was about 1.5 percent, cf. figure 4.24. The low yield level limits the scope for high returns on the fixed income portfolio in coming years.
Figure 4.24 Yields on 5-year government bonds from the Nordic countries. 1998–2012. Percent
Source Thomson Reuters EcoWin.
The Norwegian fixed income portfolio outperformed the benchmark index by 1.4 percentage points. The actual portfolio featured a larger portion of corporate bonds and a smaller portion of government bonds than that of the benchmark index, which contributed to the excess return. In addition, Folketrygdfondet achieved a higher return on corporate bonds than did the benchmark index because, inter alia, the fixed income portfolio involved somewhat more credit risk than did the benchmark index.
The Nordic fixed income portfolio outperformed the benchmark index by 1.2 percentage points. A higher portion of corporate bonds than in the benchmark index contributed to the excess return. The portfolio also registered a higher average return on its corporate bonds than did the benchmark index. In addition, the Fund benefitted from the time to maturity of the bonds in its portfolio differing somewhat from that of the bonds in the benchmark index.
Performance measured over time
Since the beginning of 1998, the GPFN has registered an average annual return of 6.6 percent. This is 0.5 percentage point higher than the return on the benchmark index, cf. figure 4.25. The Ministry has previously expressed an expectation for an annual net value added from the active management of the GPFN of ¼ – ½ percentage point, cf. Report No. 15 (2010-2011) to the Storting. Over the period from 1998 to 2012, the average annual excess return on the Norwegian equity portfolio has been 1.5 percentage points, whilst the excess return on the Norwegian fixed income portfolio has been 0.2 percentage point. The Ministry of Finance has calculated that the total gross excess return on the Fund over the period 1998–2012 amounts to about NOK 6 billion12, cf. figure 4.26.
Figure 4.25 Gross excess return performance of the GPFN over time. 1998–2012. Percent
Source Folketrygdfondet and the Ministry of Finance.
Figure 4.26 Total excess return on the GPFN. 1998–2012. NOK billion
Source Folketrygdfondet and the Ministry of Finance.
4.2.4 Risks and limits
Fund risk
Standard deviation is a measure of variations around a mean. If the annual average return is 6 percent and the standard deviation is 10 percent, and assuming a normal distribution, the return in two out of three years is expected to be between -4 percent and 16 percent. In one out of three years the variations are expected to be greater. Figure 4.27 shows how the standard deviation of the GPFN has developed since 1998. Standard deviations are in this context calculated based on returns over the preceding 12 months. The figure shows that risk increased somewhat in the first half of last year, and then declined during the second half of the year. Developments in the overall risk in the Fund were primarily affected by developments in the equity portfolios, but the risk in the fixed income portfolios also declined during the second half of the year.
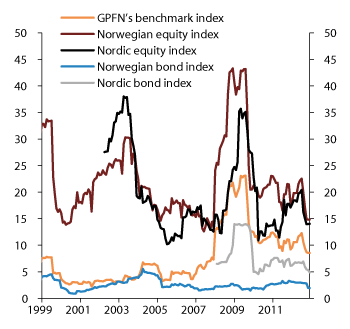
Figure 4.27 Development in the 12-month rolling standard deviation of the GPFN benchmark indices. 1999–2012. Percent
Source Folketrygdfondet and the Ministry of Finance.
Relative risk
The mandate for the GPFN requires Folketrygdfondet to organise its management activities with a view to ensuring that expected tracking error does not exceed 3 percentage points. Tracking error is a statistical measure of expected fluctuations in the return difference between the actual portfolio and the benchmark index. According to Folketrygdfondet, expected tracking error has been in the range of 0.5–0.8 percentage points in 2012, and was 0.6 percentage points at yearend. Realised tracking error over the last 12 months was lower than the expected value at yearend 2012, and was about 0.4 percentage points, cf. figure 4.28 and table 4.7. Both expected and realised tracking error are now at historically low levels, and considerably below the limit stipulated in the mandate.
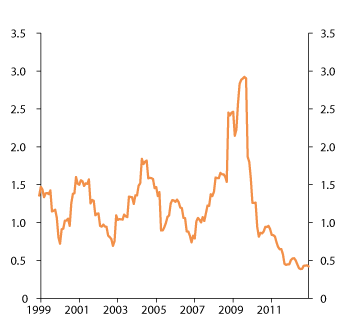
Figure 4.28 Rolling 12-month realised tracking error of the GPFN. 1999–2012. Percent
Source Folketrygdfondet and the Ministry of Finance.
Market conditions, such as low overall volatility and price developments for different stocks being more closely correlated than before, may have contributed to the low tracking error. If market volatility increases, it is likely that tracking error will also increase.
Table 4.7 Absolute and relative risk measures for the GPFN. Annual data based on monthly observations. January 1998–December 2012
Last year | Last 3 years | Last 5 years | Last 10 years | 1998–2012 | |
|---|---|---|---|---|---|
GPFN | |||||
Absolute volatility (percent) | 8.32 | 9.90 | 13.78 | 10.33 | 8.74 |
Tracking error (percent) | 0.42 | 0.63 | 1.48 | 1.42 | 1.34 |
Skewness1 | -0.95 | -0.11 | -0.83 | -1.16 | -1.19 |
Kurtosis2 | 5.09 | 2.69 | 4.31 | 6.99 | 8.87 |
Information ratio3 | 0.60 | 1.15 | 0.75 | 0.27 | 0.38 |
Norwegian equity portfolio | |||||
Absolute volatility (percent) | 14.51 | 18.19 | 25.97 | 22.19 | 22.32 |
Tracking error (percent) | 0.86 | 1.27 | 2.78 | 3.22 | 4.02 |
Skewness | -0.80 | 0.06 | -0.92 | -0.94 | -0.92 |
Kurtosis | 5.09 | 2.73 | 4.52 | 5.22 | 4.90 |
Information ratio | -0.75 | 0.52 | 0.60 | 0.14 | 0.39 |
Nordic equity portfolio | |||||
Absolute volatility (percent) | 13.90 | 15.59 | 19.72 | 17.87 | 18.46 |
Tracking error (percent) | 0.32 | 0.77 | 1.88 | 1.42 | 1.16 |
Skewness | -1.20 | -0.60 | -0.16 | -0.12 | -0.29 |
Kurtosis | 4.96 | 3.97 | 4.43 | 4.23 | 4.71 |
Information ratio | 1.69 | -0.76 | 0.24 | 0.22 | 0.24 |
Norwegian fixed income portfolio | |||||
Absolute volatility (percent) | 1.76 | 2.24 | 2.51 | 2.47 | 2.48 |
Tracking error (percent) | 0.54 | 0.79 | 1.00 | 1.05 | 0.89 |
Skewness | 0.27 | 0.12 | 0.19 | 0.39 | 0.32 |
Kurtosis | 2.77 | 2.28 | 2.63 | 3.10 | 3.52 |
Information ratio | 2.58 | 1.59 | 1.28 | 0.25 | 0.22 |
Nordic fixed income portfolio | |||||
Absolute volatility (percent) | 4.74 | 5.86 | 7.89 | 5.87 | 4.81 |
Tracking error (percent) | 0.26 | 0.35 | 0.70 | 0.50 | 0.41 |
Skewness | -0.19 | -0.11 | -0.34 | 0.00 | 0.19 |
Kurtosis | 3.33 | 3.50 | 6.87 | 10.97 | 16.04 |
Information ratio | 4.42 | 1.84 | 1.03 | 1.43 | 1.75 |
1 Skewness is a measure of the asymmetry in the distribution of returns. A positive skewness implies that there are more very high values than very low values compared to the median value, and vice versa.
2 Kurtosis is a measure of how likely it is that extreme positive or negative values will occur. A value in excess of 3 indicates that extreme values occur more often than under the normal distribution.
3 Information ratio (IR) is a risk-adjusted measure expressing how much excess return a manager has achieved as measured against the active risk (tracking error).
Source Folketrygdfondet and the Ministry of Finance.
Figure 4.29 shows developments in the standard deviations of both the GPFN benchmark index and the actual fund portfolio. The standard deviation of the actual portfolio has been less than that of the benchmark index for major parts of the relevant period. This has been especially pronounced in periods of increasing market volatility. Hence, overall risk in the Fund is predominantly determined by the benchmark index, although active management by Folketrygdfondet has at times reduced the overall risk somewhat.
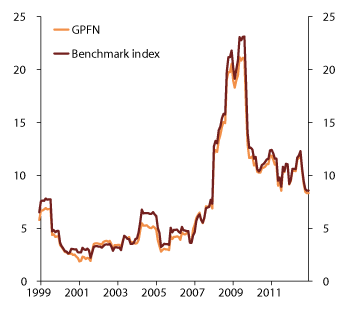
Figure 4.29 Rolling 12-month standard deviations of the actual portfolio of the GPFN vs. the benchmark index. 1999–2012. Percent
Source Folketrygdfondet and the Ministry of Finance.
In 2007, the equity portion of the Fund was increased from 40 percent to 60 percent. This change heralded a general increase in the standard deviation, and is the main reason why standard deviation appears to be at a higher level after 2007 than before.
Credit risk
Bonds with high credit risk, so-called high-yield bonds, are not included in the GPFN benchmark index. The mandate for the Fund nonetheless allows Folketrygdfondet to invest in such securities, within the defined management limits. Folketrygdfondet is required to organise its asset management with a view to ensuring that such bonds do not represent more than 25 percent of the market value of corporate bonds in the fixed income portfolio under normal market conditions. With corporate bonds representing 70 percent of the fixed income portfolio, this means that high-yield bonds shall account for less than 18 percent of the overall fixed income portfolio. At yearend 2012, high-yield bonds represented about 12 percent of the Norwegian fixed income portfolio and 3 percent of the Nordic fixed income portfolio.
Individual investments
The GPFN is a major investor in the Norwegian stock market. At yearend 2012, the Fund held ownership stakes of more than 10 percent in five companies, and more than 5 percent in 27 companies, cf. table 4.8. The GPFN is much smaller in the Nordic market, with an ownership stake of more than 1 percent in only one of the 94 companies in which the Fund was invested.
Table 4.8 GPFN ownership stakes in Norwegian and Nordic companies in 2012
Number of companies where the ownership stake exceeds | Norwegian equity portfolio | Nordic equity portfolio |
|---|---|---|
10 percent | 5 | 0 |
5 percent | 27 | 0 |
1 percent | 45 | 1 |
0.5 percent | 49 | 16 |
0.1 percent | 49 | 78 |
Total number of companies invested in by the GPFN | 50 | 94 |
Source Folketrygdfondet.
The Fund is a financial investor. The Fund aims to diversify risk across many different securities. The Ministry has therefore stipulated that it shall hold no more than 15 percent of the stocks of any one Norwegian company and no more than 5 percent of the stocks of any companies from other Nordic countries. At yearend 2012, the largest ownership stake in a Norwegian company was 11.0 percent. The largest single ownership stake in the Nordic equity portfolio was 1.3 percent.
Overlap
Overlap shows what portion of the actual portfolio is identical to the benchmark index. If overlap is 100 percent, the actual portfolio comprises the same companies as the benchmark index and each company accounts for the same portion of the actual portfolio as of the benchmark index. If Folketrygdfondet invests in stocks of companies that are not included in the benchmark index, or is overweighted in some companies and underweighted in others, overlap is reduced. Overlap between the Norwegian equity portfolio and the benchmark index has increased for several years running, and increased to about 92 percent in 2012, cf. figure 4.30. Developments in recent years suggest that the portfolio matches the benchmark index more closely than before. In the Nordic equity portfolio, overlap with the benchmark index increased to almost 86 percent in 2012, but overlap has varied more for this portfolio than for the Norwegian portfolio.
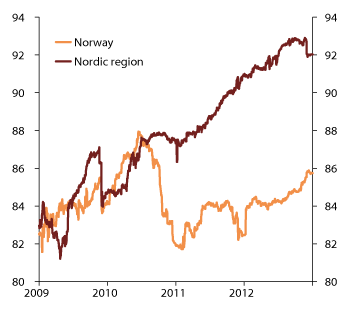
Figure 4.30 Overlap between the actual equity portfolios of the GPFN and its benchmark indices. 2009–2012. Percent
Source Folketrygdfondet.
4.2.5 Costs
According to the mandate from the Ministry of Finance, the actual asset management costs of Folketrygdfondet are covered up to a fixed Norwegian kroner limit. The Norwegian kroner limit is determined on the basis of a reasoned proposal from Folketrygdfondet, in which aggregate costs are the sum total of individual components. The Ministry defines an overall cost limit, and does not take a view on each individual cost component.
The overall asset management cost limit for 2012 was NOK 144.5 million, including investments. This amount defined a cap on the costs of Folketrygdfondet in relation to both the GPFN and the Government Bond Fund (GBF). Total asset management costs in 2012 were NOK 137.6 million, or about NOK 6.9 million below the limit.
NOK 127.6 million of the total costs in 2012 pertained to the management of the GPFN, with the remainder being costs relating to the GBF. Measured as a portion of average assets under management, GPFN costs represented 9.2 basis points (0.092 percent).
Figure 4.31 shows the development in asset management costs over time. Costs have increased since 2006. This has to do with much stricter management and compliance requirements with regard to risk and reporting, which have entailed major systems investments and additional man-labour years.
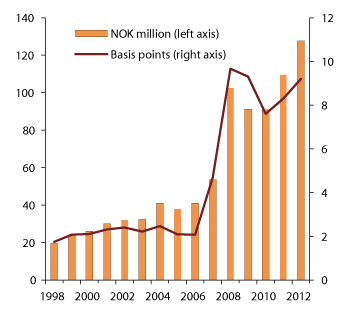
Figure 4.31 Developments in the GPFN asset management costs. 1998–2012. Measured in NOK million (left axis) and basis points (right axis). One basis point = 0.01 percent
Source Folketrygdfondet.
The company CEM Benchmarking Inc. compares the costs of the GPFN with the costs of other funds. The most recent report examines costs in 2011 and shows that the costs of the GPFN are significantly lower than the average costs of other funds. The GPFN is not invested in asset classes like private equity and real estate, that generally involve high costs. However, CEM finds that the costs of the GPFN are low even if adjusting for asset composition differences. The main reason for this is that all management of the GPFN is handled internally by Folketrygdfondet.
4.2.6 The Ministry’s assessment
2012 was a year of high returns in both the equity and bond market, which contributed to a 12.2-percent return on the GPFN. Folketrygdfondet generated an overall excess return of about ¼ percentage point in 2012. Fixed income management was the main source of outperformance, but Nordic equity management also generated positive excess return. Norwegian equity management somewhat underperformed the benchmark index. This must be considered from the perspective that Folketrygdfondet has stated, in its strategic plan, that it expects some degree of underperformance during periods of very steep stock price growth in the Norwegian equity market. The Ministry is primarily concerned about performance over time and is satisfied with the fact that the annual average excess return since 1998 has been about ½ percentage point.
The Ministry notes that the expected tracking error of the GPFN is significantly below the maximum permitted under the guidelines in the mandate. However, market conditions imply that the current expected tracking error computations may not necessarily convey an adequate impression of the risk involved in the active management of the Fund.
The costs of Folketrygdfondet have increased considerably in recent years due to, inter alia, much stricter risk management and compliance requirements. Despite this increase, costs are low compared to those of other funds. The Ministry finds it satisfactory that the management of the GPFN appears to be cost effective under the new management framework.
4.3 Follow-up of the management framework
4.3.1 Norges Bank’s framework for GPFG real estate investments
Norges Bank is in the process of developing GPFG’s real estate investment portfolio. At yearend 2012, the real estate portfolio represented 0.7 percent of fund assets, cf. section 4.1. Thus far, this portfolio comprises unlisted real estate only.
Unlisted real estate investment is a new area, representing an asset management challenge for Norges Bank. The Supervisory Council of Norges Bank has conducted, with the assistance of the external auditor of the Bank (Deloitte), an independent review of the risk management and compliance framework for real estate investments. The review is comprehensive and encompasses the management and compliance framework of the Executive Board, the risk management and compliance structure of Norges Bank Investment Managements (NBIM), as well as its due diligence and investment process. The auditor has not examined whether the real estate investments or the corporate structures established for real estate management purposes are appropriate. Nor has the auditor evaluated whether the risk identified by Norges Bank is complete and representative of the Bank’s activities. The measurement criteria for the evaluation are presented in box 4.2.
Textbox 4.2 General measurement criteria for the Deloitte assurance engagement concerning the risk management and compliance framework for the real estate investments of the GPFG
Executive Board management and compliance framework:
Risk appetite for real estate investments is clearly defined, delegated and monitored, and the effectiveness of the compliance environment is evaluated.
Investment targets are established, documented, evaluated and updated on a regular basis. Returns are measured and followed up on a regular basis.
NBIM risk management and compliance structure:
Real estate investment roles and responsibilities are clearly defined.
An effective risk management and compliance framework for real estate investments is supported by appropriate policies, procedures and escalation processes.
The real estate investment process, including real estate exposure, is incorporated in the comprehensive risk management framework of the organisation.
A combination of qualitative and quantitative return and performance targets, as well as relevant benchmark indices, are adopted and followed up at mandate and aggregate level.
Real estate risk is monitored and reported in an appropriate and timely manner and in line with responsibilities.
The investment team comprises personnel with relevant expertise and experience, and the organisation places experience at the core of its investment activities.
Due diligence and investment decision process:
Clear criteria ensuring a structured evaluation of investment opportunities have been established.
Due diligence is conducted pursuant to stipulated guidelines.
All offers are approved and professionally formulated.
Legal risk and commercial opportunities are evaluated prior to implementation.
Investment performance and returns are followed up throughout the life cycle of the investments.
The general measurement criteria above are broken down into several detailed measurement criteria. The auditor evaluation of Norges Bank risk management and compliance framework for real estate investments is based on these.
The auditor review did not uncover any material deviations from the established measurement criteria in the design and implementation of the risk management and compliance framework for real estate investments. Deloitte emphasises that the assessment was based on the current level of real estate investments. It is further emphasised that expanded future real estate investments can make matters that are currently immaterial become more important, and thus merit reassessment in the context of a different real estate investment profile. The assurance report is published on Norges Bank website and discussed in the report of the Supervisory Council to the Storting for 2012 (Doc. 9 (2012–2013)).13
4.3.2 IT infrastructure security at Norges Bank
The Supervisory Council of Norges Bank has commissioned the external auditor of the Bank to review the security of the IT infrastructure used in the Bank’s management of the GPFG. The auditor has reviewed whether infrastructure security complies with recognised standards.
In its report, the auditor concludes that IT security management and monitoring on the part of Norges Bank is in all material respects designed in compliance with the formal framework and recognised standards within the area.
It is noted, at the same time, that a number of changes effected in 2012 have an impact on IT security management and monitoring, and that these changes have only been in effect for a short time or are in the process of being implemented, cf. discussion in the report for 2012 from the Supervisory Council to the Storting (Doc. 9 (2012–2013)).
4.3.3 Independent review of the GPFG return data
The Ministry of Finance has commissioned the Spaulding Group to review the GPFG return data as from the 2012 financial year. The Spaulding Group is also Norges Bank’s independent GIPS (Global Investment Performance Standards) compliance reviewer; see report published on the Bank website (www.nbim.no/en).
The Spaulding Group receives, at the request of the Ministry, data on holdings directly from Norges Bank’s custodian for those asset classes where such information is available, i.e. for stocks and bonds. Based on custodian data, the consultancy firm calculates returns, measured in Norwegian kroner, for the asset classes stocks and bonds. The Spaulding Group also verifies, based on supplementary data on the GPFG benchmark indices from the Ministry of Finance, return data measured in the currency basket of the Fund.
The verification calculations made by the Spaulding Group for the financial year 2012 show no deviations from the return data reported by Norges Bank. The report of the consultancy firm is published on the Ministry website (www.government.no/gpf).
4.3.4 Responsible investments in the GPFG
The Supervisory Council of Norges Bank has, as part of its supervision, reviewed responsible investment and Executive Board follow-up over the year. The review shows that the Bank has, in compliance with the framework laid down by the Ministry of Finance, established relevant internal guidelines. In 2012, Norges Bank Investment Management (NBIM) reorganised to strengthen the professional basis for, and integration of, responsible investment in asset management, cf. the discussion in the report from the Supervisory Council to the Storting for 2012 (Doc. 9 (2012–2013)).
4.3.5 The Santiago Principles
Norway supports the so-called Santiago Principles (“Generally Accepted Practices and Principles for Sovereign Wealth Funds” (GAPP)). The Ministry participates in the International Forum for Sovereign Wealth Funds (IFSWF), which promotes the principles. The IFSWF was established in April 2009 by the International Working Group of Sovereign Wealth Funds (IWG). The principles were formulated by the IWG in 2008. Both the Ministry of Finance and Norges Bank took part in this process as part of the management of the GPFG.
The Santiago Principles address institutional frameworks, governance principles and investment activities for sovereign wealth funds. The Ministry holds these to be good principles for the management of sovereign wealth funds and considers them minimum standards complied with by the current framework governing the Government Pension Fund. The principles address, for example, transparency, governance structure, investment objective, risk follow-up, active ownership and the introduction of internal ethical guidelines.
The Ministry is of the view that the principles have contributed to improved transparency on part of sovereign wealth funds. Over time, the principles can build confidence and contribute to the promotion of a stable and open international investment climate, as well as well-functioning financial markets. The Ministry has reported on the Fund’s compliance with the principles in a self assessment.14 24 countries are currently affiliated with the Forum. The annual meeting of the Forum in the autumn of 2013 will be held in Oslo.
4.3.6 The counterparty risk management and compliance framework of Folketrygdfondet
Folketrygdfondet is responsible for the management of the Government Pension Fund Norway (GPFN) on behalf of, and pursuant to a mandate adopted by, the Ministry. The follow-up of Folketrygdfondet’s asset management includes an assurance engagement arrangement, corresponding to that applied to Norges Bank’s management of the GPFG. The assurance engagement for 2012 addresses the counterparty risk management and compliance framework of Folketrygdfondet.15
The auditor (Ernst & Young) has concluded, in its assurance statement for 2012 that the counterparty risk management and compliance framework is in all material respects consistent with internationally recommended practice and leading standards. Moreover, the auditor is of the view that the framework has in all material respects been implemented as designed.
The assurance statement is published on the Ministry website (www.government.no/gpf).
4.4 Responsible investment
4.4.1 Introduction
The Government Pension Fund holds financial investments. The Ministry is of the view that good long-term returns depend on sustainable development in economic, environmental and social terms, as well as well-functioning, legitimate and efficient markets. The Ministry of Finance has been at the forefront in adopting ethical guidelines compared with other investors. In line with international developments, more emphasis has over time been placed on integrating corporate governance, environmental and social issues in the investment activities. Weight has also been attached to using the available responsible investment tools in a coordinated, predictable and consistent manner.
Figure 4.32 shows the main milestones in the development of the responsible investment strategy of the GPFG. In 2008 and 2009, the Ministry evaluated the ethical guidelines for the GPFG. The evaluation resulted in the introduction of new measures and tools to strengthen the Fund’s responsible investment practice. The Ministry introduced new responsible investment guidelines on 1 March 2010, which replaced the ethical guidelines of 2004.
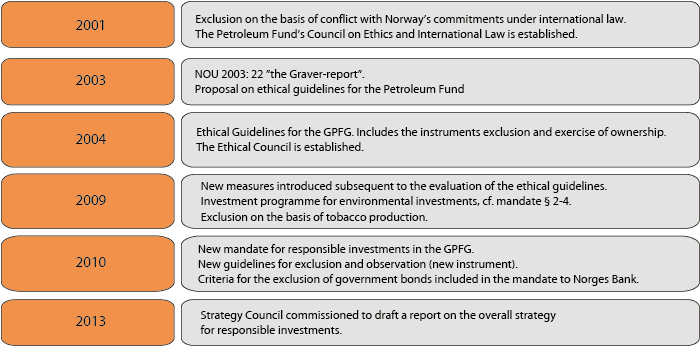
Figure 4.32 Development of the GPFG responsible investment strategy
Source Ministry of Finance.
The responsible investment strategy for the management of the Government Pension Fund currently encompasses the following areas:
international cooperation and contribution to the development of best practice;
environment-related investments;
research and analysis;
active ownership; and
observation and exclusion of companies.
Specific environment-related investments were established as the result of the evaluation of the ethical guidelines. The investments are made within the same framework as governs the other investments of the Fund in stocks and bonds. The performance of the environment-related investments is discussed in more detail in section 4.1.6.
The Ministry of Finance, Norges Bank, Folketrygdfondet and the Council on Ethics all participate in the international responsible investment debate and collaborate with others in promoting the development of practices and research within their areas. This type of collaboration is useful because it can contribute to the development and clarification of international practice, whilst at the same time proving a basis for refining the Fund’s own strategy. In 2013, the Strategy Council for the GPFG shall examine the overall responsible investment strategy for the Fund and, inter alia, consider how one may eliminate any deviations from international best practice, thus enabling the Fund to be at the forefront of developments. The mandate and composition of the Strategy Council is discussed in section 4.4.5.
In 2012, both the Ministry of Finance and Folketrygdfondet have contributed to the relaunch of Norsif – Norwegian Forum for Sustainable and Responsible Investments. Norsif is an independent association of asset owners, asset managers and service providers wishing to promote responsible and sustainable management, and is discussed in more detail in section 4.4.3.
The exercise of GPFG and GPFN ownership rights is premised on a joint platform of internationally recognised principles, cf. box 4.3. Norges Bank and Folketrygdfondet have stipulated their own active ownership principles based on these basic principles.
Textbox 4.3 Basic active ownership principles
Norges Bank and Folketrygdfondet exercise the ownership rights of the GPFG and the GPFN, respectively. The mandate given by the Ministry of Finance to the asset managers stipulates that active ownership shall be based on the UN Global Compact, the OECD Principles of Corporate Governance and the OECD Guidelines for Multinational Enterprises. These international principles define norms for good corporate governance and impose requirements concerning responsible corporate environmental and social practices. Norges Bank and Folketrygdfondet have defined their own active ownership guidelines. These specify how the said principles are integrated in company follow-up. In 2006, the UN published a set of responsible investment principles (PRI). The Ministry of Finance, Norges Bank and Folketrygdfondet have all signed up to the PRI on behalf of the GPFG and the GPFN. The PRI is based on the premise that corporate governance, environmental and social considerations affect financial returns.
UN Global Compact
The UN Global Compact defines ten universal principles derived from the Universal Declaration of Human Rights, the ILO Declaration on Fundamental Principles and Rights at Work and the Rio Declaration on Environment and Development. The principles are general in nature and state, inter alia, that businesses should respect human rights and not be complicit in human rights violations, should uphold the freedom of association and collective bargaining, and eliminate all forms of forced and compulsory labour, child labour and discrimination with respect to employment and occupation. Furthermore, businesses should support a precautionary approach to environmental challenges, promote greater environmental responsibility and the development and diffusion of environmentally friendly technologies, and combat all forms of corruption, including extortion and bribery.
More than 10,000 companies and organisations in over 145 countries have joined the UN Global Compact. The members are encouraged to participate in annual reporting on compliance with the principles.
OECD Principles of Corporate Governance
These principles are very extensive and mainly address the basis for effective corporate governance, the rights of shareholders and key ownership functions, equitable treatment of shareholders, transparency and disclosure, as well as the responsibilities and liabilities of boards of directors.
OECD Guidelines for Multinational Enterprises
These guidelines are voluntary principles and standards for responsible business practices in different areas. The OECD Guidelines for Multinational Enterprises represent the only recognised and detailed regulatory framework that member states are obliged to promote. The guidelines were amended in 2011. The new guidelines emphasise, inter alia, that the authorities have an obligation to protect human rights, whilst businesses have an obligation to ensure that no such rights are violated as a result of their activities. Moreover, the guidelines have been expanded to include labour rights. These also apply to workers who are not in permanent contractual employment, for example seasonal labourers and sub-contracted personnel. Businesses are advised to adopt a precautionary approach to most issues addressed by the guidelines. The objective is to prevent or remedy damage, injury and disadvantage imposed on people and the environment as the result of business activities. Guidance on how companies should follow up on their supply chains is also provided.
Principles for Responsible Investment (PRI)
The PRI is an initiative supported by the UN Environment Programme Finance Initiative (UNEP FI) and the UN Global Compact. The initiative is aimed at asset owners, asset managers and their professional cooperation partners. The principles provide, inter alia, guidance on how to take environmental, social and corporate governance issues into account in asset management and active ownership. Incorporation of such issues will also influence what type of information investors request from businesses and what businesses are expected to report on. The PRI currently has about 1,150 members. Norges Bank contributed to the formulation of the principles. The Ministry of Finance reports to PRI on application of the principles in the management of the GPFG and the GPFN based on, inter alia, feedback from Norges Bank and Folketrygdfondet, respectively. The PRI reporting is currently under revision. The last formal reporting to the PRI took place in 2011. There was no PRI reporting in 2012, but the Ministry has contributed to test reporting.
Active ownership is a key tool in the management of the Government Pension Fund. Both Norges Bank and Folketrygdfondet have, in line with international developments, expanded their active ownership and strengthened the interaction between active ownership and asset management in general. The active ownership of Norges Bank and Folketrygdfondet is discussed in sections 4.4.2 and 4.4.3.
Companies shall be excluded from the Fund if they produce certain products. Companies may also be excluded if there is an unacceptable risk that they contribute to, or are themselves responsible for, grossly unethical activities as defined in the guidelines. Exclusion of companies is a tool reserved for special cases. Observation may be used in case of doubt as to whether the exclusion criteria are met, or as to future developments, or if deemed appropriate for other reasons. Whether to place a company under observation is decided by reference to the specific exclusion criteria in the guidelines. A general risk that something may go wrong in a project or an area does not suffice. The assessment should relate to whether the relevant exclusion criteria are met if a specific risk materialises.
The role of the Council on Ethics in the observation and exclusion of companies from the GPFG is discussed in section 4.4.4. Section 4.4.6 examines the resource situation of the Council on Ethics.
4.4.2 Responsible investment and active ownership in the GPFG
The overarching objective of Norges Bank in its active ownership is to safeguard the financial interests of the Fund. This follows from the mandate laid down by the Ministry of Finance. The Bank shall, furthermore, integrate corporate governance, environmental and social considerations in all its investment activities, based on internationally recognised responsible investment principles. Hence, Norges Bank has adopted responsible investment principles and guidelines. These represent the responsible investment framework of the Bank, which includes active ownership provisions, and is published on the Norges Bank website (see www.nbim.no/en). The guidelines of the Bank stipulate that environmental, social and corporate governance information shall form part of the basis for the Bank’s investment decisions and risk management.
The responsible investment guidelines require the Bank to premise its active ownership on predictability, transparency and compatibility with the long-term investment strategy for the Fund. Norges Bank uses its shareholder rights to promote social and environmental considerations and improved corporate governance standards. The Bank conducts dialogues with companies, investors and authorities. It also maintains a dialogue with other parties involved in establishing financial market standards. Moreover, Norges Bank votes in general meetings and submits shareholder proposals. The Bank also issues documents outlining expectations about companies’ handling of social and environmental risks on the part of themselves and their suppliers.
Focus areas for active ownership
The GPFG equity holdings represent an average ownership stake of 1.2 percent in more than 7,000 stocks included in the benchmark index of the Fund. Although its ownership stakes are relatively low, the Fund is amongst the main shareholders of many companies. In the active ownership discussion on the Norges Bank website, the Bank writes that it is often better positioned to influence markets and individual companies than are many other investors. See the discussion of GPFG ownership stake developments at the end of the present section.
Active ownership is based on the UN Global Compact, the OECD Principles of Corporate Governance and the OECD Guidelines for Multinational Enterprises (see box 4.3). The Bank has decided to focus active ownership on six strategic areas:
equal treatment of shareholders;
roles and responsibilities of the board;
well-functioning financial markets;
children’s rights;
climate change; and
water management
The strategic focus areas shall be financially justifiable, since Norges Bank is acting in its capacity of investor.
Norges Bank also notes that it is committed to engage with individual companies, where its relationship with a company is based on long-term objectives and the process runs for many years. Such engagement seeks to communicate the expectations of the Bank and assist companies in evaluating and improving their own corporate governance processes. Confidentiality considerations and the need for ensuring good and effective processes mean that Norges Bank will not normally publish details of such contact with individual companies.
In its annual report on the management of the GPFG, Norges Bank writes that it contacted about 300 companies in 2012 to raise active ownership issues. Such engagement took the form of meetings, letters and telephone conversations. Some engagements were defined by the Bank’s long-term focus areas for active ownership, whilst other engagements resulted from company-specific events. Norges Bank did, for example, meet with the chairperson of the board of several European banks to discuss the role of the board and topics like well-functioning markets.
Integration of corporate governance, environmental and social considerations
In 2012, Norges Bank implemented measures to better integrate the active ownership objectives with the investment decisions of the Fund. The measures included internal reorganisation. The Bank believes that such reorganisation may facilitate improved information and assessment sharing between analysts and asset managers concerning voting and company engagements. The Bank emphasises that this contributes to clearer communication with companies.
Over the year, Norges Bank continued its development of an environmental, social and corporate governance database for about 4,000 of the largest companies invested in by the Fund. The value of these companies represents about 90 percent of the market value of the overall equity investments of the Fund. The database also contains financial information about the companies. The intention behind the database is to gather company-specific information about, inter alia, greenhouse gas emissions and risk indicators like human rights, health, the environment and safety. Supply chain details are also gathered for some companies. The database development demonstrates that the Bank benefits from company reporting on environmental and social risks. The database details provide the Bank’s analysts and equity managers with an improved basis for making investment decisions.
Discussion notes
Norges Bank published several discussion notes in 2012. These notes raise topics of relevance to the development of the management of the GPFG. The notes aim to stimulate discussion about the investment strategy for the Fund. One of the discussion notes published by Norges Bank addressed equal treatment of shareholders and board accountability, with the Bank outlining what it expects from companies and boards within these areas. The note is based on academic literature and input from selected chairpersons of boards, investors and other market players. As a general rule, the Bank expects the board of a company to treat all shareholders equally and explain any deviations from such practice. Moreover, the shareholders shall be able to hold the board accountable for its decisions and their implications.
Norges Bank also published a note on the theoretical foundation for well-functioning financial markets and why efficient markets are important to realise long-term objectives in the management of the Fund. The note also describes how Norges Bank can, as asset manager, promote well-functioning financial markets.
Voting, shareholder proposals and investor collaboration
In its annual report on the GPFG in 2012, Norges Bank writes that it is actively exercising its voting right as a shareholder in more than 7,000 companies to attend to the long-term interests of the Fund. In 2012, the Bank voted in more than 10,000 annual and extraordinary general meetings. Voting was based on the active ownership principles of the Bank. The Bank voted in favour of proposals it deemed to promote the long-term interests of companies and against proposals that might undermine the rights of the Fund as a shareholder. Norges Bank did, for example, vote against company mergers where the board would not be sufficiently independent of senior management. The Bank also voted against transactions in companies where major shareholders had previously discriminated against other shareholders.
Norges Bank has in recent years submitted shareholder proposals seeking to make the board more accountable to shareholders. The Bank has for example submitted proposals for the articles of association to separate the role of chief executive officer from that of chairperson of the board. The Bank is of the view that independent chairing of the board is necessary for the board to adequately supervise a company. Moreover, the Bank has proposed that the shareholders of several US companies should be entitled to propose board candidates in the notice of general meeting; so-called proxy access. Such right is important to promote active ownership, but complex and expensive to exercise in the US. Norges Bank wants to simplify the process, thereby strengthening shareholder rights. In 2012, Norges Bank submitted such proposals in four US companies.
Norges Bank states that it collaborates with other investors to put more capital behind its own views and demonstrate that it is not alone in holding such views. The Bank participates in various formal networks with investors and other capital market players. The purpose is to establish corporate governance and active ownership standards. The Bank participates in, for example, the International Corporate Governance Network, the Council of Institutional Investors and the Asian Corporate Governance Association. The Bank also participates in the UN PRI, as discussed in box 4.3.
In 2012, Norges Bank collaborated with, inter alia, Fidelity International, Capital Group International and APG Asset Management to make actual voting more efficient. Collaboration with other investors on children’s rights, climate change and water management is discussed below.
Children’s rights, climate change and water management
Norges Bank expects companies to handle social and environmental risks that may have a negative impact on the Fund’s investments. The Bank has chosen to place a special focus on risks relating to children’s rights, climate change and scarce water resources. The Bank has, as discussed above, prepared separate expectation documents for these areas. Each year, Norges Bank charts the extent to which companies in particularly exposed sectors meet its expectations. The sector reviews are based on publicly available information disclosed by the companies themselves, and include about 500 companies in each area of risk.
In the first quarter of 2012, Norges Bank published three status reports on company reporting concerning risks relating to children’s rights, climate change and water management in 2011. Only 39 of the 1,078 companies examined were awarded top scores by the Bank, whilst one third of companies were awarded a score of zero. Large companies tended to do best. Besides, companies in the US and Europe had, by and large, better reporting than Asian companies.
This was Norges Bank’s fourth status report on children’s rights, its third report on climate change and its second report on water management. The Bank states that it contacted 60 of the companies examined in 2012 to encourage them to improve their reporting. The companies contacted by Norges Bank were either industry leaders or carried a certain weight in the Fund’s equity portfolio. The objective was to persuade these companies to change their conduct and thus induce other companies in the same industry to follow suit.
Children’s rights
Norges Bank expects companies to safeguard children’s rights in their own businesses and those of their suppliers. Companies need to demonstrate that they have adequate systems in place to handle the risk of violating children’s rights.
In December 2012, Norges Bank discontinued child labour dialogues with three out of four companies involved in the Indian cotton seed industry. This happened after these companies had reported reductions in the incidence of child labour since the commencement of these dialogues in 2007. The companies had over the same period also developed systems for handling the risk of child labour and expanded such systems to encompass more seed types and more geographical areas. Norges Bank continued its dialogue with one of the companies because its reporting on child labour was inadequate.
In 2012, Norges Bank became a member of a working group advising UNICEF on children and corporate social responsibility. In March 2012, UNICEF, the UN Global Compact and Save the Children launched principles to assist businesses in assuming more responsibility for children’s rights.
Climate change
Norges Bank expects companies to develop strategies for handling climate change risk and report on what they do to reduce the risk that such changes may have a negative impact on their profitability. In 2012, Norges Bank expanded its expectations in this area to also include tropical deforestation risk. Such deforestation contributes to climate change by releasing large quantities of carbon stored in rainforests into the atmosphere. Norges Bank expects companies contributing to such deforestation to take measures to reduce deforestation or plant new trees.
In the first quarter of 2012, Norges Bank divested its holdings in 23 companies that did not, in the view of the Bank, produce palm oil in a sustainable manner. The Bank evaluated a number of companies that contributed to tropical deforestation through their involvement in the palm oil industry in Malaysia and Indonesia. Norges Bank contacted a number of these businesses to obtain information on their handling of deforestation. The Bank attached special weight to whether the companies had joined the so-called “Roundtable on Sustainable Palm Oil”, which is an international standard for certification of sustainable palm oil production.
Norges Bank also became a member of the Carbon Disclosure Project (CDP) last year. The project is supported by more than 600 institutional investors and seeks, inter alia, to improve company reporting on risks relating to climate change and scarce water resources.
Water management
Limited access to fresh water is an increasing risk for many companies. In July 2012, Norges Bank hosted a seminar during the International Water Week in Singapore on the need for companies in Asia and Australia to handle and report on water-related risk. Growing economies and populations in this region increase water demand, whilst changes in weather patterns, pollution and regulatory frameworks limit water supply. Norges Bank has since 2011 conducted a dialogue with businesses in Asia and Australia that are especially exposed to such risk. The dialogue shows that these companies are paying insufficient heed to water-related risks in their supply chains. Norges Bank expects the companies to improve their measurement and reporting of water consumption and water-related risk, and to standardise their reporting in this area.
Norges Bank also engaged, in collaboration with the Dutch pension fund PGGM, in discussions with mining and energy companies in China and India in 2012. These dialogues sought to improve these companies’ reporting on water-related risk.
Developments in GPFG ownership stakes
At yearend 2012, the equity investments of the GPFG represented an average ownership stake of 1.2 percent of the global listed stock market, as measured by the market capitalisation of the FTSE Global All Cap equity index, cf. figure 4.33. The ownership stake increased by 0.1 percentage point over the year, primarily due to new capital inflows. At the same time, the Fund held about ¾ percent of the global bond market, as measured by fixed income indices established by Barclays. Said ownership stake was somewhat higher than at yearend 2011. The highest ownership stakes are generally found in Europe. This is because the European stock and bond markets carry a higher weight in the benchmark index than would be indicated by their market size, cf. section 2.1. At yearend 2012, the Fund held stakes of more than 2 percent in 891 companies and more than 5 percent in 34 companies.
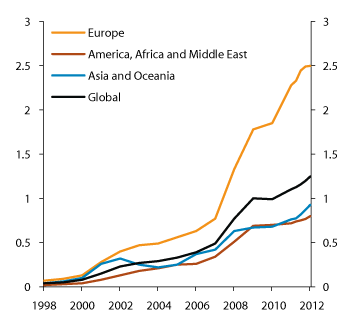
Figure 4.33 Developments in GPFG ownership stakes in global stock markets. 1998–2012. Percent
Source Norges Bank and the Ministry of Finance.
Norges Bank has examined the 1,000 largest equity holdings of the Fund at yearend 2012. The Bank estimates that the GPFG was amongst the ten largest shareholders of about 550 companies and amongst the 20 largest shareholders of about 840 companies. The largest holdings were in Europe, where the Fund had close to half of its equity investments at yearend. However, Norges Bank emphasises, in its annual report, that it is difficult to find precise data for the Fund’s ranking on the shareholder lists of all companies.
Norges Bank attends to the ownership rights of the Fund. The mandate for the GPFG requires active ownership to be based on internationally recognised standards and principles, cf. box 4.3. The growing ownership stakes mean that the Fund is one of the main shareholders in an increasing number of companies. This also affects what is expected from the Fund as owner. Norges Bank does not sit on the boards of the companies in which the Fund is invested. The Bank will act in line with what is expected from the main shareholders, including participation in election committees, which is common practice in the Nordic region.
However, this does not change the role of the Fund as a financial investor. Whether an investment is strategic or financial depends on what the investor seeks to achieve from its investments and how the investor exercises its influence through its actions. The GPFG is a financial investor whose clearly defined objective is to maximize returns over time, given a moderate level of risk.
4.4.3 Responsible investment and active ownership in the GPFN
The overarching objective of Folketrygdfondet in its active ownership is to safeguard the financial interests of the Fund. This follows from the mandate laid down by the Ministry of Finance. Folketrygdfondet shall, furthermore, integrate corporate governance, environmental and social considerations in all its investment activities, based on internationally recognised responsible investment principles. The Board of Directors of Folketrygdfondet has adopted responsible investment principles based on the “Norwegian Code of Practice for Corporate Governance” (NUES), the UN PRI and the OECD Principles of Corporate Governance. These principles define a general framework for how Folketrygdfondet shall deal with environmental, social and corporate governance issues in seeking to maximize returns over time.
Focus areas for active ownership
Folketrygdfondet is of the view that active company follow-up contributes to both lower risk and good portfolio returns over time.
As a financial investor, Folketrygdfondet gets involved in ownership issues like board composition, remuneration, reporting and communication, values and governance principles, as well as capital structure and strategy. Folketrygdfondet also deems it important to follow up on the executive salary policies of companies for purposes of safeguarding shareholder value. The Fund has adopted guidelines for executive salary schemes. Folketrygdfondet attaches weight to, inter alia, whether executive salary schemes are designed to actually promote more effective and performance-oriented corporate management. Folketrygdfondet also looks at any option schemes, and what transfer of assets from the shareholders to company executives these may trigger.
Folketrygdfondet has invested in some sectors that pose special environmental, social and corporate governance challenges. It has therefore defined certain focus areas. In 2012, Folketrygdfondet focused on environmental challenges facing the aquaculture industry and on anti-corruption. Folketrygdfondet also continues its focus on unconventional oil and gas extraction.
Company dialogue is an important active ownership component in the management of the Norwegian investment portfolio. Folketrygdfondet is committed to pursuing a constructive governance and social responsibility dialogue with companies. This implies, inter alia, that Folketrygdfondet raises relevant environmental, social or corporate governance issues with company executives. This enables companies to rectify unacceptable conditions. If companies fail to take measures after such a discussion, Folketrygdfondet may raise the matter in the general meeting. If this does not succeed either, Folketrygdfondet must eventually consider a divestment of its holdings in the company. Over the last year, Folketrygdfondet has been engaged in dialogue with several companies on, inter alia, environmental reporting, anti-corruption, human rights, including labour rights, social responsibility in new geographical areas, greenhouse gas emissions and other environmental issues. In its ownership report for 2012, Folketrygdfondet states that it has been pursuing a dialogue with 16 companies over the last year.
Integration of corporate governance, environmental and social considerations
The responsible investment principles of Folketrygdfondet apply to all of the companies in which the Fund is invested. Different methods are used in the follow-up of various sub-portfolios. In 2012, Folketrygdfondet issued the document “Folketrygdfondet’s active ownership”, presenting its active ownership of Norwegian and Nordic companies. The document is available on the Folketrygdfondet website (see www.ftf.no) and addresses the following areas:
Folketrygdfondet’s social mission
Folketrygdfondet’s characteristics and investment philosophy
Active ownership values
Key governance issues
Active ownership operationalisation
Active ownership challenges
Folketrygdfondet holds both environmental challenges and corruption to exemplify issues that may pose major financial risk in the Fund portfolio. To assist it in handling such risk, Folketrygdfondet has analysed environmental, social and corporate governance issues; so-called ESG analysis, for each of the companies in the Norwegian portfolio. The analysis examines whether a company has adopted guidelines for handling various social and environmental issues, how these guidelines are implemented and whether the company reports on compliance. Such analysis forms the basis for individual company follow-up.
Since 2009, Folketrygdfondet has had a dedicated responsible investment analyst. The analyst works alongside the portfolio managers in the equity department. Folketrygdfondet has chosen such organisation to ensure that responsible investment is integrated in both the investment activities and the follow-up of each company.
Folketrygdfondet monitors the companies in the Norwegian equity and fixed income portfolios through a systematic monitoring service supplied by an external service provider. Folketrygdfondet is notified if companies in the fund portfolio are suspected of conduct that may violate international norms, conventions or guidelines relating to, inter alia, the environment, human rights and corruption. The intention is to monitor whether companies comply with their own guidelines as well as recognised external guidelines on responsible corporate conduct, and in line with the responsible investment principles of Folketrygdfondet.
From 1 December 2012, monitoring was expanded to also encompass companies included in the Nordic equity and fixed income portfolios. This means that all investments made by Folketrygdfondet are now monitored continuously. The service provider may engage the company in dialogue on behalf of Folketrygdfondet in situations where the latter has limited ownership rights or dialogue prospects. The purpose of such dialogue will be to gather information and clarify facts, as well as to effect improvements in the company’s handling of specific environmental, social or corporate governance issues. Such dialogue shall be based on Folketrygdfondet’s existing practice for dialogue with companies in the Norwegian equity portfolio.
For investments in stocks and bonds issued by Nordic companies, Folketrygdfondet also adheres to the decisions made by the Ministry of Finance on the basis of recommendations from the Council on Ethics for the GPFG. If the Ministry excludes companies from the GPFG investment universe, these are also excluded from the GPFN investment universe.
Voting and participation on governing bodies
Active participation in the general meetings of companies is another important aspect of active ownership. Folketrygdfondet votes in the general meetings of all companies in which it holds shares as at the date of such general meetings. This implies that Folketrygdfondet voted in a total of 61 general meetings of companies listed on the Oslo Stock Exchange in the 2012 season of general meetings. Over that period, Folketrygdfondet voted against 20 proposals in the general meetings of nine different companies. These proposals concerned, inter alia, executive salaries and option schemes.
For the Nordic portfolio, Folketrygdfondet has voted in a total of 93 general meetings, all by proxy with voting instructions. In the Nordic region, Folketrygdfondet has voted against, or abstained from voting on, 25 proposals submitted by company boards. In addition, it has voted against 17 shareholder proposals.
Election committees have in recent years become increasingly prominent governing bodies. Directorships are being professionalised and board compositions with an appropriate mix of expertise for the company is of major importance. Folketrygdfondet emphasises the important role of election committees in composing competent boards. Folketrygdfondet is in itself represented on seven election committees of Norwegian companies. In addition, the Fund is represented on four corporate assemblies and eight shareholders’ committees.
Folketrygdfondet reports annually on its active ownership. The ownership report describes which activities Folketrygdfondet has pursued to attend to its ownership interests. It includes, inter alia, specific discussion of some matters deliberated in general meetings, relevant matters raised by Folketrygdfondet with companies, as well as the number and types of appointments held by Folketrygdfondet employees on the governing bodies of companies.
Both voting explanations and the ownership report are available on the Folketrygdfondet website.
Industry collaboration and collaboration with other investors
Folketrygdfondet participates in several collaboration projects and initiatives to promote responsible investment. Folketrygdfondet deems participation in external initiatives to be important because it facilitates the exchange of information and experience with other investors. Folketrygdfondet wishes to thus contribute to the development of relevant practices.
Folketrygdfondet joined the UN PRI in 2008. Folketrygdfondet also participates in the Carbon Disclosure Project (CDP), which conducts, inter alia, an annual survey on corporate greenhouse gas emissions. Information gathered through the CDP is incorporated into the company-specific ESG analyses of Folketrygdfondet.
Folketrygdfondet participates actively in the Norwegian Institute of Directors, the Norwegian Society of Financial Analysts and the Eierforum group of institutional investors. Moreover, Folketrygdfondet is one of the driving forces behind the relaunch of the Norwegian Forum for Sustainable and Responsible Investments (Norsif), which shall disseminate knowledge about, and contribute to the development of, responsible investment. Membership does not commit members to specific positions on responsible and sustainable investments. Nor shall the Forum submit consultative statements or issue normative comments on specific issues on behalf of the Forum. Norsif has a number of international sister organisations, also in the Scandinavian countries. Eurosif is an umbrella organisation for many of the European forums. Finance Norway (FNO) shall serve as the Norsif secretariat.
4.4.4 Observation and exclusion of companies
Under the guidelines on observation and exclusion from the GPFG investment universe, companies are to be excluded if they produce certain products or sell weapons to specific states. Companies may also be excluded if there is an unacceptable risk that they may contribute to, or are themselves responsible for, grossly unethical activities. The criteria for product-based and conduct-based exclusion, as well as a list of the companies excluded or placed under observation on the basis of these criteria, are available on the Ministry website (www.government.no/gpf).
The Council on Ethics regularly examines whether the grounds for exclusion of a company still apply. The Council may on the basis of new information recommend that the Ministry of Finance reverses an earlier exclusion or observation decision. Eight companies have been accepted back into the GPFG investment universe because their exclusion was no longer justified. Observation of one company has been discontinued for the same reason.
The Ministry has announced eight decisions on observation and exclusion since the previous Report to the Storting on the management of the Fund. Three additional companies have been excluded from the Fund and one company has been placed under observation. Besides, the exclusion of three companies has been reversed, and the observation of one company has been discontinued. Consequently, 55 companies were excluded and two companies were under observation as of the end of March this year.
Product-based exclusion
The guidelines establish that the fund assets shall not be invested in companies that, themselves or through entities they control:
produce weapons that violate fundamental humanitarian principles through their normal use;
produce tobacco; or
sell weapons or military material to states that are affected by investment restrictions on government bonds as described in Section 3-1, second paragraph, letter c, of the management mandate for the GPFG.
The Revised National Budget for 2004 provides an exhaustive list of weapons covered by the product-based exclusion criteria. The list includes chemical weapons, biological weapons, anti-personnel mines, undetectable fragmentation weapons, incendiary weapons, blinding laser weapons, cluster munitions and nuclear arms. The Fund shall not be invested in companies that develop or produce key components for these types of weapons.
The criterion for the exclusion of companies that produce tobacco is limited to the actual tobacco product and does not include associated products such as filters and flavour additives or the sale of tobacco products. All companies that, themselves or through entities they control, grow tobacco plants or process tobacco into end products shall be excluded regardless of how large or small a share the tobacco production represents of the company’s overall operations.
The Council on Ethics uses an external consultancy firm that continuously monitors the companies in the fund portfolio and the companies already excluded from the Fund for production in violation of the guidelines. The consultant reports to the Council on companies that may be engaged in such activities on a quarterly basis. In addition, the Council on Ethics collaborates with other financial institutions on a consultancy assignment to chart companies that produce cluster munitions.
The Council on Ethics will normally contact companies if there is reason to believe that they are engaged in production that violates the guidelines for the Fund. If companies confirm the information held by the Council, an exclusion recommendation is issued by the Council. Companies that fail to respond to the communication will be recommended for exclusion if the documentation of the Council on Ethics shows that such companies are highly likely to make products encompassed by the exclusion criteria. The Council adheres to this procedure to achieve a reasonable degree of assurance that companies making products in violation of the guidelines are excluded from the Fund. However, there is no guarantee that all companies are captured by the Council’s monitoring system at any given time.
38 companies are excluded from the Fund under the product-based criteria. 18 of these companies have been excluded on the basis of production of weapons that violate fundamental humanitarian principles in their normal use, 19 companies are excluded for producing tobacco and one company is excluded for the sale of military materials to Myanmar (Burma).
Conduct-based exclusion
A company may be excluded from the Fund if there is an unacceptable risk that the company contributes to, or is itself responsible for:
serious or systematic human rights violations, such as murder, torture, deprivation of liberty, forced labour, the worst forms of child labour and other child exploitation;
serious violations of individuals’ rights in situations of war or conflict;
severe environmental damage;
gross corruption; or
other particularly serious violations of fundamental ethical norms.
The Council on Ethics identifies companies for assessment through news monitoring, initiatives from special interest groups, and systematic evaluation of problem areas. The Council uses, inter alia, an external consultancy firm that conducts continuous Internet searches in multiple languages to identify news items on all companies in the portfolio. The Council receives monthly reports from the consultant. The Council on Ethics also reviews and examines communications from persons and organisations that request the Council to assess companies or issues.
The Council on Ethics also studies certain issues or sectors where it is particularly likely, in the view of the Council, that companies may be engaged in activities in contravention of the ethical guidelines. Such sector studies will normally be initiated by the Council appointing an expert within the area to map all companies in the portfolio engaged in a certain type of activity and to collect information about companies that may pursue activities that violate the guidelines. The Council evaluates, based on the consultancy report, which companies to examine in more detail. This evaluation takes into consideration, inter alia, the magnitude and seriousness of the norm violations, the connection between the companies and the norm violations and the likelihood of future norm violations.
Amongst the cases identified through news searches, external requests and sector studies, the Council on Ethics selects, for further investigation, those cases that appear to be the most serious. The Council on Ethics attaches weight to, inter alia, how serious the norm violations are, whether a company is accused of several counts of unethical conduct, whether it is likely that norm violations will continue, and the scope for documenting the conduct of which the company is accused. The intention is to identify companies where there is an unacceptable risk that violations of the ethical guidelines are taking place and that such violations are expected to continue.
In order to document alleged norm violations, the Council on Ethics makes extensive use of consultancy firms, researchers and non-governmental organizations based in the country where the violations of norms are alleged to be taking place. Such assignments may, for example, involve fieldwork and evaluation of documentation. Since 2009, the Council on Ethics has had a framework agreement with a consultancy firm that assists in the detailed investigation of companies.
In 2010, the Council on Ethics decided to examine nine environmental issues. This has been continued by the Council on Ethics in 2012 in, inter alia, the following areas; oil production entailing major local pollution problems, certain types of mining activity where waste handling involves special risk, unlawful logging and other particularly damaging logging, unlawful fishing and other particularly damaging fishing activity, damaging damming projects, as well as activities with extensive consequences for particularly valuable areas of protection.
Within the human rights area, the Council on Ethics examined the use of forced labour in various types of activities to identify companies with a particularly high risk of forced labour. The Council has continued to monitor cotton seed production in India due to the high risk of child labour in this sector. The Council on Ethics has also been monitoring natural resource extraction in the Democratic Republic of the Congo, settlement building on the West Bank and mineral resource extraction in Western Sahara. In 2012, the Council has examined oil companies extracting oil in Equatorial Guinea. The exclusion threshold is high, and only a minority of cases examined by the Council on Ethics result in recommendations.
The Council on Ethics has for a long time been paying special attention to infrastructure investments in Myanmar. In a letter of 11 October 2007 to the Ministry of Finance, the Council wrote that it would recommend the exclusion of companies that conclude agreements on, for example, the construction of oil pipelines in the country. The background was the extensive human rights violations in major infrastructure projects. The Council on Ethics will normally evaluate an ongoing norm violation under the observation and exclusion guidelines. In this case the Council on Ethics took the view that the risk of contributing to human right violations was unacceptable already at the outset. This implied that the Council on Ethics would recommend excluding companies already upon the conclusion of contracts, rather than waiting for any human rights violations to actually take place. In February 2012, the Ministry requested a general assessment from the Council on Ethics of companies engaged in activities in Myanmar, in view of the changed political circumstances in the country. In April 2012, the Council on Ethics wrote to the Ministry of Finance that it would from now on be evaluating the activities of companies in Myanmar on a par with activities in other areas, with a special emphasis on companies’ contributions to any human rights violations in connection with major infrastructure developments. The Council also wrote that it is no longer appropriate to recommend exclusion of companies solely on the basis of contract conclusion in connection with such projects.
The Council on Ethics contacts companies at a relatively early stage in its examination of cases. Companies are requested to answer questions or to send specific documents to the Council. In 2012, the Council on Ethics contacted more than 60 companies. From time to time, companies request a meeting with the Council. In 2012, the Council met with nine companies. The Council on Ethics attaches weight to obtaining information directly from companies, but also issues recommendations on companies that fail to respond to communications from the Council.
A total of 17 companies are excluded from the GPFG under these criteria. Two of the companies are excluded on the basis of contributions to serious or systematic human rights violations, ten companies are excluded because they are deemed to cause severe environmental damage, two companies are excluded on the basis of other particularly serious violations of fundamental ethical norms, and three are excluded on the basis of serious violations of individuals’ rights in situations of war or conflict.
Observation
One company is under observation pursuant to the gross corruption criterion. During the observation period, the Council on Ethics is monitoring, inter alia, how the company is developing its systems to prevent corruption, how the company is handling the investigation of past corruption incidents, and whether any new instances of corruption are alleged. The Ministry has also decided to place a company under confidential observation under the criterion serious violations of individuals’ rights in situations of war or conflict. Confidential observation may be used if merited by special considerations, cf. section 3, second paragraph, of the observation and exclusion guidelines. The decision will in such a case only be disclosed to Norges Bank and the Council on Ethics. Section 4.6.2 of Report No. 10 (2009-2010) to the Storting described the scope for confidential observation:
“In the Ministry’s view, disclosure should be the general rule. In some cases there may, however, be specific factors that indicate that an observation decision should not be made public, although there may be good reasons for following up a company more closely. There may be cases where disclosure of observation could be counterproductive if, for example, the company is in the process of making changes for the better at the initiative of other actors. To ensure that the application of the new guidelines is transparent, such decisions should be reported in the annual report to the Storting on the management of the Fund, possibly in anonymous form.”
The Council on Ethics informs the Ministry on an annual basis about the status of the companies placed under observation. The Council will make a new recommendation on these companies after the observation period has been completed.
4.4.5 The Strategy Council for the GPFG
The Ministry aims for the management of the Government Pension Fund to adhere to best practice for responsible investment. The Ministry of Finance has for many years been using external advisors to assist in developing the management of the Fund and strengthening the underpinnings of the long-term investment strategy. The Strategy Council for the GPFG has played an important role in this.
The Strategy Council shall, through independent and critical evaluations, provide advice on developing the investment strategy. This shall contribute to increased transparency and professional debate about important choices relating to the investment strategy for the Fund. In 2010, the Strategy Council for the GPFG issued a report on how best to exploit the special properties of the Fund, and in 2011 the Council hosted an international seminar on issues of importance to developing the investment strategy for the GPFG, cf. Report No. 15 (2010-2011) to the Storting and Report No. 17 (2011-2012) to the Storting.
For 2013, the Ministry has instructed the Strategy Council to prepare a report on the overall responsible investment strategy for the GPFG. It is almost a decade since the introduction of ethical guidelines for the management of the GPFG. This has resulted in the accumulation of important responsible investment experience. Valuable expertise has been developed by the Council on Ethics, Norges Bank and the Ministry of Finance. Responsible investment is, at the same time, undergoing continuous change, and it is therefore appropriate for the strategy to be developed in line with this. The Strategy Council will in 2013 be providing important input for developing the strategy.
The Council for 2013 has five members. Elroy Dimson (London Business School and Cambridge Judge Business School) chairs the Council and has extensive experience from the Strategy Council. Elroy Dimson is Professor of Finance, and his areas of research include, inter alia, responsible investment. Other members are Idar Kreutzer (Chief Executive Officer of Finance Norway), Rob Lake (Head of Responsible Investment at PRI), Hege Sjo (Hermes Fund Management) and Laura Starks (Professor of Finance at the University of Texas). The Council will also consult other responsible investment experts.
There has recently been an increased international focus on integrating corporate governance, environmental and social considerations in investment activities. This is also required under the mandate for the GPFG. The Strategy Council shall in its reporting draw on responsible investment experience and comparisons with other funds, cf. box 4.4. The Council shall examine how one may eliminate any deviations from international best practice.
Textbox 4.4 Mandate for the Strategy Council 2013
The purpose of the Government Pension Fund Global (GPFG) is to facilitate government savings to finance rising public pension expenditures, and support long-term considerations in the spending of government petroleum revenues. The investment objective is to maximise the purchasing power of the fund capital, given a moderate level of risk. In this way, we aim to ensure that both present and future generations can benefit from our common national savings.
The objective of good financial return is closely linked to the ambition to be a responsible investor. The Fund’s role as a responsible investor is expressed, for example, in the Guidelines for Observation and Exclusion of companies which do not comply with minimum ethical standards. The Council on Ethics for the GPFG advises the Ministry on the observation and exclusion of companies based on these guidelines. Norges Bank manages the Fund’s ownership interests and is mandated to integrate considerations of good corporate governance and environmental and social issues in investment activities in line with internationally recognised principles for responsible investment (RI), whilst bearing the purpose of the Fund in mind.
Currently, the GPFG’s strategy for responsible investment comprises the following elements:
International cooperation and contribution to the development of best practices
Environmental related investment mandates
Research and analysis
Exercise of ownership rights
Observation and exclusion of companies
Both the Ministry of Finance and Norges Bank, in their respective capacities as owner and manager of the Fund, participate in international forums in which best practice RI is discussed and developed.
Purpose of the Strategy Council 2013
The purpose of the Strategy Council is to contribute in strengthening both the legitimacy and foundation of the long-term investment strategy of the GPFG. Through independent and critical reviews, the Council shall give advice on how to develop the strategy further, increase transparency and encourage debate on important decisions related to the management of the Fund. The Council should assess how gaps to international best practices for RI may be closed, so that the Fund actively contributes to the development of good international standards in the area of RI and active ownership.
Measures/basis for assessment
The Council members shall prepare a public report and give a presentation of the report. The main focus of the report shall be on the overarching strategy for RI, building on the experience of the work so far and comparisons with other funds. The report shall not give an evaluation of Norges Bank’s operational management of the GPFG or the Council on Ethics’ recommendations on observations and exclusions.
The report of the Graver Committee discussed the issue of consistency between Norwegian policy in different areas and the ethical guidelines of the Fund. Experience shows that this issue is still relevant. These experiences should be part of the basis for the Strategy Council’s assessment.
Priorities for the 2013 report
The report should review and comment on the overarching objective for the GPFG’s RI-strategy and compare this with comparable objectives expressed by comparable funds.
The report should discuss current best practices for RI amongst other funds and compare the findings with the GPFG’s strategy for RI.
The report should discuss the role the Fund’s contributions to research, analysis and international initiatives can play in development of best practice. The development of reporting standards that encompass ESG-issues should be included in the discussion.
The assessments in the report should cover both the fixed income and equity portfolio of the GPFG.
The report should consider how the collective resources and expertise in the Ministry of Finance, the Council on Ethics and Norges Bank can best be utilised to strengthen the work on RI further.
The report should assess operational risks in the current setup, and may propose measures to reduce those risks.
The report may propose changes to strengthen the work on RI, including operational and institutional changes.
The report should be presented no later than end of October 2013.
The Ministry is committed to identifying potential weaknesses in the current responsible investment system for the GPFG, with a view to further improvement. The responsible investment guidelines emphasise the scope of the Fund, as an investor, to contribute to positive change, in markets, sectors as well as individual companies. It is also expressly stated that the available tools shall be coordinated in the best possible manner to exercise such influence.
The Ministry of Finance has requested the Strategy Council to examine how the overall resources and expertise can best be utilised to strengthen the responsible investment practice. The Strategy Council may propose changes it believes would strengthen this practice, including operational and institutional changes.
The report shall not evaluate Norges Bank’s operational management of the Fund or the observation and exclusion recommendations rendered by the Council on Ethics.
The Strategy Council will submit its report in the autumn. Any changes to the responsible investment strategy proposed by the Council will, in line with ordinary practice, be subject to open discussion.
4.4.6 The resource situation of the Council on Ethics
In connection with the Storting’s deliberation of Report No. 17 (2011-2012) to the Storting, a majority of the Standing Committee on Finance and Economic Affairs wrote the following in Recommendation No. 361 (2011–2012) to the Storting:
“The majority notes that the evaluation in 2009 emphasised improved coordination between the tools at the disposal of the Council on Ethics and Norges Bank, respectively, and that the new guidelines from 2010 encourage this. This imposes strict demands on the Council on Ethics and Norges Bank. The majority requests the Government to consider whether the resource situation of the Council is compatible with the expansion of its duties in connection with the restructuring of responsible investment and the expansion of the fund capital.”
The Council on Ethics has five members. In addition, the Council has a secretariat. The number of secretariat employees has increased from five to eight since its establishment in 2004. The Council on Ethics uses consultancy firms, researchers and NGOs to document the activities of companies. The Council on Ethics has since 2009 had a framework agreement with a consultancy firm that assists in the specific assessment of companies. In addition, the Council uses, inter alia, an external consultancy firm to conduct internet searches for news items on all the companies in the portfolio in order to identify companies whose activities may violate the guidelines, cf. the discussion in section 4.4.4.
The Council on Ethics works systematically and effectively with its area of responsibility. The Council makes recommendations on a regular basis and has evaluated businesses under all of the exclusion criteria in the observation and exclusion guidelines. The Council has examined many more companies than those it has issued recommendations on. The Council on Ethics states, in its annual report for 2012, that it looked into 230 companies over the course of the year.
The Ministry is of the view that the expanded size of the Fund does not directly increase the resource needs of the Council on Ethics. The Council shall evaluate the activities of companies, and the number of companies in the portfolio does not increase with the size of such portfolio.
The number of companies in the portfolio has, on the contrary, been reduced in recent years, from just below 8,500 at yearend 2010 to about 7,400 at yearend 2012. However, the ratio between the budget of the Council on Ethics and the number of companies in the portfolio is in any case not a good indicator as to whether the resource situation is satisfactory. Although many companies are included in the Fund portfolio, the Council on Ethics is not required to have detailed knowledge of a large number of companies. It should be recalled that the conduct of the companies in the Fund portfolio is monitored or checked by a number of different mechanisms. Firstly, companies are governed by national and international laws. Many companies have also signed up to voluntary principles or guidelines.16 Stock exchange listings bring additional responsibilities. Internally, management is supervised by the board of directors and the general meeting. External and internal auditors also perform important controls. Finally, a large number of so-called external stakeholders, like consumer groups and other special interest organisations, closely monitor the activities of many companies. An assessment of the resource needs of the Council on Ethics must recall that the Council on Ethics is intended to identify cases where the monitoring and compliance mechanisms outlined above are insufficient.
The budgets of the Council on Ethics are subject to continuous evaluation. The Ministry notes that the Strategy Council, cf. the discussion in section 4.4.5, is, inter alia, charged with reviewing how the joint resources and expertise of the Ministry of Finance, the Council on Ethics and Norges Bank can best be utilised to strengthen the Fund’s responsible investment practice. The Ministry is of the view that it is appropriate to await the outcome of such review before addressing the resource situation of the Council on Ethics in more detail.
5 Development of the management framework of the Government Pension Fund
5.1 Introduction
The Government Pension Fund Act makes the Ministry of Finance responsible for the management of the Government Pension Fund. The Fund is comprised of two parts; the Government Pension Fund Global (GPFG) and the Government Pension Fund Norway (GPFN). Operational management of the two parts of the Fund is carried out by Norges Bank and Folketrygdfondet, respectively. Asset management is governed by separate mandates adopted by the Ministry. The mandates include provisions on investment limits, responsible investment, risk management and reporting. The Ministry’s regulation of the management of the Government Pension Fund stipulates general principles and limits, in the expectation that more detailed internal rules will be laid down by Norges Bank and Folketrygdfondet.
The management framework for the Government Pension Fund is premised on a clear division of roles and responsibilities, both between the owner and the manager, and between the various bodies that supervise and monitor the Fund. This framework is discussed in several reports to the Storting on the management of the Government Pension Fund; cf. Report No. 10 (2009-2010) to the Storting – The Management of the Government Pension Fund in 2009, Report No. 15 (2010-2011) to the Storting – The Management of the Government Pension Fund in 2010 and Report No. 17 (2011-2012) to the Storting – The Management of the Government Pension Fund in 2011. The management framework for the Government Pension Fund enjoys broad support in the Storting, cf. Recommendation No. 277 (2008–2009) to the Storting, Recommendation No. 373 (2009–2010) to the Storting, Recommendation No. 138 (2010–2011) to the Storting, Recommendation No. 246 (2010–2011) to the Storting and Recommendation No. 361 (2011–2012) to the Storting.
The Ministry is continuously developing the management framework for the Government Pension Fund. It seeks to ensure that the framework is well aligned with the investment strategy, whilst the governance structure and regulations are consistent with international best practice.
The entire management framework for the Government Pension Fund is available on the Ministry website (www.government.no/gpf). Supplementary management provisions adopted by the Executive Board of Norges Bank and the Board of Directors of Folketrygdfondet are available on the respective websites of the asset managers (www.nbim.no/en and www.ftf.no).
Section 5.2 discusses certain changes to the mandate for the management of the GPFG. The changes entered into effect on 1 January 2013.
5.2 Changes to the mandate for the GPFG
The Ministry adopted real estate investment guidelines on 1 March 2010, cf. Report No. 10 (2009-2010) to the Storting. The guidelines imply that Norges Bank shall over time invest up to 5 percent of the fund assets in a separate real estate portfolio. The fixed income portion shall be reduced correspondingly. As outlined in Report No. 10 (2009-2010) to the Storting, establishing a real estate portfolio that represents 5 percent of the fund assets is expected to take several years.
With effect from 1 January 2013, the Ministry of Finance has specified in the mandate for the GPFG that the real estate portfolio can be invested globally. Until the end of last year, the investments were concentrated in Europe, because the effect of real estate investments outside Europe, and especially in the US, on the tax costs of the Fund has been uncertain, cf. letter of 12 October 2009 from Norges Bank.
This constraint was discussed in Report No. 15 (2010-2011) to the Storting. It was there noted that the Ministry and Norges Bank were in the process of clarifying tax and legal issues in Asia, Oceania and the Americas. It was also noted that the Ministry was aiming to expand distribution across countries as and when it was deemed appropriate to include new markets.
Norges Bank writes, in a letter of 2 October 2012 to the Ministry of Finance, that the tax uncertainty has been sufficiently reduced to merit global real estate portfolio investments.
In the US, it is the intention of Norges Bank that investments will be made in unlisted Real Estate Investment Trusts (REITs), with US partners holding more than 50 percent. The proposed investment format falls within the scope of the mandate and is very similar to the investment formats used in Europe thus far. New real estate investments will be conditional upon Norges Bank performing a thorough investment evaluation of, inter alia, tax risk, cf. the mandate for the GPFG.
As with the real estate investments in Europe, the Bank intends to incorporate subsidiaries when making investments in new countries. Such subsidiaries contribute to limiting and clarifying risk and liability. Limiting financial risk is important for all investment types. The incorporation of real estate investment subsidiaries limits financial liability to the assets of the subsidiary. The company structures selected by Norges Bank for the real estate investments in Europe were discussed in Report No. 17 (2011-2012) to the Storting.
As far as the US investments are concerned, the Bank intends to incorporate subsidiaries in the US state of Delaware. Almost half of all listed companies in the US have part of their corporate structure in Delaware. Like Luxembourg, where the Bank has also incorporated subsidiaries, Delaware is deemed to offer a good and predictable legal framework for commercial activities.
The mandate given to Norges Bank restricts where real estate companies and fund structures in the real estate portfolio can be established. Unlisted companies and fund structures shall be established in countries with which Norway has concluded tax treaties or other countries from which Norway may demand tax information pursuant to other agreements under international law. The US meets these requirements.
The agreements and corporate documents established by the Bank ensure the necessary access to information about the subsidiaries for the internal audit unit of the Bank, which is a supervisory body reporting to the Executive Board, for the external auditor of the Bank, and for the Supervisory Council, which is a Norges Bank supervisory body reporting to the Storting, cf. the discussion in section 4.3.1.
Some other adjustments have also been made to the mandate for the GPFG as a result of the expansion into global real estate investments. It is specified, inter alia, that the return target for the real estate portfolio that serves as a benchmark for the return achieved by Norges Bank has been changed to a global real estate index from IPD. Moreover, the limits on investment in countries, sectors, etc., have been changed such as to delegate to Norges Bank the stipulation of limits curtailing risk in the real estate portfolio. These risk limits are required to be submitted to the Ministry before entering into effect, as is the case with those applicable to the GPFG equity and fixed income portfolios.
Norges Bank has, as a result of the mandate changes, stipulated new supplementary risk limits in the Executive Board’s investment mandate for the head of NBIM with effect from 1 January 2013. These changes have, in accordance with the mandate for the GPFG, been submitted to the Ministry, which has taken note of these.17 Some of these modified limits are discussed below.
Supplementary risk limits stipulated by Norges Bank
Norges Bank has stipulated limits on the real estate portfolio investments in countries and sectors as percentages of the strategic real estate allocation of up to 5 percent.
Investments in individual countries are, as a main rule, limited to 10 percent of the strategic real estate allocation. Hence, investments in one single country can represent up to 0.5 percent of fund assets. For the US, the UK, France and Germany, the limit is 35 percent. Hence, up to 1.75 percent of fund value can be invested in each of these countries.
The Bank has capped overall real estate portfolio investments in emerging markets at 10 percent of the strategic real estate allocation of up to 5 percent.
The sector limits cap investments in office and retail properties at 60 percent of the strategic real estate allocation each, whilst investments in the other sectors cannot exceed 30 percent.
The Bank will examine various aspects of real estate investment risk prior to making new investments in all markets.
Norges Bank has stipulated that investments in fixed income instruments and listed equity instruments shall each account for a maximum of 25 percent of the strategic real estate allocation of up to 5 percent. This limit has previously been defined as a portion of the size of the real estate portfolio at any given time.
The Bank has stated that these changes will ensure sufficient flexibility in the establishment of a global real estate portfolio.