Part 2
Topic articles
6 Systematic risk factors in the stock market
6.1 Introduction
Financial theory describes how investors should compose their portfolios when future returns are uncertain. The so-called Capital Asset Pricing Model shows that investors achieve the best ratio between return and risk by combining a risk-free investment with a market value weighted portfolio of all risky assets. Market value weights in an equity portfolio means that each stock is included in the portfolio with a weight corresponding to the stock’s portion of the overall market value of all risky investments. The Capital Asset Pricing Model has been highly influential. Most investors are currently using market value weights as the basis for their stock market investments. Indices based on market value weights also offer practical advantages inasmuch as they are cost effective, transparent and describe the investment opportunities in the stock market in a good and objective manner.
The Capital Asset Pricing Model is based on a number of assumptions, and empirical research shows that the model does not provide a fully adequate description of financial markets. Studies find, inter alia, a number of systematic equity return patterns. Such patterns mean that equity portfolios deviating from a market value weighted index have enjoyed higher historical returns. This chapter describes five such patterns: value, size, momentum, liquidity and low volatility. See table 2.1 in chapter 2 of the present report for a definition of the factors.
Various explanations exist as to why the patterns have generated excess returns over time. Risk-based explanations hold that the excess return compensates for various forms of risk. Another view is that the patterns reflect irrational behaviour on the part of some investors. Normally, rational investors ensure that stock prices are corrected for the behaviour of irrational investors. However, behavioural explanations suggest that irrational conduct may at times create stock price trends and overreactions. Rational investors investing against such trends will then risk major losses. Such losses might lead to an asset manager losing customers and market shares. Rational investors may therefore be cautious about investing contrary to such irrational trends and overreactions. In the short run it may even be rational to follow the trend.
Figure 6.1 shows accumulated returns from the patterns value, size and momentum. The return from size reflects the difference in risk-adjusted returns between the group of stocks with the lowest market value and the group comprising the stocks with the highest market value. Hence, returns are not dependent on stock market appreciation, but on return differences between these two groups. Corresponding principles are used in calculating the other patterns.
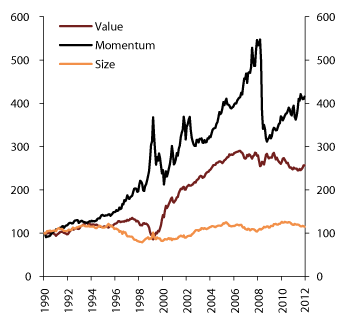
Figure 6.1 Accumulated returns from size, value and momentum. Index
Source Kenneth French’s website.
All of the systematic patterns in table 2.1 have generated positive returns over time. The possibility that the patterns are random cannot be entirely discounted. However, most of the patterns were uncovered more than twenty years ago and have continued to apply since. The patterns have also been identified in a number of other markets in addition to those in which they were first identified.
6.2 Risk-based explanations
A key insight from financial theory is that equity investment risk can be reduced by diversifying investments across a number of stocks. Risk that cannot be eliminated through such diversification of risk is termed systematic risk. Fluctuations in business cycles, in inflation or in stock market liquidity may be sources of systematic risk.
Risk-based explanations assume that investors prefer securities offering low systematic risk. The value of such securities is less sensitive to recessions, and their attendant unemployment and uncertainty about future income. For securities characterised by negative returns during such periods, like many stocks, investors will require compensation in the form of a higher expected return. Expected return differences between stocks can therefore be explained by how systematic risk influences equity values.
One challenge for empirical research has been to identify variables that are good at capturing how stocks are affected by systematic risk. The Capital Asset Pricing Model shows that investors will wish to achieve the maximum possible diversification of risk and that they will diversify their investments over all stocks in the stock market. A market value weighted equity portfolio based on the entire stock market will, under certain assumptions, give the best ratio between return and risk. Since investors cannot further improve the ratio between return and risk, fluctuations in the market portfolio will reflect the systematic risk. Hence, investors will require higher expected returns from stocks that decline steeply in value when the entire stock market falls (high market beta stocks), than from stocks that are less sensitive to such falls.
Other theoretical models allow for the possibility that other factors beside market beta may explain expected return differences between stocks. The models do not provide a clear answer as to what those factors are, but macroeconomic variables that affect the entire stock market have been suggested as potential candidates. Expected return differences between stocks can in such case be explained by how equity prices are influenced by such macroeconomic variables.
Empirical studies indicate that market beta does not provide a fully adequate explanation of stock returns. Nor does analysis of US data provide much support for the suggestion that the sensitivity of stocks to changes in macroeconomic variables may explain return differences between stocks. One possible explanation may be that it is difficult to find data that capture variations in fundamental economic variables in a precise manner. Another explanation may be that the stock market is a leading indicator of macroeconomic developments, rather than the opposite.
Furthermore, it is reasonable to expect companies’ risk and their ability to withstand various macroeconomic conditions to also be influenced by their market position, profitability, funding structure, ownership and refinancing needs. Empirical research has documented a number of relationships between company characteristics and returns. However, the size and value effects have exhibited particular empirical robustness.
The size effect shows that stocks with a small market capitalization have had a higher risk-adjusted return than stocks with large market capitalization. Correspondingly, the value effect shows that companies with low market value relative to their book value of equity have had a higher risk-adjusted return than companies with a high market value relative to their book value of equity. Fama and French (1993) showed that an empirical model including these two variables as factors alongside market beta explains much more of the return differences between stocks than the Capital Asset Pricing Model. Fama and French concluded that size and valuation are good indicators of how exposed stocks are to systematic risk.
Risk-based explanations of the size and value effects are that these companies are often more vulnerable to recessions. It is noted that such companies are often less profitable and less productive, and that the cash flow from their activities is more sensitive to business cycle fluctuations. These companies may therefore involve more bankruptcy risk than other companies. Other explanations may be that value companies find it difficult to cut production capacity in recessions. These companies may also hold assets that are less liquid. Such circumstances may make value companies more vulnerable to recessions.
Despite extensive empirical research on the size and value effects, it still remains uncertain what type of risk these have compensated for. The return from the size effect has also been low for extended periods. A combination of the two factors, i.e. value companies with low market value, has offered the highest return historically.
Parts of the size and value effects are likely to be related to such stocks often being less liquid than the general stock market. Amihud (2002) shows that stocks with a small market capitalization were especially well compensated for low liquidity in the form of higher returns. Several studies have shown that investors are compensated with higher expected returns for holding stocks with low liquidity and uncertain transaction costs. The sensitivity of stocks to fluctuations in the liquidity of all stocks in the equity market may also explain return differences between stocks. However, empirical research on the US stock market may suggest that liquidity premiums have declined markedly in recent years.
6.3 Explanations not based on risk
Jegadeesh and Titman (1993) showed that purchasing the stocks with the highest return over the last 12 months (“winners”), whilst at the same time selling the stocks with the lowest return (“losers”), has historically delivered high returns. Such trading strategy is called momentum, and has historically delivered high returns in many stock markets. De Bondt and Thaler (1985) have previously identified an opposite effect in the longer run: The stocks with the highest return over the last three years thereafter systematically underperformed the stocks with the lowest return.
Such patterns pose the question of whether the stock market is efficient. In efficient markets, rational investors will ensure that stock prices reflect all available information. It should therefore not be possible to profit from trading strategies based on historical stock price patterns. The momentum effect suggests that this has nevertheless been possible. This raises the question of whether irrational investor behaviour can also influence stock prices.
Behavioural explanations raise two issues. Firstly, one needs to explain why the patterns arise. Secondly, one needs to understand why they persist over time. If the patterns do not reflect risk, rational investors ought to exploit them. Rational investors would have traded stocks until stock prices had changed such as to offer no positive expected return from the patterns.
Behavioural explanations are based on psychological studies showing that decisions are often made on the basis of other factors apart from rational return and risk assessments. People tend, for example, to miscalculate probabilities, to take time to change their opinions and to become too self-confident about their own ability to make good decisions. Behavioural explanations show how such tendencies by investors may give rise to patterns like momentum and value.
The momentum effect may arise through the establishment of trends in stock prices. There are several behavioural explanations for the establishment of such trends and many of these are based on the assumption that investors are drawn to stocks that increase in value.
Hong and Stein (1999) argue that it may take time for new information to be disseminated in the stock market. A stock price increase may therefore be interpreted as a signal that good news is in the pipeline, thus generating investor interest in the stock. Investors purchase the stock in the expectation that the news will spread further and generate more interest from investors.
Trends may also arise when investors react asymmetrically to good and bad news. Daniel et.al (1998) argues that good news reinforce investors’ believes in their analyses of the company, thus triggering additional purchases of the stock. Bad news are more likely to be interpreted as coincidental, and do not result in corresponding divestment of the stock. Stock prices will therefore keep rising as long as investors are becoming more self-confident and are purchasing additional stocks on good news.
There may also be trends in how analysts adjust their expected corporate earnings estimates. There is a tendency for companies whose estimates have been adjusted upwards for the last 12 months to keep on being adjusted upwards. The opposite applies to companies whose expected earnings have been adjusted downwards. Such estimate patterns should be reflected in the stock price to begin with. Changes to the estimates will in such case be as expected and not result in stock price changes. Chen et.al (2009) and Ghayur et.al (2010) show that such is not the case and that stock prices increase more gradually, in step with the estimate adjustments. Hence, the momentum effect will reflect trends in analysts’ estimates. Investors purchase stocks whose estimates are adjusted upwards and sell stocks whose estimates are adjusted downwards.
The value premium is often explained by reference to stock prices having overreacted relative to long-term corporate values. The momentum effect offers a possible explanation of why this might happen. Studies also show that investors tend to attach more weight to historical trends than is justified. Investors will thus be paying too much for companies with high historical growth and too little for companies with low historical growth. The value premium arises because expensive growth companies generate lower returns over time than do inexpensive value companies.
Behavioural explanations of why the patterns have persisted over time are based on the premise that it may be both costly and risky for more rational investors to exploit the patterns.
One suggested explanation is that rational investors are often investing on behalf of customers and are obliged to deliver competitive returns. Despite patterns like value, size and momentum having delivered higher returns over time, they may at times deliver major losses, of which may continue for several years. Asset managers thus run the risk of customers withdrawing their capital. Loss of customers and market shares carries a high cost for asset managers. In addition, asset managers that leverage their equity investments, like for example hedge funds, will in addition have to back up their positions with more collateral when losses are incurred, and may risk recall of their debt.
The framework under which institutional investors operate is also highlighted as an explanation of the volatility factor. One would normally expect stock returns over time to reflect risk. The volatility factor shows that such has not been the case, especially for high-risk stocks. Historically, the ratio between return and risk has been higher for low-risk stocks than for high-risk stocks.
It is difficult to explain the volatility factor by risk-based models because investors can themselves change the risk level of individual stocks by leveraging their equity investments. One possible explanation of the volatility premium is that many portfolio managers or investors are in practice cut off from leveraging their equity investments. One way of increasing the expected return would then be to sell low-risk stocks and purchase high-risk stocks. When risk tolerance increases and the stock market appreciates, such tilting may deliver higher returns. The volatility factor may be explained by a large portion of investors thus tilting their equity investments, thereby influencing stock prices. Higher prices for high-risk stocks gives lower expected returns, whilst the opposite is the case for low-risk stocks.
It may also be that transaction costs are so high that it is not profitable for large investors to exploit the patterns. The patterns therefore exist only “on paper”. Empirical studies show that the patterns offer the highest return on stocks with low market value and low ownership stakes amongst institutional investors. Such stocks often involve high transaction costs; both commissions and fees, but also price changes caused by the sale and purchase of stocks. Korajczyk and Sadka (2004) and Lesmond et.al (2004) argue that momentum strategies are not profitable for investments in excess of USD 5 billion. Estimating transaction costs is, however, challenging. Costs change over time and alternative methods may be used to reduce them.
6.4 Summary
There is, despite extensive research, no agreement as to what explains documented historical stock return patterns. Both risk-based and behavioural explanations have been proposed. Risk-based explanations seem more relevant for some patterns, such as value and size, than for other patterns, such as momentum and low volatility. However, it is generally striking how difficult it is to identify what types of risk investors require compensation for. If the patterns represent compensation for risk, it ought to be fairly straightforward to determine the actual nature of such risk.
Behavioural explanations provide useful insight into how irrational behaviour may give rise to systematic stock price patterns, but the theoretical basis seems fragmented. If investors have irrational properties, each of the irrational properties ought to be reflected in all parts of the financial markets, and not in one single market only.
Many of the patterns have been known for more than 20 years. If the patterns do not reflect risk, they ought to have attracted additional capital until the positive return had been eliminated. The fact that the patterns remain in existence may indicate that exploiting the patterns is challenging or involves some form of risk.
6.5 References
Amihud, Y. (2002). Asset pricing with liquidity risk. Journal of Financial Economics, 77, 375-410.
Chen, L., Moise, C., Zhao, X. (2009). Myopic extrapolation, price momentum, and price reversal. Working paper, Washington University.
Daniel, K., Hirshleifer, D., Subrahmanyam, A. (1998). Investor psychology and security market under- and overreaction. Journal of Finance, 53, 1839-1885.
De Bondt, W., & Thaler, R. (1985). Does the stock market overreact? Journal of Finance, 40, 793-805.
Fama, E., & French, K. (1993). Common risk factors in the returns on stocks and bonds. Journal of Financial Economics, 33, 3-56.
Ghayur, K., Heaney, R.G., Komon, S.A., Platt, S.C. (2010). Active Beta Indexes, Wiley.
Hong, H., & Stein, J.C. (1999). A unified theory of underreaction, momentum trading, and overreaction in asset markets. Journal of Finance, 54, 2143-2184.
Jegadeesh, N., & Titman, S. (1993). Returns to buying winners and selling losers: implication for stock market efficiency. Journal of Finance, 48, 65-91.
Korajczyk, R., & Sadka, R. (2004). Are momentum profits robust to trading cost? Journal of Finance, 47, 427-465.
Lesmond, D. A., Schill, M, Zhou, C., (2004). The illusory nature of momentum profits. Journal of Financial Economics, 71, 349-380.
7 Listed real estate companies
7.1 Introduction
As described in section 2.4, equity investments in listed real estate companies are included in the investment universe of both the equity portfolio and the real estate portfolio of the GPFG. At yearend 2012, only the equity portfolio held investments in listed real estate companies.
Real estate companies accounted for a total of 3.5 percent of the equity benchmark index in January 2013. So-called Real Estate Investment Trusts (REITs) constitute the largest group of real estate companies; about 2 percent of the equity benchmark index. These corperations invest in, and manage, real estate or real estate mortgages. What distinguishes REITs from other limited liability companies is that they do not pay corporate tax on any income distributed to their shareholders, as long as they comply with certain requirements.
Ongoing return data for unlisted real estate are of limited quality. Section 2.4 noted a close correlation between returns and risks for listed REITs and for unlisted real estate in the long run. Hence, analyses of listed REITs may provide useful insight into the long-term return properties of both listed and unlisted real estate.
7.2 The REIT market
The first REIT legislation was enacted in the US in 1960. The US REIT market underwent particularly strong growth from the 1990s, after legislative amendments permitted REITs to engage in active investment activities and involve more institutional ownership.1
After the US, the first countries to introduce REIT legislation were the Netherlands and Australia in 1969 and 1971, respectively. In Asia, similar schemes were introduced in the early 2000s, in the wake of the Asian financial crisis. Many European countries, like the UK, Germany and Spain, have introduced REIT structures quite recently. A total of 34 countries have now enacted variants of the US REIT legislation.2
The current legislation in all countries requires a REIT to hold most of its assets in, and derive most of its income from, real estate. Another requirement is that most of its earnings shall be distributed as dividends to its shareholders each year. Consequently, REITs have limited prospects for growing through retained earnings. There are also limitations as to how concentrated the ownership structure can be.3
The main REIT markets are the US, Canada, the UK, the Netherlands, France, Australia, New Zealand, Japan, Hong Kong and Singapore. Figure 7.1 shows developments in the market value of listed REITs in the regions of North America, Europe, Asia and Oceania in the period from 1990 to 2012. The markets grew strongly until 2006, especially in North America and Asia. Following the slump in values in connection with the financial crisis, recent years have seen renewed market growth. At yearend 2012, the value of the North American market was about USD 500 billion, up from about USD 400 billion at yearend 2006. In Asia and Europe, market values at yearend 2012 still remained somewhat below those of six years earlier.
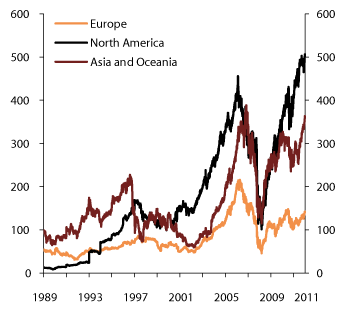
Figure 7.1 Market value of listed REITs in North America, Europe, Asia and Oceania. 31 December 1989–31 December 2012. USD billion
Source FTSE EPRA/NARET Developed market REIT Indexes.
The REIT markets are small when measured as a portion of the overall stock market. Norges Bank states, in a letter of 14 March 2013 to the Ministry of Finance, that the portion of the stock market accounted for by REITs in Asia, North America, as well as Europe, Middle East and Africa was 2.6 percent, 3.4 percent and 1.0 percent, respectively, as at 25 January 2013.
7.3 The return and risk properties of REITs
The US has the most developed REIT market. This market represents about 45 percent of the global REIT market, and provides a good basis for assessing the return and risk properties of this type of real estate corporation.
Figure 7.2 shows that an index comprising about 130 listed REITs4 has delivered a higher return than the overall stock market in the US over the period 1990–2012. This holds true both when compared to the S&P 500, which is a broad index comprising large listed companies, and the Russell 2000, which is a broad index comprising small listed companies. The return on REITs traced the general stock market in the early 1990s. The return on REITs only suffered a limited impact from the 2000–2002 stock market slump, which hit large companies in the telecommunications, media and information technology sectors particularly hard. Over the period 2002–2012, REITs delivered much higher returns than the stock market, but volatility was also higher. The period until the financial crisis in 2008 was characterised by a marked decline in interest rates and it was easy to leverage real estate investments. At the same time, the US economy grew healthily. This laid the foundations for a steep increase in real estate prises and REIT stock prices. However, when the credit markets tightened during the financial crisis, the sector contracted much more than did the general stock market.
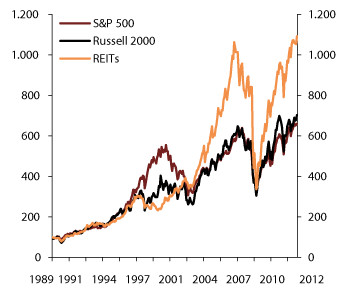
Figure 7.2 Total return on REITs, Russell 2000 and S&P 500. United States. Index. 31 December 1989 = 100
Source www.nareit.com and Thomson Reuters Datastream.
Historically, REITs have been more leveraged than the average limited liability company. At yearend 2012, the average debt-equity ratio, measured as the ratio between debt and enterprise value, was 35 percent for REITs, whilst the corresponding debt-equity ratio was 19 percent for companies in the S&P 500 index. This higher debt-equity ratio of REITs is commonly explained by rent income being stable and fixed for a number of years through leases, in addition to the fact that buildings and land are tangible assets well suited to serve as collateral for loans. However, unlike other companies, REITs obtain no tax benefits from leveraging.
Compared to manufacturing companies, REITs in the US have had less liquidity, smaller size and lower market value relative to book value.5 A number of empirical studies show that stocks with such properties have historically delivered higher risk-adjusted returns than suggested by financial theory.
Figure 7.3 shows total return developments for REITs over the period 1990–2012, compared to the return on a broad index of small value companies, Russell 2000 Value. Russell 2000 Value comprises about half of the 2,000 companies in the Russell 2000 index. The return and risk properties of REITs have been very similar to this index over that period. One explanation is that the companies included in the Russel 2000 Value index have some of the same properties as REITs.6

Figure 7.3 Total return on REITs and Russell 2000 Value. United States. Index. 31 December 1989 = 100
Source www.nareit.com and Thomson Reuters Datastream.
In a letter of 14 March 2013, Norges Bank has analysed the return on listed real estate stocks by using factor models. The analysis of US data for the period from 2002 until and including December 2012 shows that, in addition to stock market returns, factors for value and size are important in explaining real estate return variations. In total, these three factors explain a major part; 68 percent, of US real estate stock return variations. The Bank’s analysis of global real estate stocks conveys a similar impression. At the same time, the analyses show that the correlation between real estate stock returns and the three factors has not been stable over time.
REITs also differ from other US companies inasmuch as they are obliged to distribute 90 percent of their earnings to shareholders. Historically, dividends have accounted for a larger portion of returns on REITs than have price increases. Figure 7.4 shows that the ratio between dividend payments and the market value of REITs declined steeply from 1990 and until yearend 2012. Hence, investors have received lower dividends for each dollar invested in REITs. Real estate value developments and lease developments will be important drivers behind future returns on REITs.
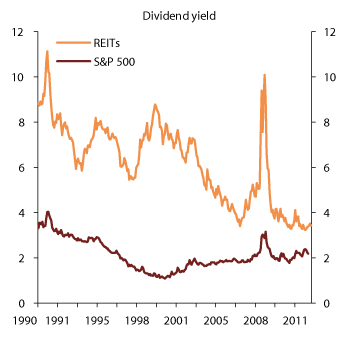
Figure 7.4 Ratio between dividends and market value for REITs and S&P 500. United States. 1990–2012
Source www.nareit.com and Thomson Reuters Datastream.
Table 7.1 shows that the average ratio between return and risk, as measured by the Sharpe ratio, was better for REITs than for broad indices of large companies (S&P 500) and small companies (Russell 2000) over the period 1990–2012. However investments in REITs have not offered a better ratio between return and risk than have investments in small value companies (Russell 2000 Value).
Table 7.1 Annual return and risk for REITs, S&P 500, Russell 2000 and Russell 2000 Value. United States. 1990–2012
REITs | S&P 500 | Russell 2000 | Russell 2000 Value | |
|---|---|---|---|---|
Return (percent) | 12.4 | 9.4 | 10.5 | 11.6 |
Standard deviation (percent) | 19.3 | 15.0 | 19.6 | 17.4 |
Sharpe ratio | 0.47 | 0.40 | 0.36 | 0.47 |
Maximum drawdown (percent) | -68 | -51 | -53 | -55 |
Source www.nareit.com and Thomson Reuters Datastream.
REIT investment returns and risks have varied considerably over time, which means that averages should be interpreted with caution. The potentially high risk of REIT investments is also illustrated by the 68-percent decline in the index from January 2007 to February 2009, whilst the overall stock market contracted significantly less.
Correlation measures the extent to which investment return fluctuations are aligned. Low correlation may serve to reduce the overall risk of a portfolio comprising different assets. Figure 7.5 shows that REITs returns have had a moderate positive correlation with stock market returns, here measured as the return on the S&P 500. The correlation is also less than that between the overall market and many other sectors. There has been a tendency for the correlation between REITs and the market to increase since 2000. REITs have therefore been less suitable for reducing the risk of a broad equity portfolio than before. This tendency also applies to other market sectors.
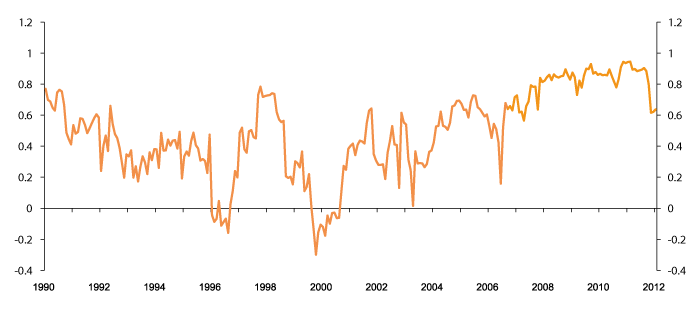
Figure 7.5 12-month rolling correlation between returns on REITs and S&P 500. United States. 1990–2012
Source www.nareit.com and Thomson Reuters Datastream.
A possible explanation of the higher correlation in recent years is that major macroeconomic events, like the global financial crisis and sovereign debt problems in a number of countries, have resulted in higher correlation throughout the stock market. Another possible explanation is that the REIT market has become a more developed and integrated part of the overall stock market.