3 Oil and gas prices support profitable activity
Oil and gas prices are key elements in the effort to achieve our petroleum policy goals. The sales value of oil and gas forms the foundation and determines the level of value creation and state revenues from the industry. This Chapter provides a review of the outlook for the oil and gas markets.
The world will need more energy in the future. Economic growth and improved standards of living, population growth and increased urbanisation, along with energy and environmental policy, will drive the development in energy consumption. This growth will be particularly significant in emerging economies and in developing countries where energy consumption per capita is low and energy poverty is extensive.
Not only does the world need more energy, it needs cleaner energy. Fossil energy sources currently make up 80 per cent of total energy access and will continue to supply most of the energy need for decades to come. In many countries, the transition in energy supply from carbon-intensive coal to cleaner gas can yield substantial greenhouse gas reductions. The world faces a sobering challenge in obtaining both more and cleaner energy. Development in energy consumption will be affected by many factors, including both global and regional climate policy.
Energy security will also be an important objective in energy policy, in addition to more and cleaner energy. Producer and consumer nations share a common interest in reliable energy supply. Efficient and well-functioning oil and gas markets, along with good energy dialogues between producer and consumer nations, are important factors in achieving this objective.
Reliable access to energy is a key factor in the development of the world economy, and is closely connected to national prosperity and development. Access to energy can free up labour currently used on low-productive manual labour, resulting in increased production, higher wages and less physically demanding work situations. Large parts of the world’s population consume very little energy. 1.5 billion people are without access to electricity. Improved access to modern forms of energy is needed in order to lift these people out of poverty. The time currently spent gathering fuel can be used for other purposes. The time, energy and resources can instead be devoted to producing, obtaining and preparing food. Light will facilitate better education.
3.1 The oil market
3.1.1 Development trends
Oil market developments are affected by a number of different factors: economic growth, energy and environmental policy, geopolitical factors and developments in the Middle East, technological development, changes in consumer behavior, etc. The market is in constant development, and the factors driving this development may change over time. Some development trends can be noted if we look at the oil market over the last five years:
High, rising and fluctuating oil prices
The average price during the last five-year period is 70 USD per barrel, while the price in the 1990s was less than 20 USD per barrel, cf. Figure 3.1. While prices have generally been higher, abnormally large fluctuations have also occurred. During this period, the price of oil has varied from 30 to 140 USD per barrel.
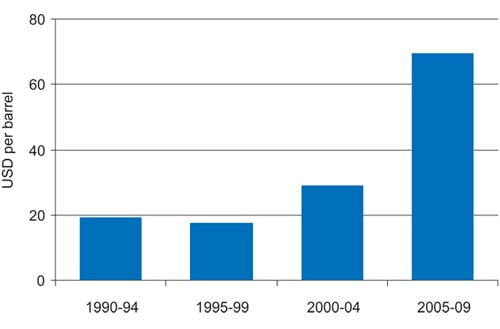
Figur 3.1 Oil price, 5-year average.
Kilde: PIRA.
OPEC has played an important role in price trends
Ever since it was established 50 years ago, OPEC has attempted to influence the price of oil. From the year 2000, OPEC sought to maintain the price within a price band of 22–28 USD per year, but abandoned this effort in 2005. OPEC has not had an official price target since that time, but in practice has tried to maintain an oil price of 70–90 USD per barrel.
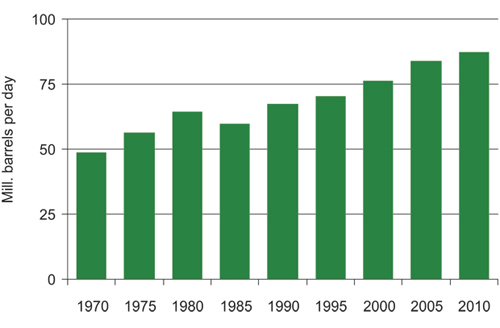
Figur 3.2 Historical oil consumption.
Kilde: PIRA.
Importance of financial markets
The financial markets have become more important for price formation. Trading in futures and other financial instruments has grown considerably in recent years, both on the regulated commodity exchanges and in the OTC1 markets. To an increasing degree, we see capital being placed in oil for purely financial investment purposes. This development has impacted price formation in the market. Oil is priced in US dollars in the international market. We note that the price of oil is more strongly correlated with the dollar exchange rate and share indices, and that financial market trends have a greater impact on short-term development in crude oil prices than was the case previously.
Growth outside OECD
The growth in demand has come exclusively from developing countries and emerging economies, with China being particularly important in this respect.
Higher production costs
The cost of producing oil has risen sharply, nearly doubling over the last five years. The financial crisis in 2008 contributed to a temporary drop in costs, with the rising trend resuming in 2010. The cost increase is related in part to the fact that remaining resources are gradually becoming technologically more difficult to recover. However, the higher costs are also linked to the high level of activity in the international petroleum industry and rising prices for input factors in the oil and gas activity.
3.1.2 Demand
Oil has been one of the most important commodities in the world economy for a very long time. Demand for oil has grown steadily in recent decades, driven in particular by higher global production, population growth, increased transport activity and urbanisation.
Periods of declining demand have also been experienced, such as in the early 1980s when the real price of crude oil skyrocketed over a short period of time. The financial crisis in 2008–2009 caused a sharp drop in the demand for oil, while demand grew again in 2010.
Consumption of oil will most likely continue to grow, both over the short and longer terms. Growth in oil use could be particularly evident in emerging economies and in the transport sector. There is a need for oil in China, India and other emerging economies where oil consumption per capita is a mere fraction of the consumption in the OECD countries cf. Figure 3.3. Both total value creation and per capita income are growing rapidly in these countries. In addition to higher energy consumption, higher income levels are often accompanied by a transition from traditional energy forms such as biomass to «modern» energy forms such as electricity and oil products.
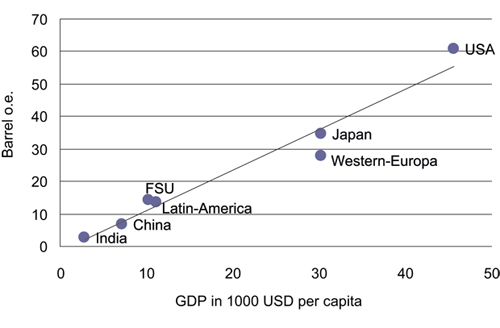
Figur 3.3 Oil consumption and gross domestic product per capita.
Kilde: PIRA.
Oil consumption may have already peaked in the traditional OECD area. Current consumption is about ten per cent lower than five years ago. This is due in part to the economic downturn in 2008–2009. In the years to come, oil consumption will most likely be further curtailed as a consequence of measures initiated to reduce CO2 emissions and promote renewable fuels. This is particularly the case e.g. in the US and in the EU countries.
Analyses from sources such as the IEA and the consultant firm PIRA indicate that all growth in oil demand over the next 10–20 years will come from developing countries and emerging economies cf. Figure 3.4.
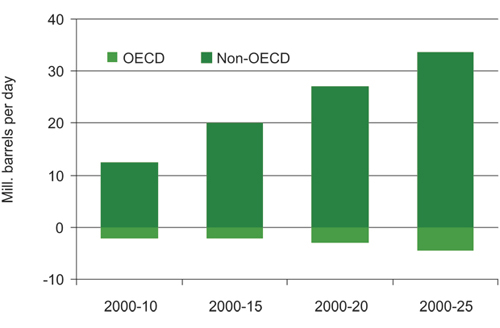
Figur 3.4 Cumulative growth in oil demand (basis year 2000).
Kilde: PIRA.
Growth in consumption will vary widely, depending on use. The transport sector is the most important element for the oil market. More than half of all oil consumption takes place in this sector, and oil accounts for nearly all the energy used there. There is reason to expect that most of the energy consumption in the transport sector will still be from oil-based fuels for quite a long time. Other oil consumption includes stationary applications such as power generation, the petrochemical industry and oil for heating purposes, cf. Figure 3.5.
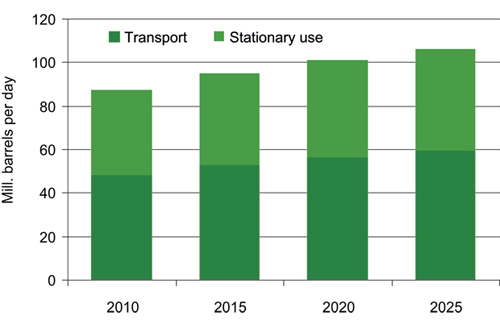
Figur 3.5 Demand trends distributed by area of application.
Kilde: PIRA.
At the same time, other energy sources such as biofuels and electricity may gain greater acceptance in the transport sector, driven by energy security, climate and environmental considerations. Both the EU and the US have targets for greater use of biofuels, primarily in road transport which accounts for most of the energy consumed in the transport sector. There are also expectations for increased use of electricity in the transport sector through the development of more efficient batteries in automobiles and plug-in hybrid cars. Replacing the automobile fleet will take time, which will in turn affect the timing for when new technologies can result in reduced oil consumption.
Demand for oil may increase by as much as one million barrels per day annually, reaching 100 million barrels per day in 2020, cf. Figure 3.5. Large, new oil resources must be developed; not just to meet the expected growth in demand, but also to replace declining production from existing fields. According to IEA estimates, production from fields that are currently on stream could fall by nearly three-quarters over the next 25 years. This is equivalent to an annual production loss of 2 million barrels per day, or nearly Norway’s entire oil production.
3.1.3 Supply
Whether or not global oil resources are sufficient to meet the increased need for oil in the future has been a recurring question. Estimates of the world’s oil resources are uncertain, and it is impossible to accurately predict the size of the oil resources, or how much of these resources can actually be produced, based on technical and economic factors. This will also depend on factors such as oil price development, as higher prices will mean that more resources will be economically interesting.
A pessimistic resource assessment points out that, for more than 30 years, oil consumption has been greater than the growth in reserves through exploration, cf. Figure 3.6. However, this could partly be due to the fact that there has been little exploration in parts of the world, for a number of different reasons. This is true, for example, in the Middle East, in spite of the fact that the region holds a significant potential for new discoveries.
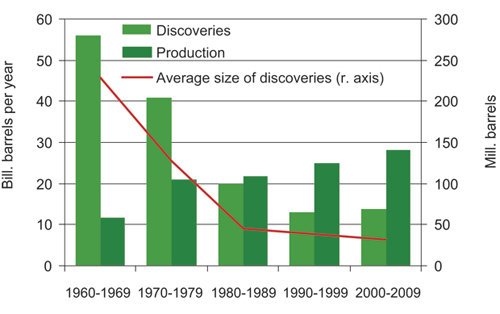
Figur 3.6 Oil discoveries and oil production.
Kilde: IEA, WEO 2010.
Remaining reserves have grown, in spite of the fact that oil consumption has been greater than the volume of resources proven through exploration. This is due to more efficient production methods resulting in higher recovery rates. Remaining proven reserves are estimated at nearly 1500 billion barrels, which is more than all of the oil that has been produced to date. With the current withdrawal rate, the oil will last for more than 40 years. The world’s total recoverable oil volumes could be more than 6000 billion barrels, according to estimates from sources such as the IEA.
A more pressing question than the size of world oil resources is whether the oil producers will be able to increase production in step with the growth in demand, and what oil price level will be needed to achieve this. Many of the producers outside OPEC are in decline, such as Norway, Mexico and the United Kingdom. As regards the two largest producers, Russia and the US, production is expected to remain stable or increase slightly in the years to come. Significant production growth could occur in Brazil where a number of major oil discoveries have been made in recent years. Canada could also significantly increase production, if it continues to develop its oil sand resources. Estimates indicate that production outside OPEC could rise in the years to come, but not nearly as much as the expected growth in demand.
This means that the OPEC countries will have to meet most of the growth in demand. It is assumed that two-thirds of the world’s oil resources are found in OPEC member countries. These countries currently represent about 40 per cent of the oil production, and the resource base in these countries could support considerable production increases above the current level. However, ample access to resources is no guarantee for stable production growth. Several of the resource countries in OPEC have been, or are currently, politically unstable. Historically, the Middle East has been characterised by frequent wars and conflicts, leading to periods of unstable or declining oil production and thus affecting these countries’ ability to build up new production capacity. Budget restrictions can also affect the countries’ opportunity to develop new capacity, as capital for investments in oil production must compete with the countries’ other needs. The extensive unrest in the region this year has lead to a halt in oil exports from Libya and a sharp rise in oil prices.
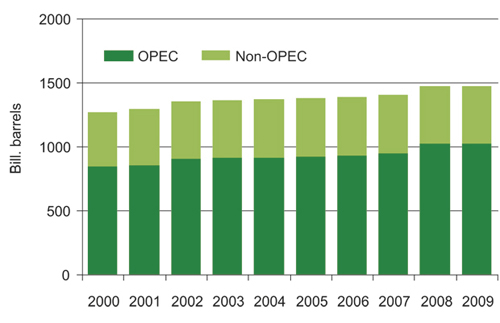
Figur 3.7 Proven global oil reserves.
Kilde: BP.
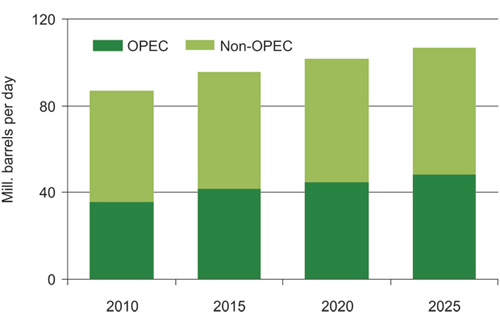
Figur 3.8 Future development in oil supply
Kilde: PIRA.
Iraq is an example of an OPEC country with significant unexploited oil resources. The country has now entered into agreements with the international oil industry that could result in rapidly growing production in the years to come. However, political instability and lack of security in the country could mean that such a development cannot be fully realised.
3.1.4 Oil price
The price of oil is the single most important factor for Norway’s petroleum activity. The price of oil has exhibited considerable historical variation from year to year, and issuing accurate price development forecasts has proven to be difficult.
In 2010, the spot price for oil was in the range of 70–90 USD per barrel (Brent Blend), which is a relatively high level in a historical perspective. Prices have risen steadily in 2011 to more than 120 USD per barrel, on the background of unrest and diminished oil deliveries from Northern Africa and the Middle East. The development in this region now represents a considerable element of uncertainty for the oil market. A normalisation of the situation could lead to a drop in oil prices, while there is also the chance that the unrest could spread, which could lead to even higher prices.
There are many factors in the market that could contribute to maintaining high oil prices in the years to come:
Increasing demand from China, India and other emerging countries
Weak growth in oil production from non-OPEC countries
Higher market share for the OPEC countries
OPECs market regulation
Geopolitical factors, risk and instability in major resource countries
High production costs in many important production areas
Over time, we do not expect that the price of oil will be lower than the costs associated with developing new oil fields, or increasing recovery from existing fields. Costs have risen substantially over the last ten years. It is not reasonable to expect that costs will fall much over the longer term. Marginal oil production is occurring in increasingly deeper water and at a greater distance from the markets, which contributes to higher costs. Nor is there reason to believe that the costs associated with unconventional oil, such as oil sand, will be much lower than the current level.
The cost level, as illustrated in Figure 3.9, indicates that an oil price of 60–80 USD per barrel is necessary in many areas in order to ensure that is it profitable to utilise the resource base. Production costs in many OPEC countries, such as Saudi Arabia, are much lower. However, there is no reason to believe that these countries will be interested in or capable of increasing their capacity so rapidly that it will not be necessary to develop new resources in high-cost areas outside the Middle East. The OPEC countries will also have an interest in working against the oil price becoming so high that it undermines the long-term position of oil in the energy markets. By keeping spare production capacity, OPEC has a means of preventing an excessively high oil price.
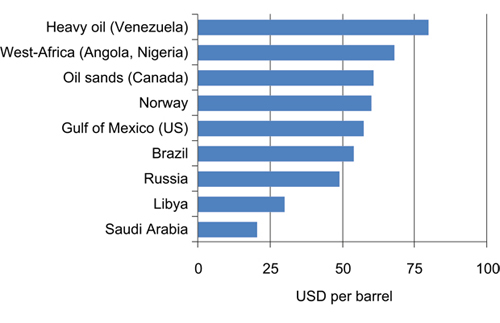
Figur 3.9 Production costs for oil.
Kilde: IHS CERA.
There are some differences of opinion between various analyst environments when it comes to oil price trends in the years to come, cf. Figure 3.10. For example, PIRA assumes a gradually increasing real price for oil up to about 125 USD per barrel in 2025, equivalent to a nominal market price of about 175 USD per barrel. IHS CERA, on the other hand, assumes a real price for oil of between 100 and 110 USD per barrel up to 2020, with a declining trend from 2015.
The Ministry is of the opinion that an oil price development approximately at the level of these estimates is possible over the next 10–20 years. At this level, oil prices can make it profitable to produce large parts of the Norwegian petroleum resources, assuming that we can control costs. High oil and energy prices are also important for development of renewable energy generation and to promote energy efficiency.
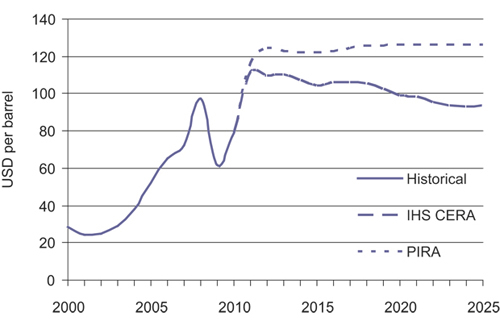
Figur 3.10 Oil price development, historical and future (fixed dollar).
Kilde: IHS CERA, PIRA.
3.2 Gas markets
There is considerable global growth in renewable energy generation from sources such as wind, solar and biomass. However, these sources are growing from a low level, and they are still expected to account for just a small percentage of world energy sources for many years to come. It is important that we turn world consumption of fossil energy carriers towards the most climate-friendly sources. Coal is the most carbon-intensive energy source, and many countries could achieve significant cuts in their CO2 emissions by replacing coal and oil with gas.
3.2.1 Development in the gas market
Natural gas, coal and oil are the world’s most important sources of energy. In 2008, demand for gas accounted for more than 20 per cent of the world’s total energy demand. The most important markets for gas are North America, Europe, Central Asia and Asia. Gas demand is expected to experience strong growth in the years to come, cf. Figure 3.11. In Asia, for example, gas demand is expected to grow by 225 per cent toward 2035. Economic growth and population growth are the most important drivers of this development.
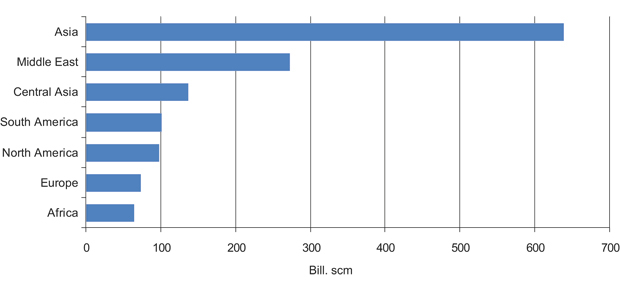
Figur 3.11 Expected growth in demand 2008–2035 (billion scm).
Kilde: IEA.
Globalisation
A key development trend in the last decade is the globalisation of the gas market through increased access to gas transported by ship (LNG – Liquefied Natural Gas). This increased flexibility in gas transport has allowed gas to reach new markets. The number of countries importing LNG has tripled over the last ten years. Most of the increase in gas production based on ship transport has come from Qatar. Based on market outlook at the turn of the century, the country undertook an extensive investment program with a view towards supplying the US and European markets with gas.
Unconventional production
Another factor that characterised the gas market was the growth in production of unconventional gas in the US. This production has grown extensively since the mid-1990s, in part as a consequence of reduced production costs and sufficiently high gas prices.
Economic downturn
At the end of the previous decade, an international economic downturn lead to reduced demand for gas, both as an input factor in industry and as a consequence of lower energy consumption.
Reduced demand combined with increased supply, both in the US and gas in the form of LNG, lead to an imbalance in global gas supply. Increased gas transport flexibility means that conditions in an individual regional market are more greatly affected than previously by incidents in other regional markets. The consequences of these factors included a drop in spot prices for gas, also in Europe.
In 2010, demand for gas had nearly returned to the same level as before the economic setback in 2008. This demand was driven by cold weather, but also by strong underlying growth in gas demand, which is expected to continue in 2011. Very strong demand for gas is expected from China and India in the next few years due to strong economic growth and a substantial need for energy in general.
The possibilities posed by unconventional gas production have significantly increased world gas reserves and the growth in LNG supply has made gas available to new markets. Overall, this has reinforced the position of gas as a reliable energy source.
3.2.2 European gas demand
The EU countries consume about 500 billion scm gas per year, or about five times the Norwegian production. During the period from 2000 – 2008, average annual demand growth in the EU countries was two per cent. The economic downturn in 2008 and 2009 caused demand for gas to fall by about six per cent. Gas demand is expected to recover to the 2008 level in the course of the next few years.
Gas is used in households, in business and industry, the public sector and the power sector. In the household sector, gas is used for heating and cooking, while it is primarily used for heating in the commercial sector. In the industrial sector, gas is used for heating, in industrial processes and as a raw material in the petrochemical industry. A number of factors affect demand for gas, with the single most important factors being economic growth, the price of gas relative to other energy sources, technological development and energy policy.
More than 95 per cent of Norwegian gas is sold in the European market, which means that development in European energy consumption is very important for Norway. The EU’s energy policy mainly balances three considerations: the environment, security of supply and competitive energy prices. In 2008, the EU adopted principal goals for climate policy, referred to as EU 20–20–20. These targets entail the following achievements towards 2020: a 20 per cent reduction in CO2 emissions, increase renewable energy sources to 20 per cent and implement energy efficiency measures to help achieve a 20 per cent reduction in energy demand. During the course of 2010, most EU countries launched plans for achieving these goals. Implementation of these plans will have a significant bearing on the future role of gas in the European energy picture.
Energy from renewable sources will help facilitate the EU countries’ efforts to reduce greenhouse gas emissions and their need to import energy. Power generation solutions based on wind and solar are considered to be the two alternatives with the greatest potential for growth in renewable energy. Due to the expected and natural variations in wind and sunshine, and since the produced power cannot be stored, these renewable energy sources must be supported by considerable back-up power generation capacity to replace deliveries when the wind doesn’t blow or the sun doesn’t shine. This back-up capacity is mainly expected to come from gas or coal in the short and medium perspective.
Demand for gas in the EU is expected to grow, while the EU countries’ own production of gas will decline, cf. Figure 3.12. This means that the EU will need to increase imports of natural gas in the decades to come.
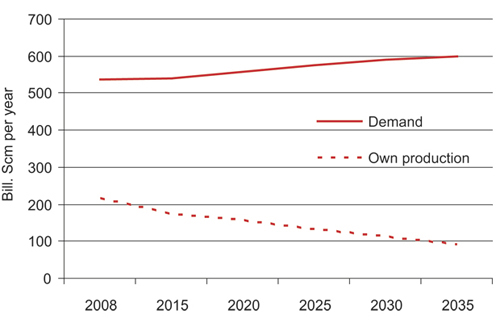
Figur 3.12 EU gas demand and own production.
Kilde: IEA.
Most of the growth in gas demand is expected to come in the power sector. This is due to a combination of increased demand for electricity, replacement of old power generation capacity to be phased out and a need for back-up capacity in connection with renewable power generation.
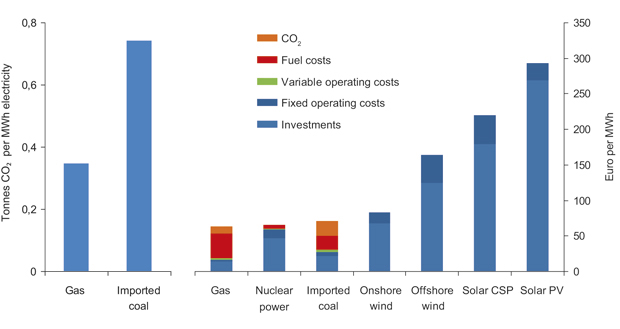
The average age of European coal power plants indicates that a significant number of these must be upgraded or replaced in the near future. A comparison of power generation based on coal and gas reveals a number of advantages for gas. CO2 emissions from a gas power plant are as much as 70 per cent lower than from the same size existing coal power plant. If gas replaces coal in electricity generation in Europe, this measure alone would be enough to meet Europe’s CO2 targets for 2020. The investments associated with building a new gas power plant are lower than for a coal power plant. Gas power plants also provide more flexible production and take less time to build. Replacing old coal power plants with gas power plants, in addition to the need for back-up capacity for renewable power generation, can form the basis for considerable growth in European gas demand in the decades to come.
Energy efficiency measures can lead to lower growth in gas demand from households as well as business and industry. The economic downturn has also entailed structural changes for parts of the industrial sector. Some of the demand for gas in Europe is expected to disappear permanently as a consequence of industry shutdowns.
3.2.3 Gas supply in Europe
The remaining conventional recoverable gas reserves within the EU2 are estimated at 2 500 billion scm. The EU countries’ own production of gas currently covers about 40 per cent of their consumption, but this number is falling as the resource base is mature.
Production of unconventional gas in the US has also increased substantially in recent years. Unconventional gas resources also exist in Europe, but the volume is uncertain. Moreover, developing these gas resources poses significant challenges, such as high costs compared with conventional gas, access to area, conditions imposed for such recovery and public acceptance. An industrial framework must also be built to enable such production. Most market players do not expect to see commercial development of unconventional gas in Europe until 2020.
Figur 3.13 CO2 emissions for gas and coal-based power generation (left), long-term marginal cost for power generation in Europe (right)1.
1 Assumptions: Gas price: 7.8 $/mmbtu, Brent: 84 $/bbl, coal CIF ARA: 78 $/tonne, coal/lignite: 2 €/GJ, CO2: 28 €/tonne, USD/EUR=1.44.
Kilde: CERA.
60 per cent of the European consumption is imported from various sources. In a historical perspective, the EU has imported gas via pipelines from three sources: Russia, Algeria and Norway. There has been a strong increase in LNG imports since 2000, which has lead to new gas suppliers entering the European market. In 2010, LNG accounted for 30 per cent of the total gas imports to Europe. The actual level of LNG imports in the years to come will depend on the supply balance in the Asian and US gas markets, as well as the level of gas prices in these markets, relative to Europe. Strong demand for gas outside the European market will limit the supply of gas in Europe.
There are significant gas reserves close to the European market. Development of new gas fields and associated infrastructure is capital-intensive. Decisions on new gas development projects are contingent on long-term expectations of sufficiently high gas prices.
Increased gas import to Europe is possible using existing pipelines and LNG terminals, with new infrastructure projects adding to this potential. The «Nord Stream» gas pipeline from Russia to Germany is scheduled for completion in 2011–2012, with an annual capacity of 55 billion scm. A new pipeline from Algeria to Spain («Medgas»), with an annual capacity of about 8 billion scm, was completed in 2010. Other projects being pursued by various players include a new pipeline from Algeria to Italy via Sardinia («Galsi»), a pipeline from Russia to Europe through the Black Sea, Bulgaria and Serbia («South Stream») and a pipeline from Iran and Azerbaijan to Europe through Turkey («Nabucco»).
Recent years have also brought an increase in receiving capacity for LNG in Europe, particularly in the United Kingdom where capacity has increased to about 45 billion scm. There are a number of ongoing and planned projects that will further enhance this capacity. New gas transport pipelines and receiving terminals for LNG increase Europe’s opportunities for importing gas, while also diversifying gas supply.
3.2.4 Gas prices
In contrast to the oil market where the price of oil is determined in a global perspective, different regional gas markets have different ways of pricing gas. The US gas price is determined by the supply and demand balance for gas in the region, while the Asian gas price is mainly set in contracts linking the gas price with other energy sources, typically oil.
The European gas market is characterised by two different pricing systems. The United Kingdom has a spot market for gas where price formation is based on the supply and demand balance for gas, while on the Continent, the majority of the gas is still sold under long-term contracts related to oil products.
As a consequence of recent years’ changes in the gas market and the strong development in the price of oil, spot prices for gas have, in certain periods, diverged significantly from the price level in oil-related contracts. Because the demand for gas is starting to recover after the crisis and due to continued growth in global gas demand, spot prices for gas are expected to rise in the next few years.
Boks 3.1 Unconventional gas
Gas resources traditionally believed to be too complex or too expensive to produce are often called “unconventional” gas resources. The three most common types of such unconventional gas resources are gas in tight sands, coalbed methane (CBM) and shale gas. These types of gas resources are found around the globe, although production has so far been limited to just a few countries. North America is currently the leading producer region.
Technological development has helped increase the production of unconventional gas, while simultaneously reducing costs. Production of unconventional gas represented about 45 per cent of total gas production in the US in 2009.
The size of these unconventional gas resources is uncertain. The IEA (WEO 2009) indicates that remaining recoverable resources of unconventional gas are approximately as large as conventional resources. With the current level of gas demand, this is equivalent to potential future supplies for 130 years for conventional gas, and about the same for unconventional gas.
3.3 Summary
The world will need more energy in the future. Economic growth and improved standards of living, along with population growth, increased urbanisation and energy and environmental policies, will drive development in energy consumption. This growth will be particularly high in the emerging economies and in developing countries where energy consumption per capita is low and energy poverty is extensive.
Not only does the world need more energy, it needs cleaner energy. Fossil energy sources currently make up 80 per cent of total energy access and will continue to supply most of the energy need for decades to come. In many countries, the transition in energy supply from carbon-intensive coal to cleaner gas can yield substantial greenhouse gas reductions. The world faces a sobering challenge in obtaining both more and cleaner energy. Development in energy consumption will be affected by many factors, including both global and regional climate policy.
Energy security will also be an important objective in energy policy, in addition to more and cleaner energy. Producer and consumer nations share a common interest in reliable energy supply.
The growing need for more and cleaner energy, for oil and gas, along with an emphasis on energy security, all point to good prospects for Norway’s export of oil and gas. Norway has always been, and will remain, a stable and predictable supplier of oil and gas. This is a competitive advantage for Norway as an energy supplier.
Rising demand, higher oil production costs and OPEC’s market regulation also point to long-term oil prices remaining high, seen in a historical perspective. Most price forecasts suggest that the price of oil will remain high enough to ensure profitable exploration, development and production of the remaining oil resources on the Norwegian Shelf, if costs are kept under control.
The gas market is changing. There is ample supply of gas and prices have come under pressure in recent years, but demand is expected to increase and contribute to an improved gas market balance over time. With growing globalisation of the gas markets, gas will also gradually reach new countries and new markets. Climate policy could also provide an additional stimulus for gas demand, as gas to replace coal is an effective measure in reducing CO2 emissions.
Gas production in the EU countries is declining, and they will need to increase gas imports in the years to come. Norwegian gas will help meet the European gas demand, and will be an attractive and valued energy source for many decades to come. This means there will be a basis for profitable exploration, development and production of the gas resources on the Norwegian Continental Shelf.
The Government will:
Work to promote efficient and well-functioning oil and gas markets.
Through dialogue with the authorities in other countries and participation in international forums, work to ensure that the advantages of natural gas over the use of coal are taken into consideration when setting the framework for Europe’s energy structure.
Work to expand and enhance the energy dialogue between producers and consumers, in part through the framework provided by the IEA and the International Energy Forum (IEF).