State Aid. Differentiated social security contributions in Norway
Historisk arkiv
Publisert under: Regjeringen Bondevik II
Utgiver: Finansdepartementet
25.03.2003
Brev | Dato: 25.03.2003
EFTA Surveillance Authority
| ||
Your ref | Our ref | Date |
SAM 030.95010 | 02/2359 AEE | 25 March 2003 |
State Aid. Differentiated social security contributions in Norway
- Notification of a transitional period
- Description of a de minimis scheme
- Description of a new national transport aid scheme
1. Introduction
Reference is made to the previous correspondence between the EFTA Surveillance Authority and the Norwegian authorities on the scheme of differentiated social security contributions. This includes the letter of 25 September 2002 from the Authority containing a proposal for procedural appropriate measures, and the subsequent letter of 25 October 2002 from Norway accepting the proposed measures. Reference is also made to the meetings between the Authority and Norwegian authorities.
2. General remarks
We would like to stress that in the view of the Norwegian authorities, the existing scheme of differentiated social security contributions is the most efficient means to maintain employment in sparsely populated areas, with the least possible distortion of competition. In addition, the system of regionally differentiated social security contributions is transparent, predictable and has a clear incentive structure. Therefore, we sincerely regret that the Authority has made it clear that it could find no possibilities for a continuation of the system within the interpretation of the state aid provisions.
The overall aim of Norwegian regional policy is essentially to maintain the settlement pattern and ensure equal living conditions throughout the country. The policy also aims at preventing overcrowding or depopulation problems. The objective of the differentiation is to promote the employment of persons who live in specific, disadvantaged regions. These are regions with permanent economic handicaps, such as sparse population, long distances, a harsh climate, a high level of dependence on the public sector and a narrow industrial base. Such permanent handicaps may lead to a further decline in industry and subsequent depopulation problems due to the lack of employment opportunities.
The regional differentiation of the social security tax is designed to achieve, with a minimum of economic distortion, a more equitable distribution of employment opportunities across the country. The measure is non-specific within the eligible regions and the decisive factor is solely the residence of the employee . When the objective is to promote employment opportunities for persons, aid that is directly linked to the cost of employing these persons will be the most efficient and the least distorting means. Reduced social security contributions for employing people resident in the specific areas give the residents an advantage in the labour market and contribute to maintaining employment and to the reduction of depopulation problems. The variations in contribution rates are proportional to the actual problems that the regions are facing. Furthermore, the measure of reduced social security contributions is not a defensive measure directed at protecting existing undertakings, but a measure that automatically applies also to new undertakings.
Thus, the system seems to be fully consistent with the rationale of Article 61(3)c, which is to allow aid to facilitate the developing of certain areas in situations where the aid does not adversely affect trading conditions to an extent contrary to common interests.
However, the Norwegian authorities have noted the Authority’s opinion that the continuation of a system of differentiated contributions would incompatible with the Authority’s existing Guidelines on National Regional Aid. Hence, the following considerations put forward by the Norwegian authorities are based on the Authority’s position in the matter.
3. Continuation of the current scheme in zone V
The Norwegian Government considers the circumstances in zone V, the so-called initiative zone, comprising the northernmost parts of Norway, namely Finnmark and the northern part of Troms, to be exceptional. This zone is subject to a zero rate for social security contributions today.
The circumstances in Finnmark and Nord-Troms are exceptional, both in a national and in a European context. The area has an extremely low population density, very long distances and low accessibility to central markets, and harsh weather conditions . Furthermore, the Government wishes to point out that the initiative zone is the core area of the Sami population . It is not possible to introduce alternative measures with the same positive effects on employment in the area.
The Norwegian Government will notify a continuation of the current scheme in zone V in a separate letter. However, the current scheme of reduced social security contributions is so essential for these areas that the Government has approached the other EFTA-parties to the EEA Agreement to seek the consent to invoke Article 1 (2) paragraph 3 of Protocol 3 to The Surveillance and Court Agreement to retain the current scheme in this zone.
The continuation of a zero contribution rate in zone V will be subject to evaluation, due regard being held to the development in EU/EEA law, including the planned revision of the regional guidelines.
4. Continuation of a differentiated scheme as regards the agriculture/forestry and fisheries sectors
The major part of the primary industries (agriculture/forestry and fisheries sectors) falls outside the scope of the EEA Agreement, cf. Article 8(3) and Protocols 3 and 9 to the EEA Agreement. The Norwegian Government has decided to maintain the current system of differentiated rates of social security contributions in these sectors. Such a provision is not yet included in the enclosed Regulation. The Norwegian authorities will introduce a provision identifying the categories of undertakings which fall outside the scope of the EEA Agreement and therefore may be subject to the current differentiated rates, and ensure the full compliance with the EEA Agreement in this respect.
5. Description of the de minimis solution
Reference is made to the enclosed draft Resolution as regards the proposal for a de minimis scheme. Roughly speaking, our proposal implies that the undertakings in the eligible regions in zones IV - II that benefit from a reduced rate today, will be subject to the same contribution rate as the existing one, maximum € 33 333 per year (approximately NOK 250 000).
Letter i) of the draft Resolution contains the provision ensuring that the total amount of de minimis aid, granted according to this scheme or other schemes, will never exceed the threshold of € 100 000 over a three year period. The amount is stipulated in NOK according to the current rate, which leads to an amount somewhat below the de minimis threshold. In case of currency fluctuations, the amount will be adjusted to ensure compliance with the de minimis rule. A direct reference to the Norwegian Regulation implementing the de minimis rule is included.
6. Description of a new national transport aid scheme
Reference is made to a separate notification letter of 25 March 2003. Based on the exemption under Article 61(3)(c) of the EEA Agreement and Chapter 25.4 paragraph 27 of the Authority’s Guidelines concerning national regional aid, the Norwegian Government will notify a new national transport aid scheme.
The designation of the area for regional transport aid is based on Annex XI of the Authority’s State Aid Guidelines on Regional Aid. Transport aid may be given in areas that qualify for regional aid on the basis of the population density test.
The following area is proposed as eligible for national transport aid:
- In Troms County the municipalities of Harstad, Tromsø, Kvæfjord, Skånland, Bjarkøy, Ibestad, Gratangen, Lavangen, Bardu, Salangen, Målselv, Sørreisa, Dyrøy, Tranøy, Torsken, Berg, Lenvik and Balsfjord.
- Nordland County,
- In Nord-Trøndelag County the municipalities of Leka, Nærøy, Vikna, Flatanger, Fosnes, Overhalla, Høylandet, Grong, Namsos, Namsskogan, Røyrvik, Lierne, Snåsa, Inderøy, Namdalseid, Verran, Mosvik, Verdal, Leksvik, Meråker and Steinkjer.
- In Sør-Trøndelag County, the municipalities of Hemne, Snillfjord, Hitra, Frøya, Ørland, Agdenes, Rissa, Bjugn, Åfjord, Roan, Osen, Oppdal, Rennebu, Meldal, Røros, Holtålen, Midtre Gauldal, Selbu and Tydal.
- In Møre og Romsdal County, the municipalities of Kristiansund, Vanylven, Sande, Herøy, Ulstein, Hareid, Norddal, Stranda, Stordal, Rauma, Nesset, Midsund, Sandøy, Aukra, Eide, Averøy, Frei, Gjemnes, Tingvoll, Sunndal, Surnadal, Rindal, Aure, Halsa, Tustna and Smøla.
- In Sogn og Fjordane County, the municipalities of Gulen, Solund, Hyllestad, Høyanger, Vik, Balestrand, Leikanger, Sogndal, Aurland, Lærdal, Årdal, Luster, Askvoll, Fjaler, Gaular, Jølster, Bremanger, Vågsøy, Selje, Eid, Hornindal, Gloppen and Stryn.
Aid may only be given in respect of the extra costs of transporting goods inside national territory, calculated on the basis of the direct and most economical mode of transport mode between the place of production and processing and the nearest commercial outlet.
Under the national transport aid scheme aid is granted in relation to:
- Transport of goods, which will undergo processing at the premises of the consignee, to enterprises located in the area eligible for transport aid
- Transport of goods from enterprises located in the eligible area.
The highest aid intensity priority is given to Troms, Nordland and Nord-Trøndelag (zone 1) while Sør-Trøndelag, Møre og Romsdal and Sogn og Fjordane (zone 2) is subject to lower aid intensity.
The aid intensity will be differentiated according to transport distance (minimum 350 km) and according to geographical zone. The table below shows the differentiation in aid intensities.
Table 1: Aid intensity
Transport distances in kilometres | Zone 1 | Zone 2 |
350 – 700 | 30 per cent | 20 per cent |
701 - | 40 per cent | 30 per cent |
By setting a fixed maximum aid intensity at 40 per cent for transport aid, the Norwegian Government will ensure that firms are not being overcompensated, according to Annex XI to the Authority’s State Aid Guidelines on National Regional Aid. If undertakings benefit from a reduced social security tax in the same period, the advantages of this tax reduction will be deducted from the transport aid grant calculated according to table 1. Furthermore, the undertakings will not receive more in transport aid from the new transport aid scheme and reduced social security contributions, altogether, than the amount equivalent to what they would have received through the existing differentiation of social security contributions.
The present notified regional transport aid scheme, administered and financed by the four northern county municipalities of Norway, will continue.
7. Zones III and IV – Notification of a transitional period
7.1 General description of the system
For the zones III and IV, we hereby notify, in accordance with Article 1(3) of Protocol 3 to the Surveillance and Court Agreement, the introduction of a transitional period. Such transitional period would give the recipient undertakings the highly needed opportunity to prepare insofar as possible for the new situation of paying the full rate of social security contributions.
We notify the following escalation of rates:
Table 2:
Current rates | Rates 2004 | Rates 2005 | Rates 2006 | Rates 2007 | |
zone I | 14,1 | 14,1 | 14,1 | 14,1 | 14,1 |
zone II | 10.6 | 14.1 | 14.1 | 14.1 | 14.1 |
zone III | 6.4 | 8.3 | 10.2 | 12.1 | 14.1 |
zone IV | 5.1 | 7.3 | 9.5 | 11.7 | 14.1 |
The proposal implies a transitional period over 3 years with a rate increase of 1.9 percentage points per year in zone III, (except for the year 2007 when the increase is 2.0 percentage points) until the percentage reaches the full rate of 14.1 per cent in 2007. For zone IV it is proposed that the rate is increased by 2.2 percentage points per year (except for the year 2007 where the increase is 2.4 percentage points), until the rate reaches the full rate of 14.1 per cent in 2007. As pointed out below, in the section describing the de minimis solution, the increased rate will apply only as regards aid exceeding the de minimis amount.
The Authority has made it clear that no transitional period will be accepted for zone II. Thus, we propose no transitional period for this zone.
For a further description of the proposed escalation of rates, reference is made to the enclosed draft Resolution.
7.2 Objective necessity of a transitional period
7.2.1 General comments
As for the possibilities to “prepare” the undertakings for the changes we would like to point out that in 1999, when the ESA decision on the revised system was made, there was no practice or other signal indicating that the Commission or the Authority would change the interpretation of the guidelines within the near future. On the contrary, there was reason to read the acceptance of the system (in its revised form) in a way that the Authority/the Commission had undertaken a substantial and thorough examination of the scheme, and thereby laid down what was acceptable within a proper interpretation of the relevant rules. The fact that the acceptance was given on the term that there would be a review within three years time was not seen as exceptional. To our knowledge, this is a regular condition made by the Commission or the Authority when allowing operating aid.
Ever since the Authority approached Norwegian authorities in 2001, after the Commission’s negative decision against Sweden in December 2000, the main signal from the Authority has been that Norway had to adapt to the new interpretation by going through the sectors that were included in the Swedish scheme, in order to evaluate which sectors had to be excluded from the Norwegian system of differentiation.
The Authority followed up with a proposal for a “twin track” procedure which involved a “negotiation procedure” (track 1), which was to result in appropriate measures towards Norway which ensured that the differentiation was altered in order to comply with the state aid rules. At the same time a track 2 was to be followed, in which Norway would at an early stage be allowed to suggest amendments to the present Guidelines on Transport Aid in connection with the so-called “mid term review” originally planned to take place in the summer of 2002. The intention was that such an alteration of the Guidelines would increase the probability for a continuation of the present system, even after 2003.
Not until November 2002 was it made completely clear that the Commission now demanded verification for each single undertaking that there was no overcompensation. The Authority stated that it was obliged to follow the Commission’s interpretation in this respect.
Viewed in the light of the chronological development in the case, we are of the opinion that we received no clear signals that the system as such had to be abolished until late autumn 2002. On this basis, we did not find it professionally nor politically advisable to request the undertakings to adapt to a situation with no differentiation (beyond de minimis), before we saw the contours of how a possible new system would be drafted and what adaptations had to be made.
We also refer to the Authority’s own statement in its decision on appropriate measures, where it is opened up for the possibility of a transitional period, provided that such a period is objectively justified.
7.2.2 The economic effect of an abolishing of the system as from 2004
Regionally differentiated social security contributions constitute the single most important regional policy instrument in Norway. Since it was established in 1975, firms have relied on the scheme when deciding their location and their business expansion. Because this measure is applied automatically to all firms employing people resident in the relevant zones, all industries in the zones in question have adapted to the tax reduction. Major limitations of the scheme will raise significant and very serious difficulties, not only for single firms, but for all firms (exceeding the de minimis threshold) and thus, for the employment situation in the whole area. In addition, many regions within this area may experience an extraordinarily difficult situation, being dependant on one or only a few corner stone firms.
Table 3: Estimated gross revenue effect per zone and sector, private sectors only. 2004. Mill. NOK
Primary sector | Manufacturing industry | Construction | Private services etc. | Total | |
Sone II | 50 | 485 | 140 | 565 | 1240 |
Sone III | 30 | 135 | 65 | 250 | 480 |
Sone IV | 100 | 580 | 275 | 1 595 | 2550 |
Sone V | 35 | 190 | 95 | 490 | 810 |
Total | 215 | 1 390 | 575 | 2 900 | 5080 |
Source: Statistics Norway and Ministry of Finance.
Altogether, the decision to introduce major limitations in such a significant measure, which has existed for nearly 30 years, and which has been approved by the ESA with some minor changes in 1999, is one that seriously affects the economic situation in the areas concerned. It is estimated that, if the system had been prolonged as from 2004, the total gross tax relief to the private sector in the zones II, III and IV, would be NOK 4 270 mill.
The tax increase would, in the short run, have the direct result of a cost increase for the undertakings, which would have to adapt their activities to the new cost level. Under such circumstances, all private undertakings would reduce their workforce while other undertakings would be forced to close down.
A recently published report from an independent committee, “Effektutvalget” (enclosed), presents various calculations (and models) of possible macro effects of abolishing the regional differentiation of the tax . The results depend on the assumptions. Provided that there are no incidence effects on wages and product prices, the estimates, with reasonable assumptions, indicate a dramatic employment reduction in the private sector of 15 400 persons in zone IV and 2 900 persons in zone III as a direct effect of the increase in total wage costs. This would represent an isolated reduction of employment in the private sector in these regions of as much as 15.5 per cent (13.8 per cent in zone III, 15.8 per cent in zone IV). The corresponding reduction in total employment in these regions would be substantial: 7.5 per cent in zone III and 8.5 per cent in zone IV.
Table 4: Effects of a levelling of the social security tax rates, provided no incidence effect on costs and a wage elasticity of -2.
Zone III | Zone IV | Zone II | |
Existing tax rate | 6.4 pct | 5.1 pct | 10.6 pct |
Increase in tax rate | 7.7 per cent | 9.0 pct | 3.5 pct |
Employment | |||
Share self-employed | 16.7 pct | 9.2 pct | |
Share employed in the public sector | 28.8 pct | 37.0 pct | |
Share employed in the private sector | 54.5 pct | 53.8 pct | |
Effects: | |||
Reduction in the number of employed | 2 900 | 15 400 | 7000 |
As percentage share | |||
- of employed in the private sector | 13.8 pct | 15.8 pct | 6.6 pct |
- of total employed | 7.5 pct | 8.5 pct | 3.9 pct |
Source: Report from ”Effektutredningen”, basic figures from PANDA.
The model takes account of the number of self-employed in the private sector who would not be directly affected. Furthermore, this model anticipates that the public sector is fully compensated, and that in spite of the change of incentive structure (less motivation for the employment of labour), there will be no reduction in employment in the public sector. This model also takes account of the fact that labour may be substituted by other input factors to minimize the undertakings’ actual losses 1>>. On the other hand, this model does not take account of the indirect effects resulting from the reduced level of demand for goods, including locally produced intermediate goods, due to the increase in unemployment and the decreased level of economic activity in the regions in question 2>>.
It is reasonable to believe that a regional increase in the social security contributions will only to a very limited extent be shifted through increased product prices or reduced wage costs in the short run, because of the delay in adjusting the economic activity to the new situation. This is supported by the fact that the Norwegian system of wage formation is characterised by a relatively high degree of centralised, collective bargaining, which implies that the wage level will not be adjusted immediately to the increased employer social security contributions.
The immediate effect of an increase in employers’ social security contributions would represent a corresponding increase in employers’ total wage costs. However, in the long run one might expect that the increase induces a reduction in wages (and an increase in product prices in sectors sheltered from international and national competition). Parts of the costs will be shifted to wage earners and consumers. There are no empirical studies that provide precise answers as to how the wage formation process is influenced by change in the level of pay-roll taxes. All empirical studies indicate that the changes in the social security tax rate will, to a certain degree, be shifted to the wage earners in the long run. Findings from empirical studies based on national data indicate an incidence effect of 70 – 80 per cent in the long run. The results of analyses on partial regional changes are more varied as regards the importance of the long term incidence effects 3>>.
As pointed out above, a reduction of wages due to increased social security contributions will take a considerable amount of time. This is supported by nearly all empirical studies 4>>. The incidence effect also implies that the net benefit for the undertakings of the existing tax reduction is smaller than the immediate rise in costs resulting from a tax increase. The time needed for the incidence effect to work, emphasises the need for a rather long transitional period when such significant changes are to be introduced.
The fact that the profitability margins of the industry in these regions are on average low, also indicates that there is limited possibility for increasing product prices are limited, though there may be more significant variations between different sectors in this case . Reference is made to the enclosed key figures for non-financial joint stock companies by tax zones. They have been produced by Statistics Norway and are based on companies' annual reports submitted for the year 2001 to the Register of Company Accounts in Brønnøysund (the latest statistical figures available), cf. annex. The residence of each company is decided by the address of the main office. The figures reveal that the profitability of companies situated in zone IV (and V) is (especially) low. The return on total assets for companies registered in zone III is also relatively low. The total return on assets for companies registered in zone III, zone IV (and zone V) are respectively 6.4 per cent, 5 per cent (and 3.7 per cent), compared with 7.4 per cent in total for all zones, (and 7.8 in zone II) cf. table 1 annex 1. Since 2001 the situation has deteriorated.
The economic situation in Norway deteriorated considerably during the last months of 2002, and the beginning of 2003, as the unemployment rate increased and production stalled. Business profits have declined significantly during the last couple of years. In the manufacturing industry, wage costs represented 92 per cent of total factor income in 2002, compared with an average of around 80 per cent over the last decades.
Figure: Wage costs as a share of factor income in the manufacturing industry.Per cent
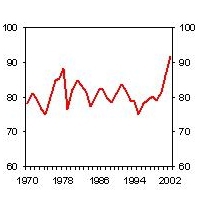
Source: The technical reporting committee for the income
settlements.
7.2.3 The effect of introducing a the minimis aid scheme
The introduction of a de minimis aid scheme, allowing for a reduced tax rate within the de minimis threshold, implies that the positive economic incentive/motivation for employing persons resident in the relevant regions is maintained as regards small undertakings (the actual size varies from about 10 in zone IV to about 20 in zone II for an average level of wages.) Accordingly these undertakings would not be directly affected by the abolition of the existing system.
In the current zones however, the key figures for non-financial joint stock companies indicate that as much as approximately 50 per cent of the total wage cost basis for the joint stock companies, would fall outside the scope of the de minimis rule in zones III and IV (varying from 40 per cent in zone III to just above 50 per cent in zone IV). This is supported by other statistical sources (Employer and Employee Register) that take account of all companies (not only joint stock companies in non-financial companies). Calculations based on the Employer and Employee Register indicate that the number of total employees in the private sector for which the existing reduction in tax exceeds the scope of a de minimis solution, varies from 55 per cent of the total number of employees in the private sector in zone IV to 42 per cent in zone II.
Table 5: The number and share of normal man-labour year and enterprises in the private sector which fall below or exceed the de minimis threshold *. 2004 estimate (2001 figures estimated by expected wage increase until 2004)
Zone | Total | Above de minimis | ||||
The number of normal man-labour years | The number of enterprises | The number of normal man-labour years | The share of normal man-labour years | The number of enterprises | The share of enterprises | |
zone II | 107 300 | 12 700 | 44 600 | 0.42 | 600 | 0.05 |
zone III | 20 200 | 3 000 | 8 700 | 0.43 | 340 | 0.11 |
zone IV | 90 300 | 11 000 | 49 700 | 0.55 | 1 810 | 0.16 |
Source: Statistics Norway and Ministry of Finance.
The table also gives the estimated number (or the share) of undertakings that are fully compensated through a de minimis aid scheme. This is not, however, a suitable indicator for the actual effects of a de minimis aid scheme. On the contrary, the number (or share) of undertakings that are fully compensated is a misleading estimate. The following example illustrates this point: In a situation with 10 undertakings resident in zone IV, where 9 of these undertakings employ 1 person and the remaining undertaking employs 100 persons, 90 per cent of the undertakings would fall below the de minimis aid threshold, while only 15 per cent of the “normal man-labour year” would be registered below the de minimis aid threshold. This example shows that the most adequate indicator for the effect of the de minimis aid is the number or share of “normal man-labour year”.
A rough estimate of the reduction in employment, given the introduction of de minimis aid, could be based on the result from the referred model presented by the “Effektutvalget” multiplied by the share of normal man years that exceeds the de minimis aid. The estimated reduction of total employment in zone IV and III would then still be as high as 4.7 per cent and 3.2 per cent, respectively (In zone II the estimated figure would be 1.6 per cent). Such an estimate does not, however, take account of the fact that small enterprises are more often than larger enterprises, dependent on the actual localisation of the larger ones, as a contract partner for supplying locally produced intermediate goods and services to the larger one or of supplying services to the total workforce resident in the area. This implies that the figures above may underestimate the reduction in employment.
Reference is also made to the key figures for all non-financial joint stock companies by tax zones. The return on total assets in 2001 for companies which would fall outside the scope of a de minimis rule 5>>, were 5.9 per cent in zone III and only 3.5 per cent in zone IV, compared with 7.4 per cent in total for all industry covered by the account figure statistics, cf. annex.
The possible total tax increase for the group of companies which may exceed the de minimis threshold would, measured as a ratio of total operating profit in 2001, be about 24 per cent in zone III and almost 40 per cent in zone IV (and more than 85 per cent in zone V). 6>> (The corresponding figure for zone II is 5 per cent.) These are aggregate figures based on the actual accounting figures in 2001. In these calculations account has been taken of the fact that also larger enterprises will receive de minimis aid.
To illustrate: A company located in zone IV with 250 employees, with an average gross wage cost of NOK 350 000 per employee would be subject to an increase in labour costs of NOK 7.6 mill. (in case of a de minimis amount of NOK 250 000). Even companies with only 50 employees would in fact receive support of very limited importance through the de minimis aid compared with the actual increase in labour costs (in this case the company would be subject to an increase in labour costs of NOK 1.3 mill.). Taking into account the general low profit margin in the regions in quesition, there is reason to believe that such a significant cost increase might lead several companies to bankruptcies, or substantial reductions in their labour force (and their production), if no transitional period is granted, allowing for gradual adjustments in wages (or product prices).
Table 6 shows the estimated aggregate figures of the increased tax burden in the private sector in the case of de minimis aid, with and without a transitional period. The figures illustrate that with a transitional period the immediate increase in the tax burden for 2004 would be significantly reduced, but would still be considerable.
Table 6: Estimated effect of a de minimis aid scheme, and increase in total tax burden for the private sector with and without a transitional period. Gross mill. NOK
Zone | Tax relief within the scope of de minimis. Mill. NOK. | Increased tax with a de minimis scheme. Mill. NOK. | Increased tax in 2004 with a deminimis scheme and a three year transitional period. Mill. NOK. |
zone III | 310 | 180 | 45 |
zone IV | 1 305 | 1 245 | 305 |
Total | 1 615 | 1 425 | 350 |
Source: Statistics Norway and Ministry of Finance.
7.2.4 The effect of the continuation of the current system for the fish, agriculture and food processingindustry
As described above, the Norwegian Government has decided to maintain the current system of differentiated rates of social security contributions in fishing, agriculture and food processing. Most of the people in these sectors are self-employed and therefore not affected by the system of regionally differentiated contributions. The share of normal man-labour years covered by the system, which will fall outside the EEA Agreement, is estimated to 8 per cent in zone IV and 6 per cent in zone III
Table 7: The estimated share of normal man-labour years that falls outside the EEA Agreement in the agriculture and fishery industry. 2004
Agriculture industry | Fishery industry | |||
The number of normal man-labour years | The share of normal man-labour years which falls outside the EEA Agreement | Employees in the fishing industry | The share of normal man-labour years which falls outside the EEA Agreement | |
Zone III | 960 | 0.05 | 270 | 0.01 |
Zone IV | 1 970 | 0.02 | 5 050 | 0.06 |
Source: Statistics Norway and Ministry of Finance.
The overall tax relief in these industries in zones IV and III are estimated to be about NOK 230 mill., of which NOK 145 mill will be above the de minimis threshold. This would represent about 10 per cent of the estimated increase in the tax burden for the private sector in these regions, provided that a de minimis scheme is in force, cf. table 3.
7.2.5 The effect of introducing a direct transport aid scheme
Due to the serious economic situation that would face these regions when the existing system of differentiated social security contributions is abolished, Norway will be introducing a new direct transport aid scheme.
Introducing a new national transport aid scheme will in no way reduce or eliminate the need for a transitional arrangement with regard to geographically differentiated social security contributions. Transport aid is a different kind of measure that will benefit only a small part of the affected enterprises. Compensation will only be granted for extra costs for the transport of goods. Therefore, the beneficiaries will in practice be limited to undertakings in parts of the manufacturing industry. In zone III and zone IV, manufacturing industry account for 28 per cent and 22.7 per cent, respectively, of the revenue effect of regionally differentiated social security contributions in the private sector. The service sector accounts for the largest part of the revenue effect of the present system. In general this sector will not benefit from direct transport aid.
As the manufacturing industry also includes many companies with marginal transport costs or with transport distances of less than 350 km, the above-mentioned maximum level is related to what could be compensated within the new national transport aid scheme. The undertakings will not receive more aid than they do today. Most undertakings will still receive substantially less than they do today, or will receive no compensation at all through the national transport aid scheme.
As the benefit from reduced social security contributions will be deducted before calculating the annual amount of transport aid per undertaking, there is no risk of overcompensation of transport costs by the new national transport aid scheme. In addition the undertakings will not receive more aid from the new transport aid scheme and reduced social security contributions, altogether, than the amount equivalent to what they would have received through the existing differentiation of social security contributions.
After the expiry of a transitional period, the total estimated budget for the new transport aid scheme will be approximately NOK 150 mill. in the zones IV and III. Therefore, the new aid scheme would compensate for about only 10 per cent of the enterprises’ losses following from an abolition of the current system in zones IV and III.
7.2.6 Conclusions
The figures above illustrate that no transitional period, or a very short one, would create uncertainty and crises in a large number of regional businesses and may severely hurt the economic development in these regions. This may partly be avoided if allowing for the market mechanisms to adjust smoothly during a transitional period of three years for the zones IV and III. Given that the scheme of reduced tax on wages has existed over a long period of time and has applied for the whole region, it is likely that a part of the tax reduction is carried over to the employee in the form of higher wages. This implies that the actual differentiation benefit the companies receive according to the current scheme is smaller than the cost rise that immediately follows from an tax increase up to the highest rate (i.e. the cost rise before the market mechanisms have worked.) Not allowing for a transitional period would not only lead to an immediate abolishing of a possible benefit, but also, in the short run, a tax sanction on the actual firms.
8. Final remarks
Norway has important economic and political reasons for maintaining a dynamic regional policy, both through the tax system and through other measures. The need for a revision of the system has created considerable public turbulence. Thus, we would highly appreciate a rapid decision which meets the concerns described above.
Yours sincerely,
Thorbjørn Gjølstad
Director General
Jon Tingvold
Deputy Director General
2 enclosures
Fotnoter:
1. The effect of cost minimizing behaviour is reflected in a wage elasticity of -2.
2. Other calculations presented in the report of the “Effektutvalget”, are based, or partly based, on a model called “MODAG”. This model anticipates that the tax increase is fully carried over in wage reductions. The effect on employment is incurred as a result of reduced domestic or regional demand, due to lower economic activity. These are effects that are not taken account of in the calculation presented above.
3. Dyrstad (1992) estimated the incidence effect of a regional change in the social security tax to be 30 pct. in the long run, while Johansen and Klette (1997) estimated the incidence effect of a regional change to be between 60 and 100 pct. Johansen (2001) finds no significant incidence effects. All studies are carried out on the manufacturing industry sector.
4. In the macro model MODAG, the assumed time lag is as follow: the first year 0, the second year 0.21, the third year 0.43, the fourth year 0.61, the fifth year 0.74, the sixth year 0.83, the seventh year 0.87, the ninth year 0.91 and the tenth year 0.94.
5. Companies for which the reduction in social security contributions may exceed a de minimis rule in 2004, if the prevailing rate was applied and expected wage increase is taken account of.
6. Calculated on the basis of 2001 accounting figures.
 |