2 Overview of the tax system
2.1 Introduction
This chapter provides an overview of the fundamental principles for a good tax system, as well as the general rules for 2022. There are some exceptions to these general rules, so-called tax expenditures. The tax expenditures are discussed in section 2.8.
Direct taxes include, among other things, income tax from individuals and businesses, employers’ National Insurance contributions, wealth tax and property tax.
Indirect taxes include value added tax, excise duties, customs duties and sectoral taxes.
Total tax revenues were estimated at NOK 2,313 billion in 2022 (see Table 1.12). Of this amount, central government revenues from taxes in the petroleum sector account for 32 per cent. High petroleum prices have resulted in taxes from the petroleum sector accounting for a higher proportion and contribute to higher overall tax revenues than in recent years. Taxes from the petroleum sector are included in the central government’s net cash flow from petroleum activities, which is transferred to the Government Pension Fund Global. Income tax from individuals, i.e. the sum total of National Insurance contributions, tax on general income and bracket tax, accounts for 26 per cent of overall tax revenues, while value added tax and employers’ National Insurance contributions respectively account for 16 and 10 per cent of total revenues. Figure 2.1 shows estimates for total taxes to the central government, counties and municipalities for 2022, divided into the types of taxes. The figure illustrates the numbers in Table 1.12.
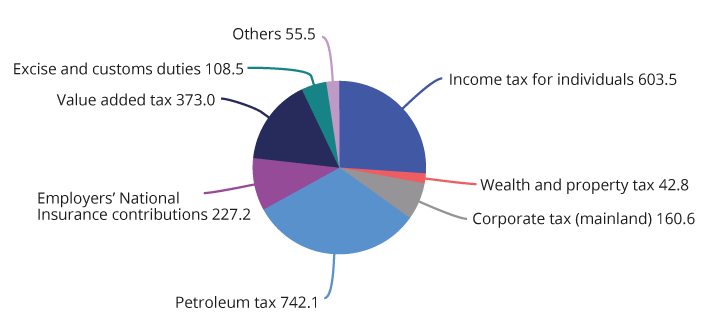
Figure 2.1 Taxes accrued to central government, counties and municipalities. Estimates for 2022. NOK billion
Source Ministry of Finance.
2.2 Guidelines for an efficient tax system
Taxes are necessary for financing public services and transfers. The tax system also influences labour supply, consumption, savings and investments. It is important that the tax system is designed in accordance with a set of fundamental principles which enable society’s resources to be allocated as efficiently as possible. This can be achieved by:
First making use of taxes that promote better use of resources (for example environmental taxes equivalent to marginal external costs);
thereafter employing neutral taxes that do not influence the choices made by producers and consumers (for example resource rent taxes in the petroleum and hydropower sectors); and
finally using distortionary taxes to achieve sufficient revenues for society and to realise redistribution objectives.
Furthermore, the tax system must be structured in such a manner that it is not in breach of our obligations under the EEA Agreement. See section 2.6 for further details regarding this.
Since the 1992 tax reform, the tax system has been based on the principles of broad tax bases, low rates, equal treatment of industries, types of enterprises and investments, and symmetrical treatment of income and expenditure. This assists in keeping the costs of taxation down and ensuring that taxpayers are generally treated equally. Broad tax bases that encompass all types of income are a prerequisite for people with equal incomes to be taxed equally, and for the progressive tax system to actually contribute to the intended redistribution. The tax reform in 1992 and changes in subsequent years expanded the tax base to enable there to be better correspondence between taxable income and actual income. The principle of a broad tax base and relatively low rates also guided the tax reforms in 2006 and 2016.
Exceptions and special arrangements that deviate from the standard rules make the tax system less effective. Other taxes need to be increased in order to keep tax revenues at the same level, and the socio-economic costs of taxation tend to increase more than proportionally with tax rate increases. If it is desirable to support a specific activity or specific group, measures on the expenditure side of the budget are often less costly and more targeted. As a general rule, revenues from individual taxes should not be earmarked for specific forms of expenditure. These constraints impede the effective prioritisation of funds via the expenditure side of the budget.
The principle of a broad tax base and relatively low tax rates, with few exceptions and special arrangements, also constitutes the foundation for a simpler tax system. The tax system should be as easy as possible for taxpayers to comply with and for the Norwegian Tax Administration to enforce. This entails that the regulations should be structured as simply as possible, and that reporting to the Norwegian Tax Administration should be as least burdensome as possible. A simpler set of regulations will be easier to understand and comply with, and will thereby reduce the administrative costs for taxpayers and the Norwegian Tax Administration. A simple regulatory framework will also enable digitalisation and automation, which is an important prerequisite for further improvements and simplifications of reporting solutions to the authorities. On the whole, simpler regulations will contribute to more efficient use of resources, strengthen the competitiveness of Norwegian business and industry and secure jobs, while at the same time contributing to an easier everyday life for private individuals.
In some instances, there may be conflicts between the different objectives of the tax system. When structuring the tax system, different considerations must therefore be weighed up against each other. A single type of tax should generally not be targeted at multiple objectives.
In Norway, public financing of extensive welfare programmes makes it necessary to maintain substantial tax revenues. Some taxes are also intended to address other important considerations beyond generating central government revenues. This primarily concerns the aim to redistribute income socially and geographically and consideration of health and the environment.
The tax system contributes to redistribution, among other things, because average tax rises with higher income. Tax on wages will tend to reduce the supply of labour, and the tax system should, insofar as possible, support good decisions being made regarding participation in working life, education and career choices.
People with the lowest incomes pay little or no tax. Changes in the income tax system are therefore of little significance to this group. Many people with persistently low incomes are not working. The tax rules should, insofar as possible, be structured in such a way that it is beneficial to work. Moreover, for people who receive National Insurance benefits to compensate for lost earned income as a result of health problems or unemployment, the interplay between the National Insurance rules and tax rules is important for the incentives to return to work or increasing working hours. One challenge in the context of tax and welfare policy is to balance the consideration of protecting living standards with the consideration of providing incentives to work. This is illustrated in Box 2.1, which demonstrates that, in some cases, there may be little financial gain in working rather than receiving National Insurance benefits.
Textbox 2.1 Incentives to work depend on both the tax system and the National Insurance system
Incentives to work are influenced by both the tax rates on wage income and by any net transfers the individual receives. Norway’s income protection system (primarily the National Insurance system) consists of various transfer schemes which ensure that people who, for various reasons, are not part of the workforce, have an income on which to sustain themselves. Examples include disability pensions and unemployment benefit. These National Insurance schemes often lapse entirely or in part when a person starts working, and thus function as an additional “tax” on labour. To illustrate what this means for the incentives to work, it is possible to calculate the effective average tax on labour which takes into consideration both tax and the net transfers lost when a person begins to work. The calculations generally only take into account the level of the transfers, however other aspects of the schemes, for example, time limits on benefit payments and activity requirements for recipients, will also influence incentives to work. The calculations must therefore be interpreted with caution.
Figures 2.2 and 2.3 show some average effective rates of tax on labour when a person transfers from unemployment to full employment (2020 figures for the Nordic countries). The respective calculations are for a sole provider with two children and a couple with two children, where one parent stays at home. The figure shows that the effective tax rate on labour can be considerable. For example, a sole provider with two children who has an income that is 67 per cent of the average will, in reality, be taxed at just under 80 per cent of his/her gross wage income when the loss of unemployment benefit is included.
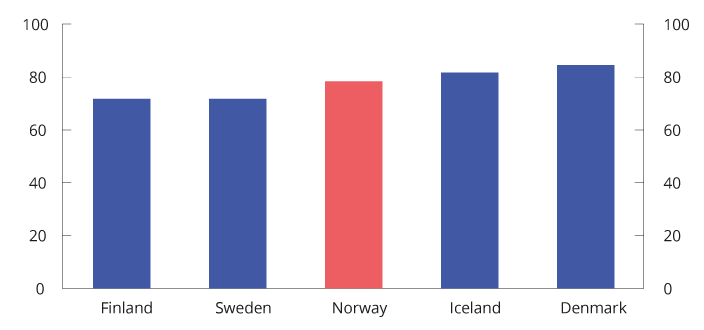
Figure 2.2 Effective average tax when transitioning from the unemployment benefit1 to full-time employment. Single provider2. 2020. Percentage
1 The calculations are based on unemployment benefits in the different countries as calculated in OECD Benefits and Wages 2020. The level of the benefit is the level paid for the first year of unemployment.
2 This is based on 67 per cent of the average wages in the various countries, both as a basis for calculating benefits and as a level of income from employment in full-time employment.
Source OECD and Ministry of Finance.
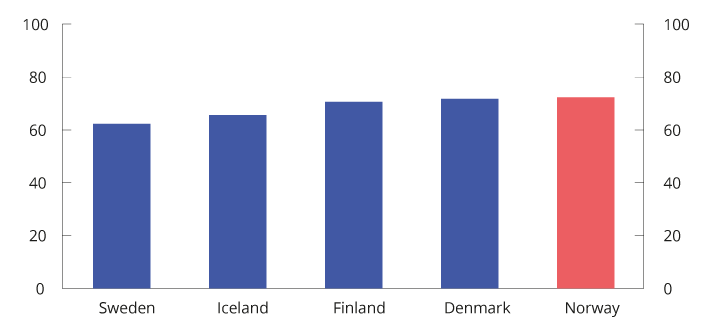
Figure 2.3 Effective average tax when transitioning from the unemployment benefit1 to full-time employment. Couple with one person in the workforce2, two children. 2020. Percentage
1 The calculations are based on unemployment benefits in the different countries as calculated in OECD Benefits and Wages 2020. The level of the benefit is the level paid for the first year of unemployment.
2 This is based on 100 per cent of the average wages in the various countries, both as a basis for calculating benefits and as a level of income from employment when transitioning to full-time employment. The spouse/cohabitant is assumed to be a homemaker.
Source OECD and Ministry of Finance.
Environmental and climate taxes contribute to more accurate pricing of activities that are harmful to the environment and greenhouse gas emissions if they are correctly designed. They motivate individuals and companies to engage in more environmentally and climate-friendly behaviour, which is consistent with the “polluter pays” principle. Revenues from environmental and climate taxes can be used to strengthen welfare schemes and collective benefits, or to reduce other taxes with unwanted distortions in the use of resources. However, environmental and climate taxes can have undesirable distributional effects socially or geographically, and it is important that these types of taxes are correctly structured.
Taxes on businesses should primarily aim to secure revenue for the central government, and should avoid impacting commercial decisions as much as possible. The most consistent and uniform taxation of all real income helps to ensure that resource utilisation is not influenced by, for example, tax-motivated investments. Profits that are taxed should correspond to the actual profits that are made.
Greater mobility of capital, goods and services may imply an increase in the significance of tax differences between countries. Norway needs to have good general tax rules in place to ensure that it can retain and attract commercial activities and capital. However, localisation decisions are based on more than tax. Political stability, good infrastructure, access to well-qualified labour, well-functioning financial markets, property rights and stable and predictable regulations are also important to the overall framework conditions for commercial activities.
In industries that exploit natural resources, an additional return may be generated in the form of resource rent. It is desirable to ensure that society receives a high proportion of the additional return. In isolation, revenues from neutral taxes, such as resource rent taxes, reduce the need for distorting taxes. In Norway, special taxes are levied on the profits generated by petroleum activities and hydropower plants. Through the petroleum tax system and the State’s Direct Financial Interests (SDFI), the central government secures a large proportion of the substantial revenues from the Norwegian continental shelf without hampering investments which are profitable from a socioeconomic perspective. The SDFI functions as a cash-flow tax in fields where the state has retained an ownership interest, however the revenues are not formally treated as tax revenues.
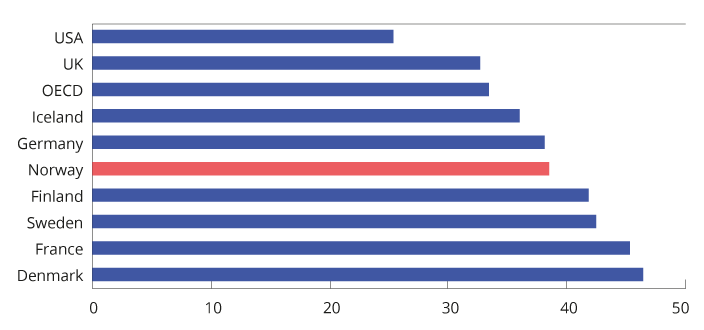
Figure 2.4 Tax revenues as a percentage of GDP in selected countries and the OECD1. 2020. Percentage
1 Non-weighted average for the OECD.
Source OECD Revenue Statistics.
Figure 2.4 compares the tax revenues of various countries as a percentage of gross domestic product (GDP), and provides a rough overview of differences in the size of the public sector between countries and differences in the overall level of taxation. This form of comparison does not take into account sources of revenue other than tax, nor that the share of tax revenues will vary somewhat depending on, among other things, whether public pension and National Insurance payments are liable for tax. The figure shows that Norway has a level of taxation that is higher than the OECD average, however lower than several of the other Nordic countries. In Norway, part of the total expenditures via government budgets is financed by revenues from the Government Pension Fund Global. For 2022, this amounted to approximately 15 per cent of total expenditure via government budgets.
Since 1985, tax revenues in Norway have varied between 38 and 44 per cent of GDP. In Sweden, the tax to GDP ratio has ranged from 42 to 50 per cent, while it has been between 44 and 51 per cent in Denmark. Over the same period the average tax level in the OECD has varied between 32 and 35 per cent of GDP.
2.3 Direct taxes
2.3.1 Income tax for individual taxpayers
Rate structure and tax base
The income tax for individuals is calculated using two different tax bases. Firstly, a flat tax rate of 22 per cent is paid on “ordinary income” less the personal allowance and certain special allowances. Ordinary income comprises all taxable income (wages including taxable benefits in kind, National Insurance benefits, pensions, net self-employed income, taxable income from shares and other forms of capital income), less the minimum standard deduction, deductible losses and expenses such as debt interest, etc., parental allowance and other allowances.
Secondly, National Insurance contributions and bracket tax are paid on “personal income”, which comprises gross wage income, National Insurance benefits and pension income, without deductions. Calculated personal income for self-employed persons is also included in personal income.
High-income earners pay a larger proportion of tax on their incomes than low-income earners. Such progressivity is achieved through the lower threshold for the payment of National Insurance contributions, tax-free allowances (minimum standard deduction and personal allowance) and the rate structure of the bracket tax. The bracket tax comprises five brackets, for which the rates increase for each threshold. Box 2.2 shows how marginal and average tax rates increase with higher wage income. The highest marginal tax rate on wages, excluding employers’ National Insurance contributions, was 47.4 per cent in 2022. If employer’s National Insurance contributions are included, the highest marginal tax rate reaches 53.9 per cent of overall wage cost.
Figure 2.5 shows the highest marginal tax rate on wage income in selected countries in 2021. Employee National Insurance contributions are included in the figure, while employers’ National Insurance contributions are excluded. The figure shows that the highest marginal tax rate in Norway is at a comparable level with the highest marginal tax rate in countries such as the United Kingdom and USA, while some of the other Nordic countries have higher marginal tax rates on wage income.
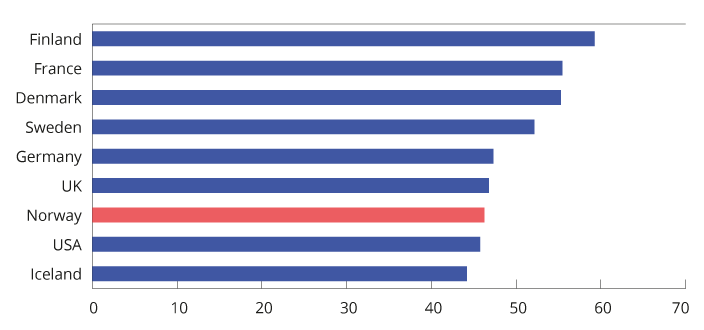
Figure 2.5 Highest marginal tax rate on wage income, excluding employer contributions to employee National Insurance schemes. Some selected countries in 2021. Percentage
Source OECD Tax database and the Swedish Tax Agency.
Tax on pension income
Special tax rules for pensioners and recipients of some National Insurance benefits result in lower tax payments for these groups than for wage earners. National Insurance contributions on pensions are lower than on wages. On the other hand, the minimum standard deduction is somewhat lower for pension income than for wages.
Textbox 2.2 Calculation of tax on wage income
The marginal tax rate is the tax rate applicable to the last krone earned by a taxpayer. The marginal tax rate influences taxpayer choices with regard to how much to work. A high marginal tax rate may weaken employee incentives to work more. Such labour supply distortions imply that resources are allocated less efficiently. The higher the tax rates, the greater these distortions. See also Box 2.7, which concerns the effects of reduced taxes on the labour supply.
Average tax is tax as a proportion of taxable income. Under a tax system with tax-free allowances, other allowances and a progressive rate structure, the marginal tax rate is always higher than the average tax rate for the same income level, and those with the highest taxable incomes pay the largest proportion of their income in tax.
The figures below show marginal tax rates and average tax rates, respectively, on wage income under the 2022 rules.
Figure 2.6 shows that the marginal tax rate varies according to the income level. No tax is paid up until the lower threshold for the payment of National Insurance contributions (NOK 64,650). The escalation rate (25 per cent) is paid on income above the lower limit until it is replaced by National Insurance contributions at the ordinary rate (8 per cent) of the entire income, i.e. when the income exceeds NOK 95,074. From an income of NOK 107,870, where income exceeds the sum total of the personal allowance and the minimum standard deduction (46 per cent of income), tax is paid on ordinary income (22 per cent) and the marginal tax rate increases to about 19.9 per cent (8 per cent + 22 per cent × (100 per cent – 46 per cent)). 1.7 per cent is paid in bracket tax from the first threshold in the bracket tax (NOK 190,350), and the marginal tax rate increases to 21.6 per cent. When wage income exceeds NOK 239,022, the taxpayer is permitted the maximum minimum standard deduction (NOK 109,950) and the marginal tax rate increases to 31.7 per cent (8 per cent + 22 per cent + 1.7 per cent.). This marginal tax rate applies up to the threshold for bracket 2 of the bracket tax (NOK 267,900). The bracket tax will then increase to 4.0 per cent, and the marginal tax rate will be raised to 34.0 per cent. The bracket tax thereafter increases to 13.4 per cent at the threshold for bracket 3 (NOK 643,800), and to 16.4 per cent from bracket 4 (NOK 969,200). At these points, the marginal tax rate increases to 43.4 per cent and 46.4 per cent respectively. The bracket tax increases to 17.4 per cent at the threshold for bracket 5 (NOK 2,000,000), and the marginal tax rate increases to 47.4 per cent.
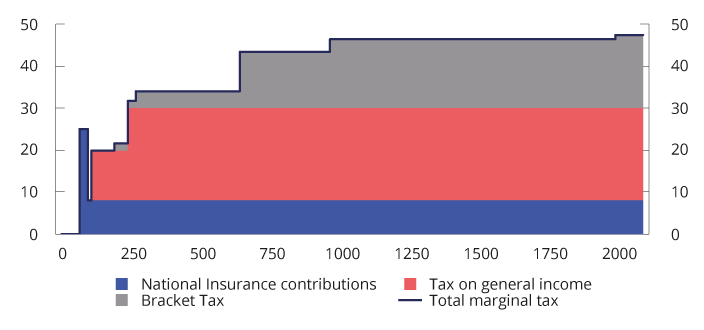
Figure 2.6 Marginal tax excluding employers’ National Insurance contributions at different levels for wage income (NOK 1,000) for a wage earner who only has wage income and standard deductions. 2022 rules. Percentage.
Source Ministry of Finance.
Figure 2.7 demonstrates that the average tax rate increases according to income and is generally considerably lower than the marginal tax rate.
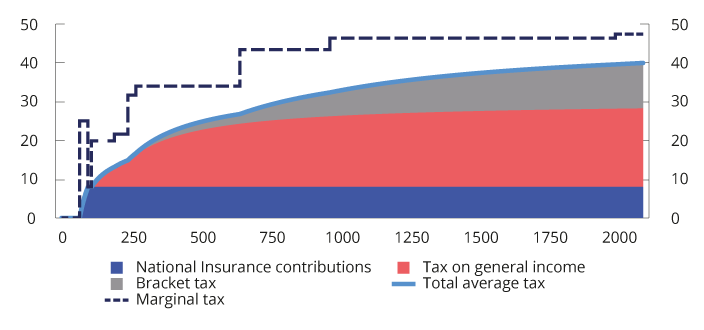
Figure 2.7 Average tax rate on wage income excluding employers’ National Insurance contributions (NOK 1,000) for a wage earner who only has wage income and standard deductions. 2022 rules. Percentage
Source Ministry of Finance.
A special tax allowance for pension income is granted to those on a contractual early retirement pension (AFP) and ordinary retirement pension. The tax allowance results in no tax being paid on any pension income up to about NOK 231,000 in 2022, which is slightly above the minimum pension level for singles. Total tax paid is lower on pensions than on wages above that threshold. The tax allowance is reduced with regard to pension income when it is above a level more or less corresponding to the minimum pension, thus entailing that the difference between the tax on pension income and the tax on wage income declines when the pension income increases.
Figure 2.8 shows tax under the 2022 rules as a proportion of pension income for recipients of contractual early retirement pension (AFP)/ordinary retirement pension and earned income for wage earners. It has been assumed that taxpayers have no other income than pension and wage respectively. It is also assumed that the taxpayers can claim no other deductions than the standard deductions. The tax on a NOK 300,000 retirement pension represents 10.9 per cent of the pension income, while tax as a proportion of the same amount of wage income comes to 18.5 per cent.
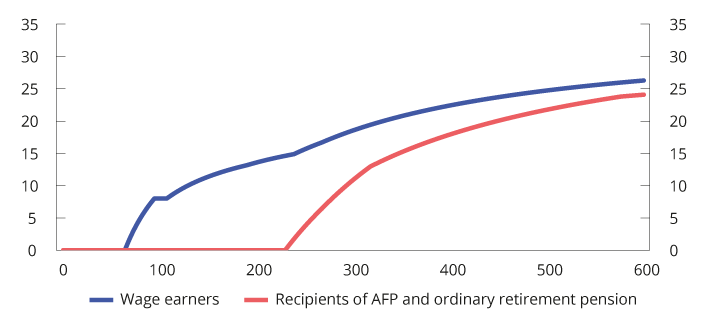
Figure 2.8 Average tax rate at various gross income levels for wage earners and recipients of contractual early retirement pension (AFP) and ordinary retirement pension under the 2021 rules.1 Percentage
1 It has been assumed that the taxpayers only have wage income and pension income respectively, and have no deductions other than standard deductions.
Source Ministry of Finance.
Tax on income from shares earned by individuals
The difference between the highest marginal tax rates on wage income and income from shares should not be too excessive. When there is a significantly lower marginal tax rate on income from shares than on wage income, there is much to be gained from representing what is actually income from work as income from shares in order to pay less tax (income shifting). In 2022, the difference between the highest marginal tax rates on wages and share dividends is 4.4 percentage points; see Figure 2.9.
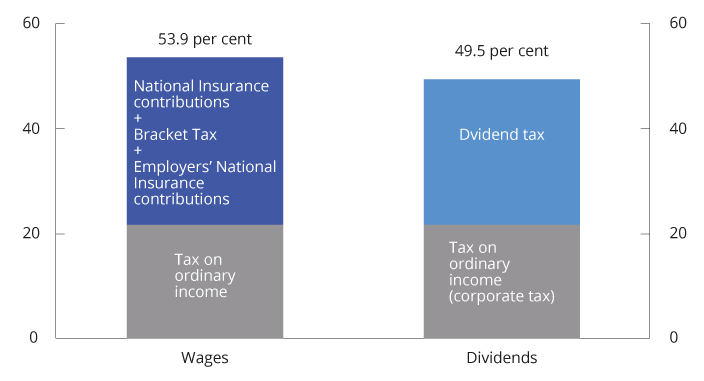
Figure 2.9 Maximum marginal tax rate on wages and dividends under the 2022 rules. Percentage
Source Ministry of Finance.
The shareholder model entails that income from shares in excess of a risk-free return allowance earned by personal shareholders is taxed on the part of the owner. Income from shares in excess of the risk-free return allowance is first multiplied by an upward adjustment factor, and thereafter added to ordinary income. The upward adjustment factor was introduced in 2016 to maintain the desired level for the dividend tax when the tax rate on ordinary income was reduced. For 2022, the overall marginal tax rate for dividends was 49.5 per cent and the upwards adjustment factor was 1.6.
The objective of the risk-free return allowance is to counteract distortions in household investments and the financing structure of companies as a result of dividend taxation. The risk-free return allowance is calculated by multiplying the risk-free return base, which is the cost of the share plus any unused risk-free return allowance from previous years, by a risk-free rate of return. The risk-free rate of return is the interest rate on three-month Norwegian treasury bills plus 0.5 percentage points.
If the income from the share is less than the risk-free return allowance, any unused risk-free return allowance is added to the risk-free return base for the subsequent year. In practice, this means that any unused risk-free return allowance is carried forward with interest. Unused risk-free return allowance is specific to each share, and can be deducted from subsequent dividends and gains on the share.
For practical reasons it is the owner of a share as of 31 December in any given year who is granted the risk-free return allowance for that year. Upon selling the share, the seller can deduct any previously unused risk-free return allowance from any capital gains. In the event of a loss, the entire loss is deductible against ordinary income. Any unused risk-free return allowance will lapse.
Tax on business income
Owners of sole proprietorships are taxed under the enterprise model, while those holding ownership interests in entities assessed as partnerships (general partnerships, limited partnerships and others) are taxed under the partnership model. The principle starting point for both of these models is the same as for taxation of income from shares, i.e. that income not exceeding the risk-free return allowance shall only be taxed once as ordinary income. This entails that there is a high degree of uniformity in the taxation of different types of business entities.
The profits of companies assessed as partnerships are taxed as ordinary income on the part of the owners as these accrue. In addition, any distributed partnership profits in excess of the risk-free return allowance are taxed once more as ordinary income on the part of owners who are natural persons.
Income from a sole proprietorship that exceeds the risk-free return allowance is taxed as calculated personal income and is subject to bracket tax and National Insurance contributions. The calculated personal income is therefore taxed on an ongoing basis. However, income from shares is not taxed as ordinary income until the time of dividend payment or realisation. This difference must be viewed in connection with the fact that sole proprietorships are not separate legal entities. Therefore, the distribution of funds will only represent a transfer of funds within the owner’s own financial sphere.
The self-employed pay higher National Insurance contributions than wage earners on personal income from self-employment. On the other hand, the self-employed do not pay employers’ National Insurance contributions on their personal income. However, in some cases the self-employed receive lower National Insurance benefits than wage earners. Self-employed fishermen pay National Insurance contributions at a medium rate (like wage earners), however are also subject to a product tax on first-hand sales of fish.
2.3.2 Corporate taxation
Employers’ National Insurance contributions
Employers in both the private and the public sector are required to pay employers’ National Insurance contributions on payroll costs. The rate of employers’ National Insurance contributions depends on where the enterprise is located. The scheme for differentiated employers’ National Insurance contributions entails that enterprises in sparsely populated areas are subject to lower employers’ National Insurance contributions than enterprises in other municipalities. The rate for employers’ National Insurance contributions varies from zero in the action zone in the county of Troms og Finnmark to 14.1 per cent in central areas, cf. Table 1.10. The objective of the scheme is to counteract a decline in the population in sparsely populated areas by stimulating employment and commercial activity in areas with specific rural challenges. The scheme for regionally differentiated employers' ontributions involves state aid. The EFTA Surveillance Authority (ESA) has been notified about the current scheme. The scheme has been approved for the period from 2022 to 2027 on specific conditions stipulated for the period. No changes can be made to the aid without a new approval from the ESA. Employers’ National Insurance contributions result in an increase in the marginal tax rate on wages, see Figure 2.9.
Ordinary corporate tax
Company profits are taxed as ordinary income at a flat rate of 22 per cent in 2022. Losses can be carried forward and deducted from subsequent profits. The corporate tax system places a particular emphasis on the principles of equal treatment of different investments, forms of funding and organisational forms, as well as the symmetrical treatment of income (gains) and costs (losses). Among other things, this entails that taxable profits should, insofar as possible, be determined in accordance with corporate profits. “Durable and significant” assets must be capitalised under various asset groups and depreciated at rates intended, in principle, to reflect their expected annual depreciation.
As a general rule, the exemption method entails that companies are exempted from the taxation of dividends received and profits on shares, etc. At the same time, there is no right to deduct corresponding losses. The objective of the exemption method is to avoid chain taxation in the corporate sector, i.e. that dividends and profits are taxed multiple times for companies owned by other companies.
The corporate tax rate in Norway remained unchanged at 28 per cent from 1992 to 2013. The rate was then gradually reduced to 22 per cent from 2014 to 2019. A corporate tax rate of 22 per cent is slightly below the OECD average, but somewhat higher than the average for Sweden, Denmark and Finland; see Figure 2.10.
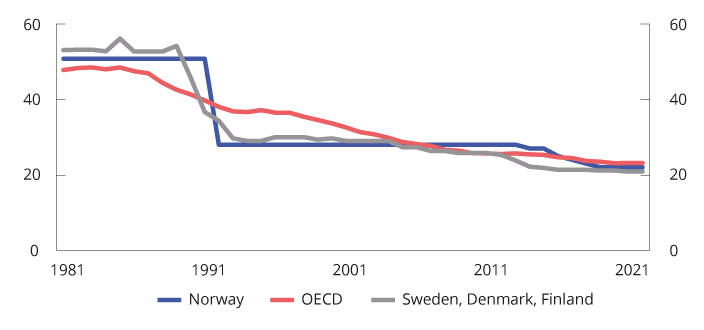
Figure 2.10 Formal corporate tax rates.1 1981– 2022. Percentage
1 Non-weighted average for Sweden, Denmark and Finland and for the OECD.
Source OECD and Ministry of Finance.
The effective taxation of companies will also depend on the tax base. The effective average tax rate is tax paid as a proportion of a company’s actual profit. The effective rate is lower than the formal tax rate if there are tax credits on investments, for example, through generous depreciation options. The effective average tax rate is the key variable when a company decides which country to invest in for tax reasons. The effective marginal tax rate is the key variable when a company decides the level of investment.
Table 2.1 shows formal tax rates and calculated effective average and marginal tax rates in selected countries in 2020. Effective tax rates are calculated on the basis of a hypothetical investment which offers a given return, etc., and take into consideration both formal tax rates and key parts of the tax base (depreciation rates, etc.). The calculations assume a hypothetical investment across selected investment objects, and that the investment is partly funded by equity and partly by debt.
Table 2.1 Formal and calculated effective corporate tax rates in 2020. Percentage
Country | Formal tax rate | Effective average tax rate | Effective marginal tax rate |
|---|---|---|---|
Ireland | 12.5 | 14.1 | 12.3 |
United Kingdom | 19.0 | 20.1 | 22.3 |
Finland | 20.0 | 19.6 | 18.7 |
Switzerland | 21.1 | 18.6 | 12.4 |
Sweden | 21.4 | 19.4 | 14.5 |
Denmark | 22.0 | 19.8 | 14.6 |
Norway | 22.0 | 20.8 | 18.2 |
Greece | 24.0 | 22.9 | 20.6 |
Netherlands | 25.0 | 22.5 | 16.6 |
Austria | 25.0 | 23.1 | 18.8 |
Spain | 25.0 | 29.0 | 32.5 |
Belgium | 25.0 | 24.9 | 19.2 |
USA | 25.8 | 27.5 | 26.7 |
Canada | 26.2 | 23.9 | 20.9 |
Italy | 27.8 | 23.8 | 16.5 |
Japan | 29.7 | 34.1 | 38.1 |
Germany | 29.9 | 28.9 | 23.3 |
France | 32.0 | 31.5 | 29.0 |
Source OECD, Leibniz Centre for European Economic Research (ZEW) (TAXUD/2020/DE/308, Effective Tax Levels Using the Devereux/Griffith Methodology – Final Report 2020).
Company profits are also taxed on the part of their owners, by way of dividend and capital gains taxation, cf. Section 2.3.1. Figure 2.11 shows the total formal marginal tax rate on dividends on the part of companies and their owners in selected countries in 2022.
Technological developments have contributed to the emergence of new business models, and have increasingly made it possible for companies to service markets without having a physical presence. This places pressure on the international tax framework, which was established at a time when companies had a stronger geographical affiliation to the countries in which they operated. International tax adjustments and harmful tax competition have long been high on the political agenda in Norway and internationally. During the period from 2013 to 2015, the member countries in the OECD and G20 conducted the Base Erosion and Profit Shifting (BEPS) Project. This resulted in an agreement being reached on a number of measures to combat profit shifting and erosion of the tax base, and Norway has implemented several of these measures. However, digitalisation of the economy poses other challenges than profit shifting. The G20 Forum and the OECD Inclusive Framework, which consists of 141 member states and jurisdictions, arrived at a political agreement in 2021 regarding changes to the principles for international taxation. The Inclusive Framework statement describes the framework and main elements of an international reform process for the taxation of large multinational corporations.
Petroleum taxation
There are significant extraordinary profits (resource rent) associated with the extraction of oil and gas. Income from petroleum extraction is therefore subject to a special tax in addition to ordinary corporate tax. The special tax is 71.8 per cent in 2022. A calculated corporate tax can be deducted from the basis for the special tax, thus giving an effective special tax rate of 56 per cent.
For both tax bases, revenues from the sale of crude oil are valued at administratively determined norm prices. For ordinary income, investments are depreciated over six years.
Since 2022, the special tax has been structured as a cash flow tax, with immediate expensing of investments. If a company operates with a loss in the special tax base, the taxable value of the loss is paid in connection with the tax assessment. The cash flow tax will mean that projects which are profitable before the special tax will also be profitable after the special tax.
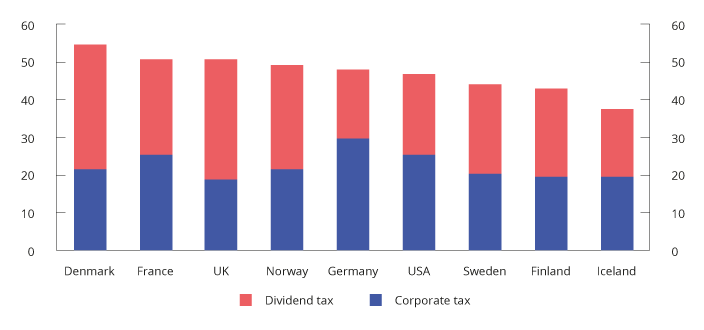
Figure 2.11 Total marginal tax rate on dividends on the part of companies and their owners in selected countries. 2022. Percentage
Source OECD.
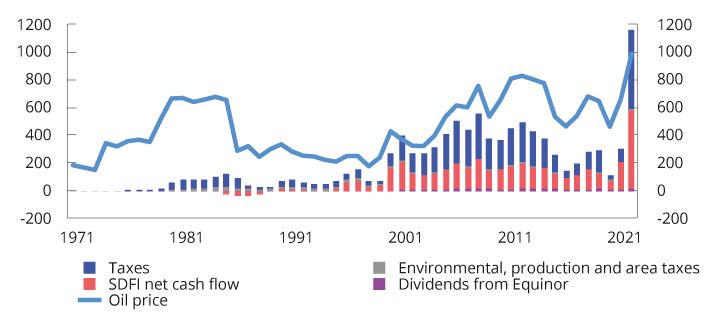
Figure 2.12 Total net central government revenues from the petroleum sector (NOK billion) and developments in oil prices (NOK per barrel). NOK 2022 prices1
1 Estimates for 2022.
Source Ministry of Finance.
Temporary rules for the petroleum tax were introduced in spring 2020, cf. Proposition 113 L (2019–2020) and Recommendation 351 L (2019–2020). The temporary rules entail that investment costs and uplift of 17.69 per cent can be expensed immediately in the special tax base. The rules include investment costs incurred in 2020 and 2021, as well as investment costs covered by the plan for development and operation (PDO) or plan for installation and operation (PIO) submitted to the Ministry of Petroleum and Energy prior to 1 January 2023 and approved by the Ministry prior to 1 January 2024. In addition, payment of the taxable value of losses and unused uplift can be claimed for the 2020 and 2021 income years. Under the temporary rules, the value of the investment deductions is higher than in a neutral petroleum tax.
The SDFI, through which the central government takes a direct financial interest in licences, is also an important source of central government revenues from the Norwegian continental shelf. The SDFI has the same characteristics as a field-specific cash flow tax, whereby the central government covers its share of investments and operating costs on an ongoing basis and receives the same share of the income.
Figure 2.12 shows the composition of central government revenues from petroleum activities. The central government’s revenues are based on the net profits from these activities, and tax revenues will thereby automatically adjust to changes in oil prices and changes in industry profitability.
Hydropower taxation
The profits of power companies are taxed as ordinary income in the same manner as for other companies. Resource rent tax to the central government is also calculated with a formal tax rate of 47.4 percent in 2022. Resource rent-related corporate tax can be deducted from the basis for resource rent tax so that the rate of effective resource rent tax is 37 per cent.
The resource rent tax is structured in such a way that projects which are profitable before resource rent tax are also profitable after the resource rent tax. However, power plants with generators below 10 MVA are exempted from the resource rent tax. The basis for the resource rent tax (resource rent income) is calculated as a standardised market value of the power generated (actual power generated multiplied by spot market prices), less operating expenses, licence fees, and property tax. Since 2021, the resource rent tax has been structured as a cash flow tax, with immediate expensing of investments. Investments made prior to 2021 will continue to be deducted through depreciation and uplift. Negative resource rent income in one power plant can be coordinated with positive resource rent income in other power plants within the same consolidated tax group. Furthermore, the taxable value of any negative resource rent income following coordination between power plants is paid out.
Power companies are also subject to a natural resource tax (paid to local and regional government) of NOK 0.013 per kWh. Natural resource tax is deductible, krone by krone, in relation to the assessed tax to the central government. In addition, power generators pay a licence fee and normally property tax to the municipalities that are hosting them. They must also relinquish concessionary power.
Taxation of shipping companies
Since the 2007 income year, companies taxed as shipping companies have been exempt from tax on shipping income, and only pay a tonnage tax. The tonnage tax is an annual tax calculated based on the net tonnage of ships, the rate of which varies between different tonnage intervals. The rate may be reduced for ships, etc., that meet environmental requirements stipulated by the Norwegian Maritime Authority. A number of requirements are set to qualify for a tax exemption under the shipping tax scheme, including that the company owns or leases ships of a certain size and that are travelling over a certain distance. For example, the scheme does not include ships that are in scheduled traffic between Norwegian ports with shorter distances, fishing vessels or pleasure craft, etc.
Financial activity tax
A financial activity tax on wages and profits was introduced in 2017 to compensate for the absence of value added tax in the financial sector. The sale and distribution of financial services are exempted from value added tax, primarily because it would be difficult to establish a suitable basis for calculating tax on margin-based services, for example, the interest margins of banks. The financial activity tax applies to financial undertakings and comprises a 5 per cent tax on payrolls (the basis for employers’ National Insurance contributions) and a tax on company profits, whereby the tax rate on ordinary income is three percentage points higher than for other undertakings.
2.3.3 Tax on capital assets
Wealth tax
Individual taxpayers pay wealth tax at a rate of 0.95 per cent on their taxable net wealth, i.e. gross wealth less debt, that exceeds a tax-free allowance of NOK 1.7 million in 2022. Spouses are granted a joint tax-free allowance of NOK 3.4 million. For net wealth that exceeds NOK 20 million, wealth tax is paid at a rate of 1.1 per cent. The wealth tax makes the overall tax system for individuals more progressive than income tax in isolation. This is illustrated by Figures 2.13 and 2.14.
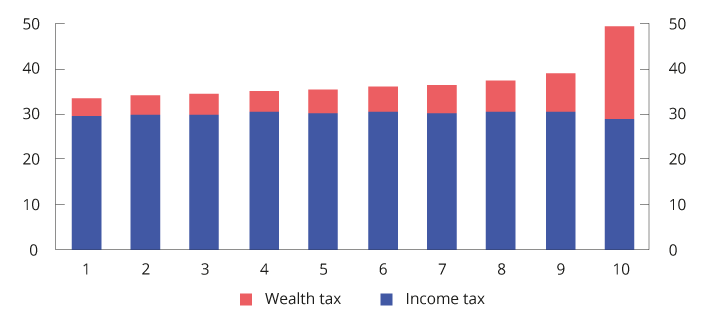
Figure 2.13 Tax as a share of gross income for the 1 per cent with the highest net wealth1 in 2020. Percentage
1 The individuals are divided into equal sized groups according to net wealth.
Source Statistics Norway and Ministry of Finance.
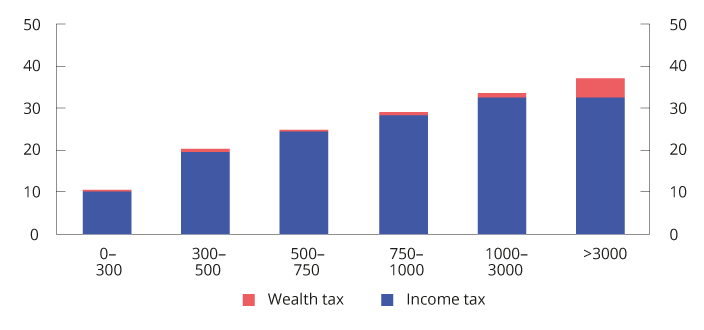
Figure 2.14 Tax as a proportion of gross income in various intervals for gross income (NOK 1,000) in 2020. Percentage
Source Statistics Norway and Ministry of Finance.
In principle, the taxable value of assets is equal to their market value. However, a number of assets are, in part, valued well below market value. Primary dwellings (the residential property in which one lives) are valued at 25 per cent up to an estimated market value of NOK 10 million, while the excess value is valued at 50 per cent. Secondary dwellings (residential properties other than the primary dwelling, which are not commercial property or holiday homes) are valued at 95 per cent. The capital value of holiday homes is based on historical construction costs and, unlike primary and secondary dwellings, is not determined as a proportion of the estimated market value. However, the capital value of holiday homes must constitute maximum 30 per cent of the market value. The valuation of shares and fixed assets, including commercial property, was increased from 55 per cent to 75 per cent from 2022. Owners of primary and secondary dwellings and commercial property may have the calculated value reduced to a lower documented value (safety valve). Deductions for debt are granted when assessing wealth tax. Debt attributed to primary dwellings, holiday homes, bank deposits etc., is valued in full. Debt attributed to commercial property, secondary dwellings, shares and fixed assets is valued with the same formal percentage as the asset. Debt is allocated proportionally based on the proportion of gross wealth accounted for by the various assets.
The proportion of people paying wealth tax has declined over time due to increases in the tax-free allowance. It is estimated that approximately 13.7 per cent of taxpayers will pay wealth tax in 2022, cf. Figure 2.15. The average amount of tax for those who pay wealth tax has generally increased over the period and this increase has been at its highest level during the past year.
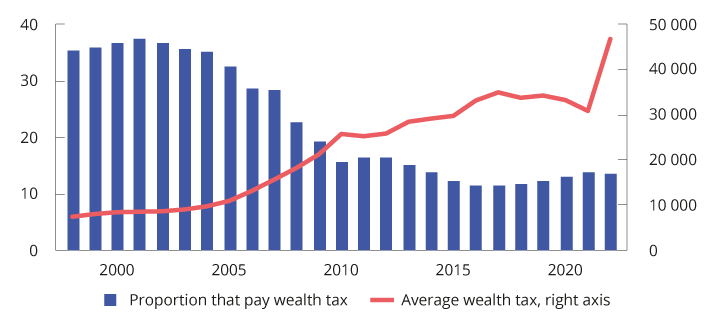
Figure 2.15 Proportion of people (resident in Norway and 17 years or older) paying wealth tax1 and average wealth tax. 1998–2022. Estimates for 2021 and 2022. NOK 2022 prices
1 Wealth tax before any reductions as the result of the 80 per cent rule (only relevant for 1998 – 2008).
Source Statistics Norway and Ministry of Finance.
Property tax
Each municipality decides whether to levy property tax within the limitations laid down in the Property Tax Act. The revenues will accrue in their entirety to the municipality. The property tax rate must be between 0.1 and 0.7 per cent of the valuation basis and for residential properties and holiday homes the maximum tax rate is 0.4 per cent in 2022. The basis for property tax must be determined by ordinary valuation every tenth year. Alternatively, the municipalities may choose to use the bases for wealth tax in their valuation of residential properties. 111 municipalities are exercising this option in 2022 and the basis for property tax will thus develop in line with market prices. The municipalities must use a reduction factor of at least 30 per cent when valuing residential properties and holiday homes. They may also apply a tax-free allowance to reduce the valuation basis. Since 2017, municipalities have been able to choose to exempt holiday homes from property tax. Six municipalities are exercising this option in 2022. Property tax on power plants is governed by special valuation rules based on production value that is subject to minimum and maximum limits.
As of 2022, 320 of the 356 municipalities had introduced property tax, of which 253 levied the tax on residential properties in all or parts of the municipality. Total property tax revenues to the municipalities were approximately NOK 15.6 billion in 2021, of which NOK 7.6 billion was property tax on residential properties and holiday homes. Figure 2.16 shows developments in municipal property tax revenues from 2007 to 2021, divided among “residential properties and holiday homes” and “other properties”.
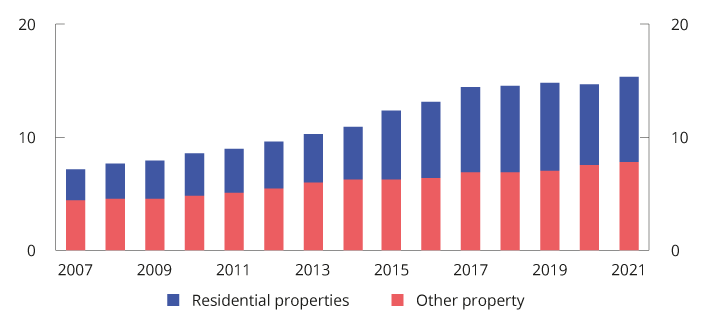
Figure 2.16 Municipal property tax revenues 2007–2021. Billion. NOK 2021 prices
Source Statistics Norway (KOSTRA).
Tax on capital assets internationally
Box 2.3 provides an overview of tax revenues from capital assets in the OECD countries.
Textbox 2.3 Tax revenues from capital assets in the OECD countries
The OECD tax statistics provide an overview of revenues generated by different types of taxes. Taxes on capital assets include taxes on the use, ownership and transfer of capital assets, including real estate. Capital gains taxation is not included. In the case of Norway, municipal property tax, wealth tax and stamp duty are all included.
For some countries, there may be a difference between the gross and net tax on capital assets. This applies to, for example, the US, where many taxpayers can deduct any local property tax paid when calculating the federal income tax. The OECD figures are based on non-weighted averages of gross taxes.
Figure 2.17 shows revenues from taxes on capital assets in selected OECD countries. In Norway tax revenues from capital assets account for 3.4 per cent of overall tax revenues. This is well below the OECD average of 5.4 per cent. At the same time, it is important to emphasise that the OECD figures include different taxes that have different effects on behaviour. For many of the countries, property taxes on real estate account for the largest share. In the estimate for Norway, wealth tax constitutes a larger share. This also includes wealth tax on assets other than real estate, including shares, etc. If we exclude property tax, the figure shows that other taxes on capital assets are high in Norway when compared with the other countries.
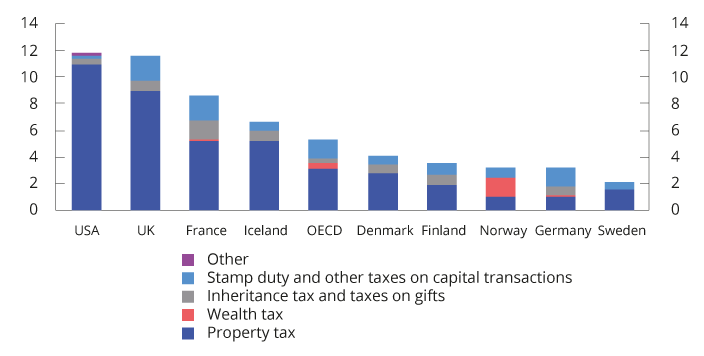
Figure 2.17 Tax on capital assets. Percentage of total tax revenues. 20201
1 Figures for the OECD are non-weighted averages for the countries that reported for 2020.
Source OECD Revenue Statistics Database and Ministry of Finance.
2.4 Indirect taxes
2.4.1 Value added tax
Value added tax is a general tax on the domestic consumption of goods and services which is intended to raise revenues for the central government. Value added tax is collected and paid by businesses that are subject to value added tax. Value added tax is calculated for all parts of the sales chain. Enterprises that are subject to value added tax qualify for deductions for input value added tax on their purchases. This contributes to preventing taxable enterprises in the sales chain from being charged the tax, and that it thereby taxes the final consumption of goods and services. Moreover, since the tax is only charged on final consumption, it does not result in adjustments in production.
The standard rate of value added tax in Norway is 25 per cent. Denmark and Sweden also apply a standard rate of 25 per cent. The rates in the Scandinavian countries are high by international standards. Revenues from value added tax as a share of GDP are higher in Norway than the OECD average, however somewhat lower than in Denmark and Sweden. Box 2.4 compares value added tax systems in various OECD countries.
Textbox 2.4 Value added tax rates and bases in OECD countries
Value added tax has been introduced in about 170 countries. On average, value added tax revenues now account for 20 per cent of the overall tax revenues of the OECD countries.
The OECD compares the value added tax systems of each of the member countries, and the ability of the different systems to raise revenues. This is done by comparing the actual value added tax revenues of a country with what such revenues would have been if all consumption, both private and public, had been subject to the standard rate applied in that country. If all consumption is taxed at the standard rate of value added tax, the value added tax revenues as a proportion of consumption will also be equal to the value added tax rate. A number of factors may cause the revenue proportion to be lower than the standard rate. For example, the use of reduced rates and exemptions contributes towards reducing the revenue proportion. The revenue proportion may also be influenced by factors relating to tax collection and compliance, including the extent of tax planning, evasion and fraud. Although the revenue proportion needs to be interpreted with caution as an indicator of the efficiency of the value added tax system, it may serve to illustrate how effectively the value added tax system functions. Furthermore, the phasing out of reduced rates and exemptions would have made it possible to maintain central government revenues at a lower rate.
Figure 2.18 presents the standard value added tax rates for Norway, the OECD average and a selection of other countries. The figure also presents value added tax revenues as a proportion of consumption. The standard rate of value added tax is as high in Norway as in Denmark and Sweden, however value added tax revenues as a proportion of consumption are nonetheless somewhat lower. New Zealand has a value added tax system with one uniform rate and few exemptions. Consequently, virtually all consumption is taxed at the standard rate, including public sector consumption.
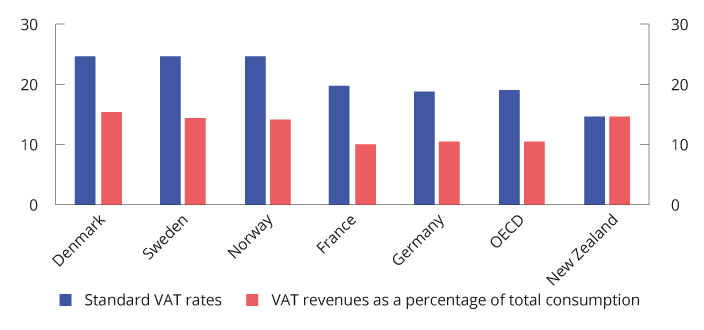
Figure 2.18 Standard VAT rates and VAT revenues as a percentage of total consumption. 2018
Source OECD (2020) Consumption Tax Trends and Ministry of Finance.
While the current value added tax is, as a main rule, a general tax on consumption, it is subject to various exceptions and reduced rates. In Norway, foodstuffs are subject to a reduced rate of 15 per cent, while a number of services are subject to a low rate of 12 per cent.
Some goods and services are exempted by way of a so-called zero-rating, which entails full deductibility of value added tax on inputs for goods and services, however no value added tax is calculated on sales. A number of services are excepted from the value added tax system, including financial services, health services and teaching. Enterprises outside the value added tax system are granted no deductions in respect of any value added tax on goods and services which they procure.
The use of reduced rates and exceptions means that one moves away from a simple, general system with a uniform rate on all consumption of goods and services. Value added tax will thereby influence the composition of consumption and production, as well as the choice between internal production and external supplies in sectors exempted from value added tax. In addition, the administrative costs are higher. The value added tax system is not well suited for safeguarding distributional considerations, supporting specific objectives or for moving consumption in a desired direction. If, for example, the intention is to reduce the consumption of goods that are considered harmful to individuals and society, it would be more effective to use excise duties.
2.4.2 Excise duties
Excise duties are intended to finance government expenditure, however are also used as policy instruments for pricing the socio-economic costs of using products that are environmentally harmful or detrimental to health and for influencing the behaviour of consumers in the desired direction.
Excise duties on specific products will shift consumption away from the products that are subject to the tax. Therefore, excise duties are suitable policy instruments for reducing production or consumption that is harmful to the environment or health. Some excise duties are solely intended to raise central government revenues and are often referred to as fiscal taxes. An example of such a tax is the stamp duty on the sale of real estate. Other taxes are also intended to influence behaviour. This applies, first and foremost, to the environmental taxes and to the taxes on alcohol and tobacco.
The purpose of a tax has a bearing on its design. In order to limit the socio-economic costs of taxation, fiscal taxes should not be levied on manufactured intermediate goods. On the other hand, environmental taxes that are intended to put a price on an environmental problem should include all sources of the environmental problem, and the tax rate should reflect the environmental damage.
Environmental taxes
Norway’s first environmentally motivated tax was the tax on the sulphur contents of mineral oils, which was introduced in 1970. The use of environmental taxes did not become more extensive until the late 1980s and early 1990s.
Environmental taxes ensure that market prices reflect the social costs of environmentally harmful activities to a greater extent and therefore serve to curtail such environmentally harmful activities. The revenues from environmental taxes can be used to reduce other distortionary taxes.
The use of environmental taxes is consistent with the “polluter pays” principle. This principle entails that the polluter must also pay for the costs that the environmentally harmful activities impose on others in society.
The cost of reducing emissions or other environmentally harmful activities may vary between different sectors of the economy, and the authorities do not have complete information as to the magnitude of such costs for different enterprises and households. A correctly designed environmental tax should subject all sources of a specific emission to one uniform tax rate. This facilitates reductions in emissions at the lowest possible cost to society (cost effectiveness). Emission allowances are another cross-sectoral policy instrument that can have similar effects to those of environmental taxes. Emission allowances and taxes are discussed in further detail in Box 2.5.
Textbox 2.5 The relationship between taxes and emission allowances
Environmental taxes put a price on the costs environmentally harmful activities inflict on society. This makes it financially attractive for the polluters to take steps to reduce emissions, either in the form of reduced production, changing production methods or by introducing abatement measures that cost less than the tax. By imposing a tax, the authorities put a price on polluting emissions, but do not directly control emission volumes. On the other hand, under an emissions trading system, the authorities put a cap on emission volumes, while emission prices are determined by the market. However, the cost of the implemented abatement measures will be determined by the emission allowance price established in the emission allowance market, and will depend on the supply of and demand for, emission allowances.
When the price of emission allowances equals the tax, environmental taxes and emission allowances will deliver the same reductions in emissions. If the emission allowances are auctioned, these allowances can generate the same central government revenues as the tax. This is because the residual emissions will correspond to the total volume of emission allowances. The polluters will therefore be willing to pay a price for the emission allowances that is equivalent to the tax. If the emission allowances are allotted free of charge, the authorities will forfeit these revenues and thus forgo the opportunity to reap further socio-economic benefits by reducing other taxes.
When environmental taxes function as intended, they contribute to a reduction in environmentally harmful activity. This will reduce central government revenues. This may explain some of the decline in revenues from environmental taxes in recent years. If environmental taxes are replaced by emission allowances that are not sold (so-called free emission allowances) or other policy instruments, this will contribute to central government revenues declining even further. Reduced revenues from environmental taxes may entail that other taxes need to be increased in order to maintain the level of tax revenues.
The use of environmental taxes in Norway is extensive, including when compared with industrialised countries in and outside of Europe. Virtually all use of fossil energy in Norway is priced through taxes and/or the emissions trading system, and there are relatively high tax rates for the use of fossil energy products. The OECD regularly calculates the effective carbon price for energy use in the OECD and G20 countries and prepares a carbon price score for each country. The carbon price score describes how far the country has progressed in pricing emissions from energy use. A carbon price score of 100 per cent means that all emissions from energy use are priced on a par with the reference price or higher. Correspondingly, a carbon price score of 0 per cent means that no emissions from energy use are priced on par with or above the reference price. Figure 2.19 shows that for a reference price of 60 euros per tonne of CO2 and when excluding CO2 emissions from biomass combustion, Norway had a carbon price score of 77 per cent in 2018. Only Switzerland has a higher carbon price score. In comparison, Denmark has a carbon price score of 69 per cent, Finland has a carbon price score of 63 per cent and Sweden has a carbon price score of 62 per cent. Norwegian carbon prices have increased significantly since 2018. In 2022, virtually all emissions from the use of fossil energy were priced at above 60 euro. An equal and gradually increasing carbon price in all countries would have resulted in a cost-effective reduction in global emissions by the cheapest cuts in emissions being taken made first. Different pricing also entails the risk of carbon leakage. This means that reductions in emissions in a country with high pricing take place through the relocation of operations to countries with lower prices, without this resulting in appreciable reductions in global emissions.
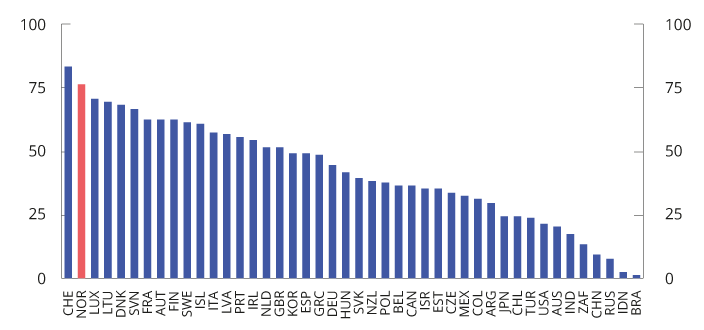
Figure 2.19 Carbon price score for energy use in the OECD and G20 countries in 2018 when using a reference price of EUR 60 per tonne of CO2 equivalents. Excludes CO2 emissions from biomass
Source OECD.
In 2022, the standard tax level on greenhouse gas emissions not subject to the EU Emissions Trading System (ETS) is NOK 766 per tonne of CO2 equivalents. In comparison, the average allowance price for 2022 is estimated at about NOK 834 per tonne of CO2. The allowance price has risen sharply in recent years, and the estimate for the average allowance price in 2022 is about three times as high as the corresponding estimate for 2020. Some sectors are subject to both the ETS and a CO2 tax. Effective and explicit prices for greenhouse gas emissions faced by the various sectors in Norway are shown in Figure 2.20. Box 2.6 provides a more detailed explanation of the difference between explicit and effective carbon prices.
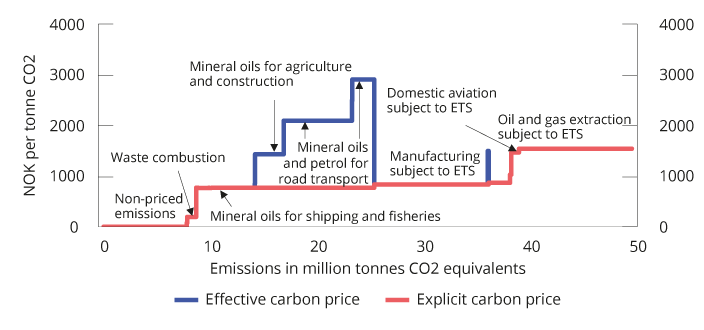
Figure 2.20 Effective and explicit prices on greenhouse gas emissions in different sectors. Tax level in NOK per tonne of CO2 equivalents in 2022 and allowance price of NOK 834 per tonne of CO2. The emissions figures are from 2020
Source Statistics Norway, Norwegian Environment Agency and Ministry of Finance.
Textbox 2.6 Effective and explicit carbon prices
Explicit carbon prices are pricing mechanisms that normally take the form of taxes or emissions trading systems, whereby the purpose of the taxes or the emissions trading system is to set a price on the emissions. Conversely, when calculating effective carbon prices, the impact of all taxes or emissions trading systems is aggregated irrespective of the objective. In Norway, the explicit carbon prices consist of the European Union Emissions Trading System (EU ETS) and climate taxes. In some sectors, mineral oils and petrol are also subject to a base tax or road usage duty. These are taxes which have objectives other than reducing greenhouse gas emissions, but which nevertheless increase the effective carbon price. For example, the aggregate total of the road use duty and the CO2 tax on mineral products will constitute the effective carbon price for road traffic.
It is the effective carbon price that influences the price of activities that produce greenhouse gas emissions, and it is only when the effective carbon price is adjusted that emissions can be expected to be affected. Measures of effective carbon prices are therefore important for understanding how changes in the tax system can influence greenhouse gas emissions.
A cost-effective climate policy implies that all greenhouse gas emissions are priced equally, measured according to explicit carbon prices. This follows from the fact that emissions of a greenhouse gas, measured in CO2 equivalents, are equally harmful to the climate irrespective of where this occurs or who emits it. When all emissions are subject to the same explicit carbon price, emissions will be reduced where this costs the least. Emissions targets can therefore be achieved at the lowest possible cost to society by increasing the explicit carbon price.
Comparing explicit carbon prices shows whether the carbon pricing has been designed in a cost-effective manner. However, it is not necessarily appropriate for all sources in the economy to be subject to the same effective carbon price. Among other things, this is because external costs other than climate can vary considerably between different sectors.
Different explicit pricing of greenhouse gas emissions increases the total costs of reducing national emissions, and the total costs hit their lowest level when everyone is subject to the same explicit carbon price. However, there may be several reasons for why environmental taxes or emission trading systems are not cost-effectively designed.
Environmental taxes on energy products are often imposed in addition to taxes that price other socio-economic costs associated with energy use. The environmental effect will be the result of the combined tax level. The road use duty on fuel, which is intended to price external costs for road traffic excluding CO2 emissions, also contributes to limiting the consumption of petrol and diesel and thereby to reducing, among other things, emissions of CO2. The base tax on mineral oils was partly introduced for fiscal reasons, but was also introduced with the goal of preventing an environmentally undesirable transition from electrical heating to the use of heating oil.
In addition to environmental and energy taxes, there are other taxes that are fiscally motivated, however that also serve environmental objectives. This applies to, for example, the one-off registration tax for motor vehicles, which is differentiated on the basis of, among other things, CO2 and NOX emissions. Taxes on fuels and motor vehicles account for a large portion of the environmental-related taxes.
Health and social-related taxes
Consumption can result in social or health-related costs to society that are not reflected in market prices. The consumption of alcoholic beverages and tobacco products are examples of this. The consumption of these products imposes costs on society in the form of health expenses covered by society and adverse effects for those who do not consume these products. Consumers do not necessarily pay sufficient attention to the long-term effects of their consumption, or they ignore adverse effects. The taxes on alcoholic beverages and tobacco products raise revenues for central government, however also contribute to the prices of these products including, to a greater extent, the costs imposed on society when consuming them.
A high level of tax on consumer goods may be circumvented by cross-border shopping, smuggling and illicit distillation of alcohol. The health effects of taxation must be weighed against the social costs associated with these activities.
2.4.3 Customs duties
Customs duties serve to protect domestic producers from foreign competition. Import duties normally result in more expensive goods for consumers and higher production costs for business and industry. In addition, customs duties may limit the range of goods available to consumers. Furthermore, customs duties reduce trade volumes and prevent countries from fully utilising their comparative advantages in the production of goods and services. Trade in goods and services has enabled Norway to utilise its competitive advantages. Upper limits on customs duties are established through international agreements.
Norway is currently one of the countries in the world with the lowest customs barriers for manufactured goods. Certain types of clothes and textiles are the only manufactured goods subject to customs duties. Customs protection for agricultural products is a key agricultural policy instrument for ensuring emergency preparedness and security of supply for food in Norway. Import protection can contribute to a greater degree of domestic production of agricultural products, self-sufficiency and agriculture throughout the entire country. The customs duty rates for agricultural goods are highly variable, depending on the need for protection.
Like other industrialised countries, Norway grants preferential customs treatment to developing countries under the GSP (Generalized System of Preferences) scheme. The scheme involves individual industrialised countries granting developing countries better market access for their goods. GSP is a unilateral scheme and can, in principle, be revoked or amended.
2.5 Fees and sectoral taxes
The provision of services and exercise of authority by the central government are normally funded by appropriations via the national budget, however fees and sectoral taxes are used in some areas. In 2006, the Ministry of Finance established overarching provisions for central government funding through fees and sectoral taxes. These provisions were revised in 2015. Fee schemes may be established when the public sector performs a clearly defined service for the payor, and payment is not made in respect of anything else or more. Therefore, cost-appropriate financing through fees is not to be considered taxation. However, fees that are set at a level that is higher than the cost of producing and delivering the service will have an element of hidden taxation.
Sectoral taxes serve a broader purpose as a source of funding, and changes to the base or rate of sectoral taxes are therefore classified as part of the tax programme. According to the provisions, considerable restraint should be exercised when introducing sectoral taxes to fund central government expenditure. However, sectoral taxes may be used to fund joint measures for an industry or sector if such taxes are paid by stakeholders belonging to or closely affiliated with the sector. For example, the operations of a number of supervisory bodies are funded in full or in part by sectoral taxes.
2.6 Work with the EEA and tax
There is no obligation under the EEA Agreement to harmonise Norwegian tax rules with EU regulations and directives. Norway is therefore not required to have common tax rates with the EU, and we decide ourselves which revenues and transactions to include in our tax base. However, the general provisions in the EEA Agreement relating to the Four Freedoms set clear restrictions on the Norwegian tax rules. The same applies to the EEA Agreement’s rules pertaining to state aid, when such aid is provided through the tax system. Norway’s compliance with these EEA obligations, including in relation to tax, contributes to safeguarding access to the internal market for Norwegian individuals and companies on a par with individuals and companies in the other EEA states. The EFTA Surveillance Authority (ESA) in Brussels and the EFTA Court in Luxembourg have overarching responsibility for monitoring compliance with the EEA Agreement. The ESA may raise matters relating to Norwegian tax rules at its own initiative or on the basis of complaints filed with the ESA by Norwegian or non-Norwegian individuals and companies that are of the view that a Norwegian tax rule violates EEA law.
Internally in Norway, the government and Storting are responsible for ensuring that the tax rules are in accordance with the EEA Agreement. In individual cases, the tax rules’ compliance with EEA law is enforced by the Norwegian Tax Administration, the Tax Appeal Board and possibly the Norwegian courts. Norwegian courts have the authority to submit EEA matters to the EFTA Court for an advisory opinion on how EEA law is to be understood.
The Four Freedoms – the right to free movement of goods, services, capital and persons/establishments – entail that Norway cannot, as a general rule, have rules treating cross-border movements and transactions between Norway and other EEA states more restrictively than purely domestic movements and transactions. Such differential treatment would be considered a barrier to the freedom of cross-border movement. In the area of indirect taxation, this entails, among other things, that goods and services must be subject to the same value added tax in the Norwegian market, irrespective of whether the goods are produced, or the service provider is established, in Norway or in another EEA state. In the area of direct taxation, the dividend taxation rules provide an example of Norwegian tax legislation having been amended as a result of the EEA Agreement.
However, in some cases, Norway can maintain or introduce rules that would, in principle, entail an element of discrimination, if there are so-called justification grounds. It is primarily the European Court of Justice that has, through case law, outlined what legitimate considerations can justify tax rules that would, in principle, be held to discriminate between domestic and cross-border movements. In the area of taxation, it is particularly the consideration of a balanced allocation of taxation authority between the member states and counteracting tax avoidance that can justify a discriminatory rule. Efficient tax collection is also a relevant consideration. It is also a condition that the rule is appropriate and necessary for purposes of catering to the relevant consideration, and does not go further than is justified by the said consideration.
Based on such justification grounds, Norway has, for example, the right to tax shareholders who emigrate from Norway on the part of the gain on the shares that accrued while the taxpayer was residing/domiciled in Norway, despite the gains on the shares not having been realised upon emigrating from Norway.
The EU has recently adopted directives that not only permit, but also require member states to introduce tax rules that would generally be considered restrictive. This illustrates the fact that there are certain instances in which the consideration of free movement must be subordinate to the need to counteract tax avoidance. As mentioned, the EEA Agreement does not require Norwegian rules to be harmonised with these tax directives, however the directives can indicate how far the considerations behind the four freedoms are deemed to extend when these conflict with the need to prevent tax avoidance.
The prohibition against state aid entails that, as a starting point, Norway cannot apply tax rules that give individual enterprises, or groups of enterprises, more favourable tax treatment than they are entitled to under the main rule applicable to such enterprises. Such advantages will constitute state aid and have undesirable effects on competition. This applies both to preferential treatment of individual enterprises and preferential treatment for certain sectors or geographical areas. The prohibition applies even if the state aid is given equally to both Norwegian and foreign enterprises, and is therefore not conditional upon discrimination in the cross-border cases.
The assessment of whether a tax rule constitutes state aid is carried out according to an established procedure under EEA law. It is first assessed whether the tax exemption constitutes an economic advantage, and thereafter whether this advantage is selective, i.e. favours certain enterprises or specific groups of enterprises. Furthermore, the advantage must impact competition and affect trade between the EEA states.
If a proposed tax rule will constitute state aid (constitutes a selective advantage, distorts competition and affects trade), there is a legal basis in the EEA Agreement to deem the state aid to be lawful. This is termed “compatible aid”. The European Commission and the ESA have established supplementary guidelines on what can be considered compatible aid. Among other things, this includes aid for regional development, environmental purposes, training purposes, research and development, and aid to small and medium-sized enterprises. The guidelines tend to be very comprehensive and stipulate strict conditions for such aid to be considered compatible.
The Norwegian authorities have to notify the ESA of any tax rules that they consider qualify as compatible aid, and the ESA needs to approve such aid before it can be implemented, pursuant to the guidelines or directly under the provisions relating to state aid in the EEA Agreement. In some cases the notification process may take several months, and may continue over several years in more complex cases. Exemptions from the notification requirement have been made in the so-called General Block Exemption Regulation. Aid that satisfies the conditions set out in this regulation may be implemented without a notification process and only requires notification to the ESA. Examples of aid under the General Block Exemption Regulation are reduced electricity tax for the industry (environmental support) and aid through the Skattefunn incentive scheme (support for research and development). In some cases, the aid may be permitted without notification or reporting. This applies to aid that satisfies the criteria in the regulation for de minimis aid. Among other things, the conditions include an overall upper limit for all such aid to an enterprise, which entails that the aid is considered to have such little impact on trade that it can be provided without notification or reporting to the ESA.
Each year, the Ministry of Finance considers a number of tax matters for which the EEA Agreement is relevant. In connection with this, the Ministry has regular meetings and correspondence with, among others, the ESA and the European Commission. This work contributes towards safeguarding Norway’s interests in the tax area, while at the same time complying with the obligations under the EEA Agreement.
2.7 Distributional effects of the tax system
There are many complex factors that influence the development of economic disparities. Economic cycles and structural factors influence the distribution of market revenues. See discussion in Report No. 1 (2022–2023) to the Storting, National Budget for 2023. The tax system helps to redistribute these revenues, among other things, by being progressively designed (the average tax rate increases in line the level of income or wealth). The tax revenues are also a source of financing for transfers to households and public services in areas such as health and education, which also has an equalising effect.
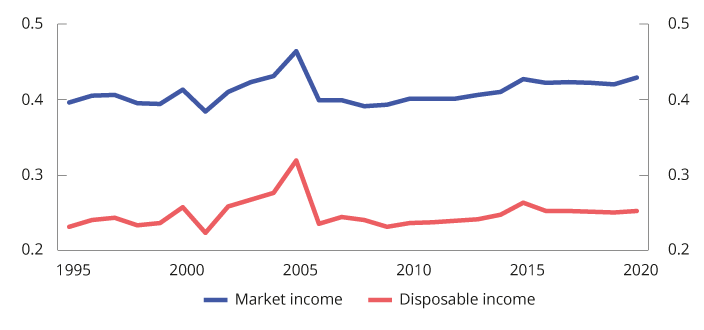
Figure 2.21 Gini coefficient of market income and disposable income.1 Percentage. Equivalent income (EU scale). 1995–2020
1 Fluctuations around the years 2000, 2005 and 2015 must be viewed in the context of changes to the tax rules that have resulted in temporary tax adjustments.
Source Statistics Norway.
The significance of direct taxes on individuals to income distribution
The tax system makes a significant contribution to the redistribution of income. Taxes and transfers reduce income inequality by about 40 per cent.1 The total contribution made from taxes and transfers to equalisation has been relatively stable over the past 30 years, see Figure 2.21.
The progressivity of the income tax system ensures direct redistribution, whereby those who earn the most also contribute more. Figure 2.22 shows the average assessed tax as a share of gross income for different income groups in selected years. The progressive nature of the tax system is clearly exhibited by the fact that the average tax as a percentage of income rises with the level of income. The progressivity has increased in recent decades in the upper part of the income distribution. In 1994 and 2004 those with the very highest incomes paid less in tax as a percentage than other high and middle-income groups. The introduction of a dividend tax in the 2006 tax reform particularly contributed towards an increase in the average tax as a percentage of income for the highest income groups.
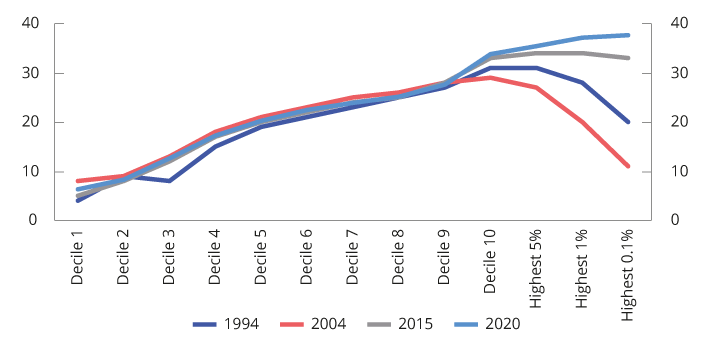
Figure 2.22 Average tax as a proportion of gross income. Percentage
Source Statistics Norway.
The significance of indirect taxes to income distribution
When examining how the tax system influences household consumption opportunities and welfare, one should ideally take into account the fact that indirect taxes also influence consumption opportunities. Indirect taxes do not depend on the individual’s income or wealth and are not an appropriate distribution policy instrument. Unlike direct taxes, indirect taxes are not normally levied directly on consumers, but indirectly via producers and importers of the relevant goods and services. The extent to which the tax burden is reflected in the prices charged to consumers depends, among other things, on the supply of and demand for the goods and services subject to such tax. However, no information is available that would show whether the tax burden is carried by individuals or businesses, respectively, or how this tax burden is divided across various income intervals. The Ministry does not provide estimates for distributional effects of changes in any given indirect tax. In Figure 2.23, the Ministry has specified aggregated revenues from indirect taxes by income decile based on the Lotte-Konsum model.
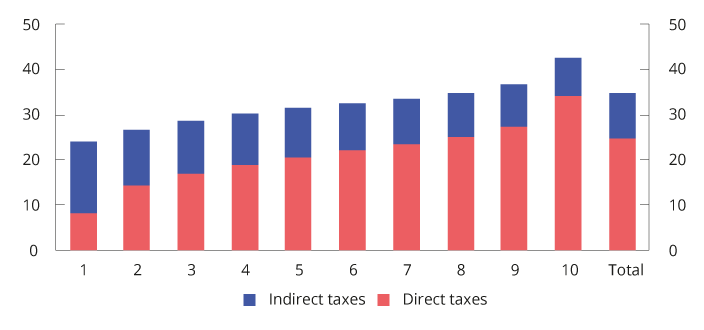
Figure 2.23 Taxes per person as a percentage of equivalent income according to income deciles. 2022 rules. Per cent
Source Statistics Norway and Ministry of Finance.
In the figure, individuals are assigned a share of household income, adjusted for economies of scale (equivalent income), and ranked according to rising income in ten equally sized groups (income deciles). Correspondingly, the individuals have been allocated a share of the direct and indirect taxes paid by their household.
The figure shows that people on low incomes have a lower overall tax burden than people on high incomes. At the same time, indirect taxes contribute to weakening the progressivity of the tax system. This is partly because the calculations are based on gross household income. People with high gross incomes pay a larger proportion of their gross income in tax than people with low gross income, and thus have a smaller proportion of their income available for consumption. It is income after direct tax that can be consumed, and thus be subject to indirect taxes. Therefore, the taxes will constitute a smaller proportion of the gross income of a person with high gross income than that of a person with a low gross income. If the calculations were based on income after tax (disposable income), this tax burden would have been more equal as a proportion of income across the various income groups.
2.8 Estimated tax expenditures and tax sanctions
The tax system includes a number of exemptions and special arrangements which contribute to reducing government revenues. When compared with taxation under the ordinary rules, these exemptions and special arrangements represent an advantage to those within their scope.
The Norwegian tax system is based on the principle that all income and assets should be taxed, and that the tax base must correlate with the actual, financial values. However, when this is not the situation in some cases, this may, for example, be due to a political desire to safeguard other considerations or to serve specific purposes.
Correspondingly, the tax system may feature tax sanctions, i.e. that a tax is sometimes levied that is higher than what is stipulated in a general and uniform set of rules or key principles. One example is fiscal taxes on input factors in business activities.
Unlike measures funded via the expenditure side of the budget, the Storting does not decide the level of tax expenditures and tax sanctions in the annual budgets. Tax expenditures are therefore not subject to annual budgetary priorities in the same way as schemes on the expenditure side. This section is therefore intended to provide supplementary information and highlight the budgetary effects of deviations from the tax rules. The overview of such exemptions is not complete due to the fact that, among other things, it has not been possible to quantify all tax expenditures.
The extent of tax expenditures and tax sanctions depends on how the reference system is defined. As a main rule, the standard tax rules are used as a basis. In some areas the main principles underpinning the structure of the tax system are applied in accordance with how these were established in, among other things, the 1992, 2006 and 2016 tax reforms. Examples include depreciation rates, the taxation of residential properties and certain indirect taxes. Like most other countries, the Ministry uses the revenue-foregone method, i.e. the tax expenditures are estimated as the tax revenues foregone by government as the result of more lenient rules than those that would be indicated by the reference system. These calculations do not take into account changes in behaviour. Therefore, in many cases, the calculations will not represent a realistic estimate of the actual revenue losses caused by tax expenditures.
Figure 2.24 shows how net tax expenditures in 2022 are divided among different areas. Exemptions in the value added tax system are the largest tax expenditure and account for approximately 26 per cent of overall tax expenditure. Tax expenditures associated with the corporate taxation of petroleum activities account for about 8 per cent. Discounts in the wealth tax amount to 19 per cent, while lower income tax and stamp duty on residential properties account for about 20 per cent of total tax expenditures. Tax expenditures relating to financial capital and pension savings account for about 7 per cent of the total tax expenditures, whilst the regionally differentiated employers’ National Insurance contributions and tax expenditures relating to wages and pensions account for 9 per cent and 4 per cent respectively. Excise duties account for 6 per cent of overall net tax expenditures and primary industries account for 1 per cent.
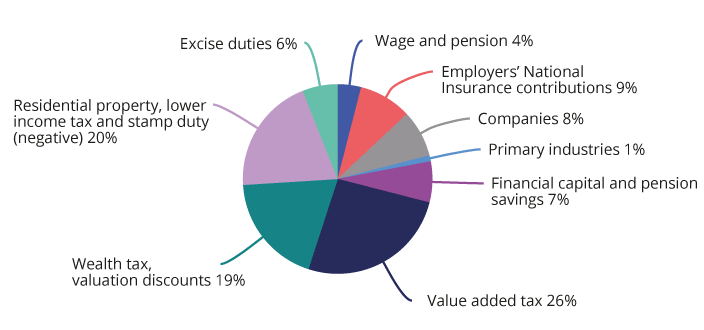
Figure 2.24 Net tax expenditures in 2021 divided among different areas. Percentage
Source Ministry of Finance.
2.9 Methods for calculating revenues
Changes to the tax rules will normally affect government tax revenues. The effects of changes in the tax rules on central government revenues are often referred to as revenue effects, and differ from changes in tax revenues caused by other developments, including economic cycles. A sound basis for decision-making needs to include information on the revenue effects of proposed changes to the tax rules.
The Ministry of Finance uses a number of different methods for estimating the revenue effects of tax changes. These methods vary from sophisticated models to simple estimates based exclusively on statistics. The method used will depend on which models have been developed, the data that are available and the deadline by which the calculation has to be made.
The calculation methods are summarised below.
2.9.1 Reference system and reference alternative
Reference system for the tax rules
The revenue effects of changes in the tax rules in the budget year are calculated in relation to a reference system for the tax rules. A defining feature of the reference system is that taxes are kept unchanged in real terms from the year prior to the relevant budget year. This means that limits and rates2 in the tax rules are adjusted annually in line with estimates for the relevant growth factor, for example, growth in consumer prices, wages, pensions or asset values.
The reference system for direct taxes is based on the tax rules applicable in the current year, with allowances and income thresholds under the standard rate structure for individual taxation being, as a main rule, adjusted in line with estimated wage growth. A taxpayer who only qualifies for a standard deduction (personal allowance and minimum standard deduction) and has growth in both ordinary income and personal income that is identical to estimated wage growth will therefore be subject to approximately the same average income tax in the reference system as in the current year. The rules for pension tax are adjusted based on the growth in the minimum level of the retirement pension and the growth in the ordinary retirement pension. Correspondingly, the tax-free allowance in the wealth tax in the reference system is adjusted such that a person with a wealth composition equal to the average is subject to the same wealth tax in the reference system as in the current year, measured as a proportion of the wealth. Special allowances and certain other limits on individual taxation are adjusted by the estimated inflation rate.
Under the reference system for excise duties, all per unit rates are adjusted in line with estimated inflation (changes in the consumer price index). This means that the tax burden under this reference system remains unchanged in real terms. The reference system for value added tax is based on the current regulations for value added tax.
Reference alternative for tax revenues
The revenues that would be generated if all taxes remained unchanged in real terms constitute the reference alternative for the tax revenues. The reference alternative is determined by the reference system for the tax rules and by estimated developments in the tax base. Tax base projections are based on factors such as estimated macroeconomic developments.
2.9.2 Revenue calculations that do not incorporate behavioural effects
The most basic form of revenue calculation assumes that the tax change has no influence on the behaviour of households and businesses. The revenue effect will therefore only reflect the direct effect on tax revenues. For example, the revenue effect of a change in the tax rate is calculated as the tax base multiplied by the change in the tax rate.
For the budget year in which a tax rule is changed, revenue calculations that only include direct effects will, in many cases, provide a good approximation of the revenue effects. This particularly applies in the instances in which there is little reason to assume that the change will occasion significant short term behavioural changes or appreciably affect other tax bases.
2.9.3 Revenue calculations that incorporate behavioural effects
Changes to taxes and certain government expenditure items may influence government finances beyond the immediate, direct budgetary effect. This is because such changes may influence the behaviour of businesses and households. For example, an increase in an excise duty will normally result in an increase in the price of the relevant goods, and thus a reduction in demand for such goods.
It is reasonable to assume that it will take time for changes to the taxation of wage income and pension income to induce behavioural changes with a permanent impact on labour supply. Many people have fixed working hours and are therefore unable to change these without finding a new job or renegotiating their existing employment contracts. For these reasons, it will, as a general rule, be most relevant to incorporate the revenue effects in the budget without behavioural changes.
However, in some cases it may be relevant to already include behavioural effects in the first year. Financial adjustments generally occur relatively swiftly, while changes in the real economy take more time. For example, dividends more than halved from 2000 to 2001 as a result of the temporary dividend tax in 2001. Changes to indirect taxes may also have a fairly rapid impact on consumption. Therefore, as a general rule, the Ministry incorporates behavioural effects in the budget estimates for indirect taxes. In some cases, it may also be appropriate to assume that there will be relatively rapid adaptations to certain changes in the income tax for individuals. One example is the restructuring of taxation of pensioners in 2011, which the Ministry assumed would have some impact on the labour supply in the first year.
In some cases, the adjustments may occur before the tax change has entered into effect. One example is the dividend tax introduced as part of the 2006 tax reform. Many personal shareholders adapted to the announced dividend tax by distributing large dividends before the reform entered into force. The extraordinary dividends distributed prior to the reform were to a large extent channelled back to the companies in the form of loans and new equity. The announced increases in dividend tax in 2016 and 2022 also resulted in strong dividend growth up until the end of the year. Another example is the restructuring of the one-off registration tax on motor vehicles. When the budget proposal was presented in October 2006, it became evident that cars with low CO2 emissions would be subject to a lower one-off registration tax after 1 January 2007, while cars with high CO2 emissions would have a higher one-off registration tax. This resulted in purchases of car models that would be subject to a lower tax being postponed, while purchases of car models that would be subject to a higher tax were accelerated.
A revenue calculation incorporating behavioural effects will normally only include the direct effect on tax revenues by the tax base being directly affected by the rule change. The revenue calculation will thus take into account both the rule change and how the resulting behavioural changes on the part of households and businesses will influence the tax base.
In some instances, it should be taken into consideration that changes to one tax base will have behavioural effects that also influence other tax bases. The rule change will therefore have an indirect effect on tax revenues via a tax base that is not directly affected by the rule change. For example, an increase in the tax on spirits will not only increase the price of spirits, but will also reduce demand for spirits. The increase may also shift alcohol consumption away from spirits and towards wine or beer. Therefore, an increase in the tax on spirits may increase the revenues from the tax on wine and beer.
Textbox 2.7 Self-financing of reduced tax on labour
When tax rates are reduced, some of the immediate loss in revenue can generally be offset by the fact that the tax base grows over time. For taxes on labour, this is due to the fact that more people work more. Tax cuts can therefore be self-financing to some degree. The degree of self-financing expresses how much of the tax cut the central government gets back due to an increased tax base. There is considerable uncertainty regarding the degree of self-financing, and this will vary between different taxes. The table below presents estimates of the self-financing ratio from Statistics Norway’s simulation model LOTTE-Arbeid when different assumptions are applied.
For example, a self-financing ratio of 6 per cent (as estimated for a reduced tax rate on ordinary income) means that about NOK 6 million of an immediate loss in revenue of NOK 100 million will be recouped after a certain period of time as a result of increased labour supply and thereby a higher tax base. There is considerable uncertainty associated with these estimates.
The immediate loss of revenue in these calculations includes all taxpayers (i.e. wage earners, self-employed persons, National Insurance recipients and pensioners, etc.), while the counteracting effect via increased labour supply largely only includes wage earners in the 26–62 age group. Increased labour supply will also affect other parts of the national budget, including expenditures for National Insurance benefits and revenues from corporate tax and value added tax. Such effects have also not been taken into account in these calculations.
Table 2.2 Estimates of the self-financing ratios for tax cuts through various changes in tax rates, thresholds and deductions. Reference for 2023
Change in tax rate, threshold or deduction | Self-financing ratio |
|---|---|
Reduced tax rate for bracket tax, bracket 3 | 10% |
Increased threshold for bracket tax, bracket 3 | 9% |
Reduced tax rate for ordinary income for individuals | 6% |
Reduced National Insurance contributions on wages/benefits and self-employed income | 5% |
Reduced tax rate for bracket tax, bracket 2 | 4% |
Increased threshold for bracket tax, bracket 2 | 2% |
Increased limit for maximum minimum standard deduction in wages/benefits | 1% |
Reduced tax rate for bracket tax, bracket 1 | 0% |
Increased threshold for bracket tax, bracket 1 | 0% |
Increased personal allowance | 0% |
Increased rate for the minimum standard deduction in wages/benefits | -16% |
Source Statistics Norway (LOTTE-Arbeid) and Ministry of Finance.
Footnotes
Measures of income inequality and the redistributive contribution of the tax system are based on income and wealth statistics. There are several sources of income that are not included in the income and wealth statistics, for example, various benefits in kind, unrealised gains and returns on owner-occupied dwellings.
Tax rates as a percentage, for example, the rates for value added tax and National Insurance contributions, are kept unchanged in the reference system from the previous year.