2
2.1 The Norwegian Economy
The Norwegian economy has passed its cyclical peak, but wage and price growth remain high. Going forward, we estimate that employment will remain high and unemployment low. Inflation is expected to decline, but it will take time before it returns to its 2 per cent target.
Activity in the Norwegian economy remains high, but growth is levelling off
Activity in the Norwegian economy remains high, but there are significant differences between industries and the outlook varies. In Norges Bank’s regional network, the offshore supply industry and service industries report higher growth and a positive growth outlook. In the building and construction industry, as well as in the retail sector, firms expect activity to continue to decline. Overall, fewer businesses are now reporting capacity constraints, see Figure 2.1.
We project GDP for mainland Norway to increase by 0.6 per cent in 2023 and by 0.8 per cent in 2024. Higher interest rates and inflation are expected to dampen demand in the Norwegian economy and lead to a decline in household consumption and housing investment in 2023. In 2024, positive real wage growth is expected to boost household consumption, while housing investment will continue to decline. At the same time, we expect the improvement in the international competitiveness of Norwegian businesses caused by the Norwegian krone depreciation to boost activity in the Norwegian economy going forward.
We expect capacity utilisation in the Norwegian economy to decline somewhat in the coming years, although unemployment in 2024 is still expected to remain below the average of the last 20 years, see Figure 2.2.

Figure 2.1 Capacity utilisation1 and labour shortages2. Shares in per cent. Q1 2005–Q2 2023
1 Percentage share of regional network contact businesses that would have some or significant problems in increasing production/sales without mobilising additional resources, such as labour or machinery.
2 Percentage share of regional network contact businesses responding that labour shortages are curtailing production/sales. The question about labour supply has only been asked to the companies that have stated that they are operating at full capacity. However, the series shows the proportion of all respondants that took part in the the survey.
Source: Norges Bank.

Figure 2.2 Unemployment as a percentage of the labour force. 2000–2025. Projections for 2023–20251
1 Unemployment figures from 2020 and 2021 have been excluded from the average because the labour market was heavily affected by lockdowns due to infection control measures in these years.
Sources: Norwegian Labour and Welfare Administration and the Ministry of Finance.
The Norwegian krone has depreciated
The Norwegian krone has depreciated significantly over the past year, see figure 2.3. The main reason is probably that other central banks have raised interest rates higher and more rapidly than Norges Bank. The Norwegian krone has been 8 cent weaker so far this year than during the same period last year. The Norwegian krone has also been weaker than in the pre-pandemic years.
For the tradable sector, the Norwegian krone depreciation serves to strengthen international competitiveness and improves profitability. For businesses that incur costs in foreign currency and earn their revenues in Norwegian kroner, however, a krone depreciation serves to reduce profitability. The firms most heavily exposed to currency risk have likely hedged their exposure. Norwegian krone depreciation also serves to increase inflation. This happens directly, by making imported goods more expensive, but also indirectly, by making imported intermediate goods more expensive, leading to cost increases that businesses are likely to fully og partly pass on to households. Norwegian krone exchange rate developments will have a major impact on the Norwegian economy in the time to come. This report makes the technical assumptions that the Norwegian krone will depreciate by 6.5 per cent from 2022 to 2023 before appreciating by 1.8 per cent from 2023 to 2024.
Table 2.1 Main aggregates for the Norwegian economy. Percentage volume change from previous year, unless otherwise stated
NOK billion1 | |||||
|---|---|---|---|---|---|
2022 | 2022 | 2023 | 2024 | 2025 | |
Private consumption | 1,806.4 | 6.8 | -1.0 | 0.5 | 2.2 |
Public consumption | 1,037.2 | 0.1 | 2.0 | 1.6 | - |
Gross fixed capital investment | 1,095.5 | 4.3 | -0.5 | -1.5 | 0.4 |
Of which: Petroleum extraction and pipeline transportation | 176.0 | -6.5 | 9.1 | 2.3 | -6.2 |
Businesses in mainland Norway | 448.8 | 14.5 | 2.3 | -1.9 | -2.4 |
Housing | 232.1 | -1.4 | -15.0 | -4.0 | 15.6 |
Public administration | 237.8 | 1.2 | 0.4 | -2.2 | - |
Mainland Norway demand2 | 3,762.2 | 4.9 | -0.5 | 0.1 | 1.8 |
Exports | 3,100.6 | 5.9 | 4.8 | 3.8 | 3.0 |
Of which: Crude oil and natural gas | 1,972.9 | 0.3 | 3.9 | 4.1 | 1.6 |
Goods and services from the mainland | 937.4 | 9.4 | 5.3 | 3.4 | 3.7 |
Imports | 1,521.5 | 9.2 | 1.9 | 1.3 | 1.7 |
Gross domestic product | 5,570.7 | 3.3 | 1.0 | 1.1 | 1.9 |
Of which: Mainland Norway | 3,570.9 | 3.8 | 0.6 | 0.8 | 1.9 |
Other key figures: | |||||
Employment | 3.9 | 1.3 | 0.1 | 0.5 | |
Unemployment rate, LFS (level) | 3.2 | 3.5 | 3.7 | 3.7 | |
Unemployment rate, registered (level) | 1.8 | 1.8 | 2.0 | 2.1 | |
Annual wages | 4.3 | 5.5 | 4.9 | - | |
CPI | 5.8 | 6.0 | 3.8 | 2.5 | |
CPI-ATE | 3.9 | 6.4 | 4.1 | 2.7 | |
Gas price, USD per MMBtu (current prices) | 33.1 | 13.6 | 16.0 | 14.3 | |
Crude oil price, USD per barrel (current prices) | 99 | 78 | 73 | 71 | |
Three-month money market rate (level)3 | 2.1 | 4.2 | 4.8 | 4.3 | |
Import-weighted Norwegian krone exchange rate4 | 1.2 | 6.5 | -1.8 | 0.0 |
1 Provisional national accounts figures for 2022 in current prices. Growth rates from this level are stated in volumes.
2 Excluding inventory changes.
3 Technical assumption based on forward prices in August.
4 A positive number indicates Norwegian krone depreciation.
Sources: Statistics Norway, Norges Bank, Norwegian Labour and Welfare Administration, Reuters, ICE, Macrobond and the Ministry of Finance.

Figure 2.3 Import-weighted exchange rate index (I-44)1. Index. 1995=100. Jan 2005–Sep 20232
1 I-44 is a calculated exchange rate index based on exchange rates between NOK and the currencies of Norway’s 44 most important trading partners measured by import value. A higher index value means Norwegian kroner depreciation and the axes have therefore been inverted.
2 The figure for September 2023 shows the average up to and including 27 September.
Source: Norges Bank.

Figure 2.4 Gross fixed capital investment; mainland industries, housing and petroleum. NOK billion at fixed 2020 prices. 2000–2025. Projections 2023–2025
Sources: Statistics Norway, Ministry of Petroleum and Energy, Norwegian Petroleum Directorate and Ministry of Finance.
Business investments are forecast to remain high
Mainland business investments have increased significantly and were last year at their highest level since records began in 1970. We project investments to remain at this high level for the next couple of years, see figure 2.4. While the manufacturing industry is still expecting strong investment growth, in part due to climate adaptation and high profitability stemming from the Norwegian krone depreciation, high costs and lower demand are dampening investment expectations in the retail sector and other industries.
Petroleum investments are expected to grow both this year and next, after declining in each of the last three years, see Figure 2.4. The projected increase should be viewed in the context of the large number of new development projects that have been approved in recent years. Higher investments on the Norwegian continental shelf will impact the mainland economy and is expected to boost manufacturing activity going forward.
We expect unemployment to remain low and employment to remain high
Registered unemployment has increased slightly since the start of the year, but the labour market remains tight. Employment has in the first half of this year increased more than projected in the revised budget last spring, see Figure 2.5. Unemployment remains low, and the number of vacancies is very high. Labour demand has nevertheless slowed as growth in the economy has abated.
Registered unemploymentwas 1.9 per cent of the labour force at the end of August. This is slightly higher than at the end of 2022, but below the pre-pandemic level and significantly below the average of the last 20 years, see Figure 2.2. Unemployment as measured by the Labour Force Survey (LFS), which also captures jobseekers other than those who register with the Norwegian Labour and Welfare Administration, has also remained low so far this year, although it is slightly higher than at the same time last year. The LFS unemployment rate is also below the average of the last 20 years.
We expect employment to continue to increase slightly next year and the employment rate to remainin high. Unemployment is nevertheless expected to increase slightly from its current very low level. Nevertheless, the registered unemployment rate is still projected to remain below its average of the past 20 years both this year and next year.

Figure 2.5 Cumulative employment growth since Q4 2019. Seasonally adjusted figures. 1.000 persons
Source: Statistics Norway.
Inflation remains high
Consumer price inflation remains high even though it has declined in recent months both in Norway and abroad. Underlying inflation has persisted at a high level, see Figure 2.6. We expect consumer price inflation to continue to decline, but it will take time until it returns to the 2 per cent target. The Norwegian krone depreciation, rising rent inflation and high wage growth all contribute to keeping inflation high, while lower commodity prices, a higher policy rate and lower growth in the Norwegian economy will serve to reduce inflation. We project annual CPI growth at 6.0 per cent in 2023 and 3.8 per cent in 2024. CPI inflation is projected to remain around 5 per cent until the spring, before declining further. Inflation measured by the consumer price index adjusted for tax changes and excluding energy products (CPI-ATE) is projected at 6.4 per cent this year and 4.1 per cent next year, see Table 2.1.
The Norwegian krone depreciation has exerted upward pressure on inflation this year and may also serve to keep inflation high going forward. There is nevertheless reason to believe that developments in domestic prices will increasingly become the main inflation drivers. Rents have for example risen markedly in recent months and there are no indications of such increases levelling off. High wage growth may also serve to push up the prices of other services.
Electricity prices in Norway have declined significantly over the past year, partly as a result of lower gas prices in Europe. Forward prices at the end of July/beginning of August, when the electricity price projections for the budget were finalised, indicated that electricity prices in Norway would on average remain around NOK 0.75 per kWh both this year and next. By comparison, the average price in 2022 was NOK 1.50 per kWh. During the period since the electricity price projections were finalised, electricity prices have continued to decline in part due to heavy rainfall. The oil price has on the other hand increased, serving to boost fuel prices.

Figure 2.6 Consumer prices. Percentage change from the same month the previous year. Jan 2005–Aug 2023
Source: Statistics Norway.
Wage growth is forecast to remain high
Wage growth has picked up markedly during 2022 and 2023, but consumer price inflation has been even higher, thereby reducing real wages. High commodity prices and Norwegian krone depreciation have contributed to high profitability in parts of the private sector and the labour share in manufacturing industry has declined. In the Norwegian wage bargaining process manufacturing industry negotiates first, and the low wage share in this industry is, in itself, an indication of continued high wage growth going forward. The prospect of a continued tight labour market also indicates that wage growth may remain high. It is nevertheless a strength of the Norwegian model for wage settlements that the social partners have traditionally looked beyond short-term exchange rate fluctuations, with changes in profitability only being gradually reflected in wage growth, in order to prevent the latter from becoming too high. Annual wage growth is projected at 5.5 per cent in 2023 and 4.9 per cent in 2024.
High inflation and higher interest rates are expected to curtail consumption growth going forward
Household consumption remained surprisingly strong for a long time, despite increased interest expenses and high inflation. This year, however, we are seeing signs of consumption weakening. The prospect of lower real wages, higher interest expenses and fewer car purchases after record-high levels last year, entail a projected decline in household consumption this year, see Table 2.1. We expect the decline to be smaller than the decline in household income. This is based on the assumption that households will draw on their savings in the face of higher interest rates and prices, as also observed last year. Overall, households accumulated large financial buffers during the pandemic. We expect households to be willing to draw on these excess savings. This suggests that consumption will not show a sharp and sudden decline. From next year, we expect real wage growth to boost household income, although consumption growth is expected to remain weak due to high interest expenses.
Stable house prices and low housing construction
Housing construction has fallen sharply, and we expect it to remain low in the time to come, see Figure 2.4. Sales of new homes have been very low in the past year, and many developers have put projects on hold. The low sales may be due to a reluctance amoung potential buyers to commit to a home purchase with a delivery date far into the future when there is an expectation that house prices could fall. Low housing construction is likely to increase housing market pressure in the longer term, especially in major cities, where housing construction has long fallen short of the demand indicated by demographic trends. Housing investment is expected to decline in both 2023 and 2024, see Table 2.1.
Strong employment growth, low unemployment and high nominal wage growth has limited the negative effect of higher mortgage rates on house prices. House price growth has slowed recently, see figure 2.8, and the number of existing dwellings for sale is higher than normal. A high number of existing dwellings for sale will exert downward pressure on house prices in coming months. Moreover, further mortgage rate increases will dampen housing demand. The decline in house prices is expected to be fairly moderate, with 2024 prices still being above pre-pandemic levels.

Figure 2.7 Prices of existing dwellings. Growth from previous month in per cent and index. January 2020 = 100. Seasonally adjusted. Jan 2020–Aug 2023
Sources: Real Estate Norway, Eiendomsverdi and Finn.no.
The outlook is uncertain
Capacity utilisation in the Norwegian economy is still high, see Figure 2.8. Future developments remain uncertain. We are unlikely to have experienced the full effects of the rapid and substantial interest rate increases and we do not yet know how households will adapt to high inflation and higher interest rates. The Norwegian krone depreciation, higher wage growth and developments in rents also add to the uncertainty about how quickly inflation will come back down. In the event of inflation becoming entrenched at a high level and wage growth remaining high, it may be costly to bring inflation back down. On the other hand, energy prices have reverted to more normal levels.
Overall, the risk of a sudden recession in the coming year is considered to be significantly lower now than at the same time last year.
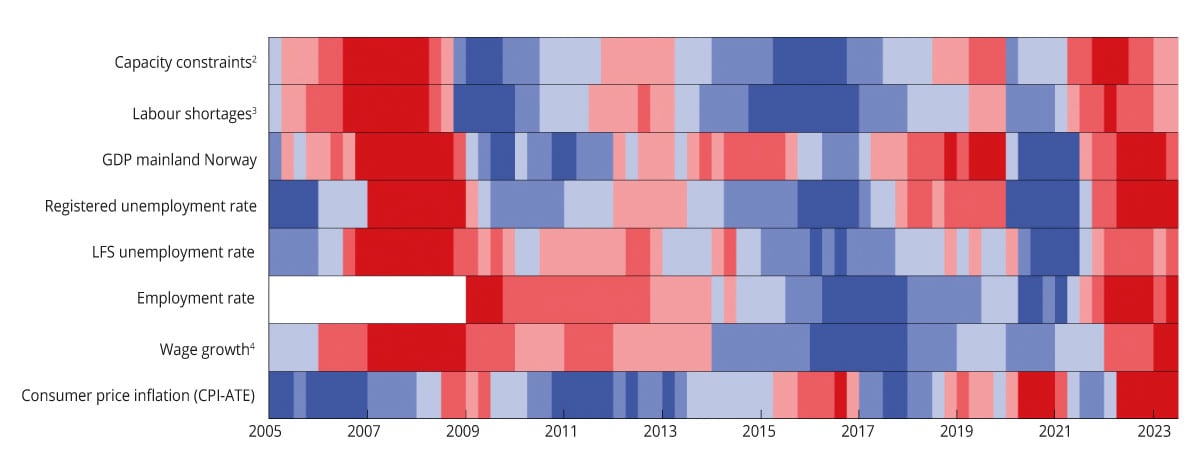
Figure 2.8 Selected indicators of capacity utilisation in the Norwegian economy1 Q1 2005 – Q2 2023
1 Shades of red are a sign the economy is running above full capacity, while shades of blue are a sign of a recession and spare capacity. The colour scale reflects how large the gap, or deviation from the average, is. The darkest colours represent the third of the observations with the largest positive and negative deviation. The indicators are measured as the deviation from the average for the period Q1 2005 – Q2 2023. Observations from the pandemic years 2020 and 2021 have been taken removed from the time series. The exceptions are consumer price inflation, which is measured as a deviation from the inflation target, and GDP, which is measured as a deviation from a simple trend where we have not removed the pandemic years. The trend is estimated using the Hodrick-Prescott filter, where the smoothing parameter is set at 6 400, which corresponds to 400 on an annual basis.
2 Capacity constraints refer to the proportion of the contact businesses in Norges Bank’s regional network that will either have some or significant problems in increasing production/sales without investing more resources.
3 Labour shortages refer to the proportion of the contact businesses in Norges Bank’s regional network that report that labour shortages are limiting production/sales.
4 Annual figures are used for wage growth. The figure for 2023 is as estimated in this report.
Source: Norges Bank, Statistics Norway, Norwegian Labour and Welfare Administration and the Ministry of Finance.