2 Financial stability
2.1 Introduction
Financial stability requires the financial system to be sufficiently robust to accept deposits and other repayable funds from the public, arrange funding, make payments and reallocate risk in a satisfactory manner. An important prerequisite for this work is that banks and other financial institutions are solid and function as intended.
Previous crises have taught us that it is difficult to predict economic disruptions. The economy is changing, and these changes may increase the vulnerability of the Norwegian financial system. For example, the international financial crisis illustrated that deficiencies in the international capital markets can harm Norwegian banks. Low interest rates, high household debt and rising life expectancy are all factors currently influencing the vulnerability of the financial system.
Activity in international financial markets was strengthened somewhat in 2012. Share prices rose, and risk premiums on debt fell. In Norway, share prices on Oslo Stock Exchange rose by 15 per cent. Although this has improved life insurance company buffers, the companies still face major challenges linked to rising life expectancy and low interest rates. There is still uncertainty to the future development of international financial markets. Banks improved their solidity in 2012, and they have secured more robust funding.
2.2 The financial system and efforts to ensure financial stability
The financial system comprises financial institutions and other market participants, marketplaces and transaction infrastructure. The system effects payments and enables participants in the real economy to manage and reallocate financial risk and allocate resources over time. The key institutions in the Norwegian financial system are banks and other credit institutions (mortgage companies and finance companies), insurance companies, pension funds, investment firms and securities fund management companies. Major structural changes often result from mergers or demergers. In terms of total assets, credit institutions clearly constitute the largest group, followed by life insurance companies; see Box 2.1.
In the course of their operations, financial institutions assume liabilities and risks, and there are numerous examples illustrating that participants in the real economy are entirely dependent on the financial institutions being able to discharge their liabilities. Problems in these institutions will therefore readily affect the real economy. Further, due to the economic interaction between financial institutions, problems in one part of the financial system may damage the system as a whole. Problems may be exacerbated by negative interactions between the financial markets and the real economy. Preventing crises in the financial system is often less costly than countering the outcomes of financial crises. Promoting financial stability is therefore a vital task for the authorities.
The authorities work to prevent solvency and liquidity crises in the financial system through statutory and regulatory requirements, as well as through supervision of financial institutions and financial markets. In Norway, considerable emphasis has been given to comprehensive, consistent regulation, for example by regulating the same type of risk identically, irrespective of its location, thus preventing risk from accumulating where it is subject to the least regulation. This principle has underpinned Norwegian financial markets regulation for many years. It is also a prerequisite for financial stability – and an important objective in itself – to have good consumer protection in the financial markets.
Efforts to ensure financial stability in Norway are shared between the Ministry of Finance, Norges Bank and Finanstilsynet. The Ministry of Finance has overall responsibility for ensuring that the financial system functions well. Norges Bank and Finanstilsynet are tasked with helping to ensure that the financial system is robust and efficient, and therefore oversee financial institutions, securities markets and payment systems to identify threats to stability. Finanstilsynet also supervises financial institutions and marketplaces. Norges Bank is the lender of last resort.
In 2006, so-called tripartite meetings were established between the Ministry of Finance, Norges Bank and Finanstilsynet. At these meetings, information is exchanged about things such as Norwegian and international economic developments and the state of the financial markets. Meetings are held every six months, and more frequently when needed. There were five tripartite meetings in 2012 as a result of the financial crisis and the volatile state of international financial markets. Thus far, one meeting has been held in 2013.
Textbox 2.1 Overview of the Norwegian financial market
The total assets of Norwegian financial institutions and branches of foreign institutions amount to approximately 300 per cent of mainland Norway GDP; see Figure 2.1. With the exception of the period following the Norwegian banking crisis at the beginning of the 1990s, the total assets of the Norwegian financial services industry have generally grown more rapidly than GDP. In the last couple of years, the total assets of the financial services industry have grown approximately in line with GDP.
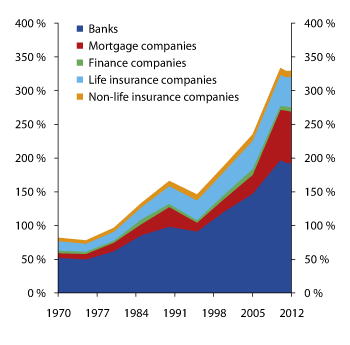
Figure 2.1 Total assets in the financial market as a proportion of mainland Norway GDP
Source Statistics Norway and Finanstilsynet
Table 2.1 The structure of the Norwegian financial market (including foreign branches). Figures for institutions and total assets (NOK billion) in different sectors. Percentage of total assets in different sectors and in total (market share). As at 31 December 2012
Percentage of total assets | Credit institutions | Securities funds | Non-life insurance | Life insurance | Total groups |
|---|---|---|---|---|---|
Total number of institutions | 213 | 18 | 86 | 21 | - |
Total assets (NOK billion) | 5,590 | 557 | 201 | 993 | - |
Market share, percentage | |||||
DNB | 36 | 18 | 1 | 27 | 32 |
SpareBank1/cooperating savings banks | 14 | 4 | 7 | 3 | 12 |
Nordea | 10 | 10 | 0 | 6 | 10 |
KLP | 1 | 12 | 2 | 30 | 5 |
Storebrand | 1 | 10 | 1 | 24 | 5 |
Eika group | 5 | 1 | 2 | 0 | 4 |
Gjensidige | 0.3 | 0 | 27 | 1 | 1 |
Total groups/alliances | 67 | 56 | 40 | 92 | 68 |
Other companies | 33 | 44 | 60 | 8 | 32 |
Market as a whole | 100 | 100 | 100 | 100 | 100 |
of which foreign branches | 13 | - | 30 | 0 | 11 |
of which foreign-owned subsidiaries | 12 | - | 0,5 | 7 | 10 |
Source Finanstilsynet
Seven groups account for around 68 per cent of the total financial market; see Table 2.1. These are DNB, the Sparebank 1 group, Nordea, KLP, Storebrand, the Eika group and Gjensidige.
At the end of 2012, there were 213 credit institutions in the Norwegian credit market, down from 220 in 2011. Of these institutions, 138 were banks, 30 were mortgage companies and 45 were finance companies. Mortgage companies primarily provide mortgages to fund commercial activities and house purchases, while finance companies primarily engage in leasing, car purchase financing, short-term loans and consumer credit. The total assets of these financial institutions amounted to approximately NOK 5,590 billion.
In recent years, household borrowing has come to account for an increasing proportion of loans issued by banks and mortgage companies; see Figure 2.2. The distribution of commercial loans in the different sectors is reviewed in more detail in section 2.3.
There are 18 securities fund management companies in the Norwegian market, two less than in 2011. Their assets total around NOK 557 billion, approximately NOK 70 billion more than in 2011.
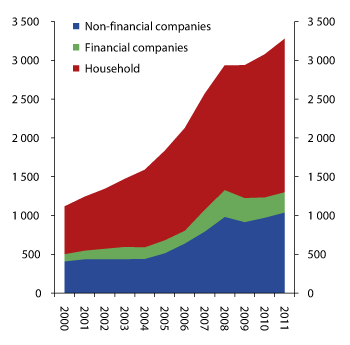
Figure 2.2 Loans repayable to banks and mortgage companies by sector. NOK billion
Source Statistics Norway
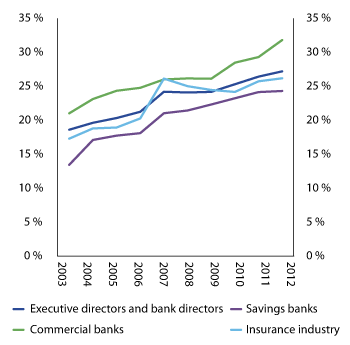
Figure 2.3 Share of female bank directors and executive directors in banks and insurance companies
Source Finans Norge/Statistics Norway
Some 121 enterprises provide insurance products in the Norwegian market. Of these, 100 focus on non-life insurance products. The non-life insurance sector features a relatively large proportion of foreign branches. Measured by total assets, foreign branches accounted for around 30 per cent of total activity in the non-life insurance sector.
At the end of 2012, there were 21 life insurance companies in the Norwegian market, one less than in 2011. Of these 21 companies, 12 were Norwegian, while the rest were smaller branches of foreign institutions. The assets of the life insurance companies totalled approximately NOK 993 billion.
There are 88 pension funds in the Norwegian market, with total assets of about NOK 220 billion.
Acording to a report from AFF (Administrativt forskningsfond ved Noregs Handelshøgskule), the share of female leaders in business increased from 21,5 pct. to 31.4 pct. in the period 2002 to 2011. The numbers for the financial sector followed the same trend. The share of females in leading positions at banks and insurance companies increased from 18.6 pct. to 27,2 pct. in 2012, see Figure 2.3. Among banks and insurance companies, retail banks have the highest share of female leaders at 31.8 pct. Retail banks have had the highest share of female leaders throughout the period.
2.3 The macroeconomic picture
Provisional accounting figures indicate that global economic growth came to a stop in the fourth quarter of 2012, following relatively strong growth in the previous quarter. Growth was particularly weak in the UK and the euro area, while gross domestic product (GDP) remained almost unchanged in the USA. In China, the pace of growth picked up somewhat towards the end of last year.
Major uncertainty remains about future international developments. The unresolved fiscal policy situation in the USA is a source of uncertainty. In late 2012/early 2013, Congress decided to limit the scope of cutbacks that would otherwise have been implemented at the beginning of 2013. This prevented the US economy from falling off the “fiscal cliff”. Nevertheless, the Members of Congress failed to agree adjustments of automatic expenditure cuts, which were therefore implemented on 1 March of this year. Looking forward, Congress will have to renew the budgetary authorisations of the federal authorities. Without new authorisations, the federal sector will eventually have to cut expenditure. The current authorisation to assume new federal debt will expire on 18 May. Accordingly, the stringency of fiscal tightening in the USA is highly uncertain. If the US Congress is able to agree limits on the size of spending cuts, positive US growth is expected to continue.
Although forecasters expect strong growth in China compared to traditional industrialised countries, they expect growth to be lower than in 2010 and 2011.
Many European countries have implemented stringent fiscal tightening to correct the imbalances that developed in the years preceding the financial crisis. This is reducing demand. Unemployment is high, and there are signs of increasing social unrest and falling confidence in politics and important social institutions in several countries. The application of strict credit policies by banks in dealings with the private sector is helping to restrict investment.
The situation in the Norwegian economy contrasts strongly with the situation among many of Norway’s most important trading partners. Mainland Norway GDP rose by 3.5 per cent in 2012. Unemployment is low, and employment is higher than before the financial crisis.
The Norwegian economy appears to be becoming increasingly bifurcated. While petroleum industry suppliers are experiencing capacity problems, the rest of Norway’s mainland industry and traditional export businesses are suffering. High oil prices have produced substantial revenue for the petroleum industry, and investment in oil and gas production rose by over 14 per cent in both 2011 and 2012. When demand for labour and goods and services for operations on the Norwegian continental shelf are included, total demand from the petroleum industry now equals almost 19 per cent of mainland Norway GDP. When demand from the petroleum industries of other countries also increases, the result is high activity levels among Norwegian supplier companies. This bifurcation is also apparent from regional differences. Unemployment is lowest in the counties with the highest density of suppliers to the petroleum industry.
A strong Norwegian krone has a particular effect on traditional export businesses, which are battling low demand from export markets. The profitability of these companies is also under pressure due to high wage costs. In the last 10 years, wage costs in Norwegian industry have increased by 1.6 per cent annually, on average, relative to Norway’s trading partners (measured in a common currency). This development has been possible due to strong growth in the prices of Norwegian export products and sales to the petroleum industry. Nevertheless, since the summer of 2011, prices for some traditional export goods have fallen. This is due partly to the appreciation of the krone and partly to lower global market prices for certain products, including metal.
Consumer price inflation was low last year as a result of the strong krone, lower prices for imported consumer goods and a fall in electricity prices. According to the provisional national accounts, wage inflation totalled 4 per cent in 2012, down from a rate of 4.2 per cent in 2011.
One feature of Norway’s economic development is strong growth in house prices and household debt. High income growth over many years, low interest rates, easy access to bank credit and high immigration have intensified pressure on the housing market in central parts of the country. House prices continue to grow rapidly. The rise in house prices has been accompanied by a rise in Norwegian household borrowing; see the discussion in section 2.4.2. Compared to income, debt is at a historically high level.
Monetary policy flexibility is limited by low key policy rates among Norway’s trading partners. Norway’s key policy rate has remained at 1.5 per cent since March last year, when the rate was cut by 0.25 percentage points. Along with high income growth, the low interest rate level is supporting high household demand. Growth in such demand slowed towards the end of last year. Although household income growth remains high, it appears that a larger proportion of income was invested in saving in the form of housing investment.
Higher activity levels in the mainland economy are reflected in the labour market. Employment has been rising since the first half of 2010. In the past 12 months, growth has largely occurred in the private sector, with a major contribution by labour immigration. In total, 3.2 per cent of the workforce was unemployed in 2012.
In the National Budget 2013, the Ministry of Finance expected mainland Norway GDP growth of 2.9 per cent this year. Due to lower activity levels in the mainland industry and among export-focused companies, growth has probably been lower. The Ministry of Finance will present a new forecast in the revised national budget in May.
2.4 Banks and other credit institutions
This section contains a review of different risk factors applicable to banks and other credit institutions, and of solvency and earnings development among the institutions.
2.4.1 Liquidity risk
The term liquidity risk denotes the risk that a participant in the economy is unable to meet liabilities upon maturity, despite being solvent. Participants are deemed to be solvent when the value of their assets is higher than the value of their liabilities, i.e. when they have positive net assets. Liquidity risk may arise when the maturity structures of assets and liabilities are mismatched.
Since banking largely involves funding long-term, illiquid loans or other illiquid assets through liquid deposits, banks are particularly exposed to liquidity risk. If banks are also funding long-term loans or other illiquid assets through short-term borrowing in the market, their liquidity risk may increase.
The funding structure of banks and mortgage companies is illustrated in Figure 2.4. Funding derived from customer deposits and borrowings from customers increased from 42 per cent of total funding in 2011 to 46 per cent in 2012. Increased household saving contributed to the rise in deposits, which are normally considered to constitute a stable funding source due to the Norwegian deposit guarantee scheme. Deposits from foreign funds also increased, although such deposits must be considered less stable.
Long-term bonds, including covered bonds, accounted for a higher proportion of total funding in 2012; see the figure. Such funding now represents approximately 30 per cent of the total funding of banks and mortgage companies. Loans from other credit institutions have fallen from 15 per cent in 2011 to 6 per cent in 2012.
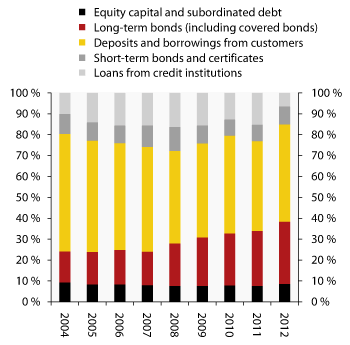
Figure 2.4 Composition of funding of banks and mortgage companies. Percent of total assets
Source Finanstilsynet
Banks and mortgage companies have substantial funding in foreign currencies that will fall due for repayment in the next few years; see Figure 2.5. Accordingly, banks and mortgage companies experiencing relatively rapid lending growth are vulnerable to disturbances in funding access.
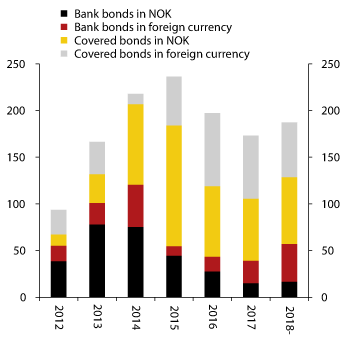
Figure 2.5 Senior bond debt apportioned by maturity and currency as at 16 April 2012. NOK billion
Source Finanstilsynet
A large and growing proportion of bank and mortgage company debt is taking the form of covered bonds. One reason for the emergence of these securities is that banks have found it profitable to sell off residential mortgages with good security to mortgage companies that can issue covered bonds, while retaining riskier assets on their own balance sheets. One result of this is that, in a crisis, the mortgage companies will have reduced access to assets which they can collateralize to secure funding.
2.4.2 Credit risk
Loans comprise approximately 80 per cent of the total assets of banks and residential mortgage companies, and credit risk is normally the most important risk factor for these credit institutions. Credit risk is strongly linked to the ability and willingness of Norwegian households and businesses to pay interest and make repayments, and to developments in the value of housing and other mortgaged property.
The ability of households to service debt can be measured by the debt and interest burdens. The debt burden can be defined as debt as a percentage of disposable income,1 while the interest burden is interest expenditure as a percentage of disposable income. Growth in household debt exceeded income growth for much of the 1990s and 2000s, thus increasing the debt burden. The debt burden has levelled off in the wake of the financial crisis, but has subsequently increased again. The debt burden is currently about 200 per cent; see Figure 2.6. In recent years, high household income growth has slowed debt burden growth somewhat.
The interest burden is relatively low, but vulnerable to changes in interest rates. There is a risk that many households will find it difficult to absorb a major interest rate rise. In a stress test, Finanstilsynet calculated that, given the current household debt burden, a borrowing rate of 6.7 per cent would impose an interest burden of more than 30 per cent on households who are representing a quarter of total household debt. Such an interest rate rise could therefore have a material effect on household demand; see Box 2.2.
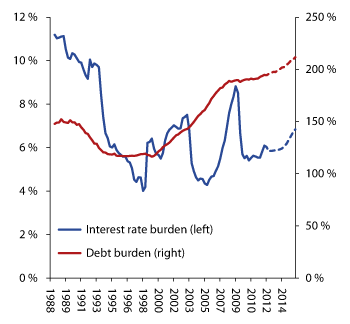
Figure 2.6 Household debt burden (right axis) and interest burden (left axis)
Source Norges Bank
Textbox 2.2 Interest rate rises and demand for goods and services
A rise in interest rates influences overall demand in the economy through various channels. One of these channels is changes in household demand for goods and services. Households have assets and liabilities. The majority of Norwegian household debt takes the form of variable rate loans. Those who have such loans must pay more interest and reduce consumption of goods and services when interest rates rise. High debt growth in recent years means that a rise in the interest rates charged on household borrowings may have a greater effect on household demand.
At the end of 2012, total household debt amounted to approximately NOK 2,300 billion, while total disposable income totalled around NOK 1,200 billion. If interest rates rise by, for example, 3 percentage points, households will have to pay about NOK 69 billion per year in additional interest on their debts. Total demand for goods and services will not automatically drop by the same amount, but the figure does illustrate that high indebtedness can have a major effect on household demand, which in turn may affect business earnings.
Conditions in the housing market influence demand for, and the supply of, loans to households. House prices have risen substantially in the last 20 years; see Box 2.3. Over time, high house prices will contribute to increased demand for loans to households, as a large proportion of household debt is incurred to purchase residential property. Optimism may also contribute to high credit demand from Norwegian households. For example, solid income growth for Norwegian wage earners, expectations of continued low interest rates and favourable developments in the labour market may boost demand. Optimism may also contribute to expanded credit supply. In recent years, there has been intense competition for customers in the residential mortgage market, whilst banks have enjoyed good access to funding in the capital market. Those who are already established in the housing market may take advantage of the rise in house prices by taking up further loans. An increase in the value of housing may cause households to be offered expanded borrowing on their homes, as the value of the banks’ security increases. In recent years, competition for customers has been strong in the residential mortgage market, and credit institutions have had reliable access to funding from the capital markets.
Since 1994, Finanstilsynet has conducted surveys of banks’ lending practices relating to loans secured on residential property. The most recent survey was carried out in July and August 2012. It covered the 28 largest banks, which account for about 85 per cent of all residential mortgages issued by banks.
Some 40 per cent of all residential mortgages were issued for house purchases, while 60 per cent were issued for other purposes, including refinancing of residential mortgages.
The average loan-to-value (loan amount relative to property value), for new residential mortgages was 51 per cent, while 17 per cent of loans had a loan-to-value of more than 85 per cent of the property value; see Figure 2.7. In the 2011 survey, by contrast, 26 per cent of loans had a loan-to-value above 90 per cent. Particularly loans to borrowers under 35 years of age have a high loan-to-value. The 2012 survey showed that 43 per cent of loans to borrowers under 35 years of age had a loan-to-value above 85 per cent, while 19 per cent of loans to this group exceeded the property value. Figure 2.7 Distribution of new residential mortgages by loan-to-value Source Finanstilsynet 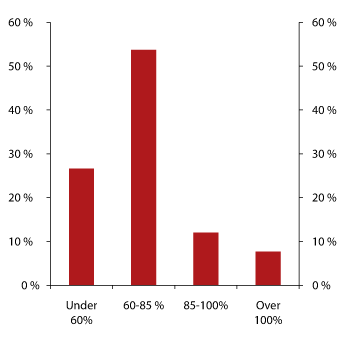
Textbox 2.3 Housing market developments
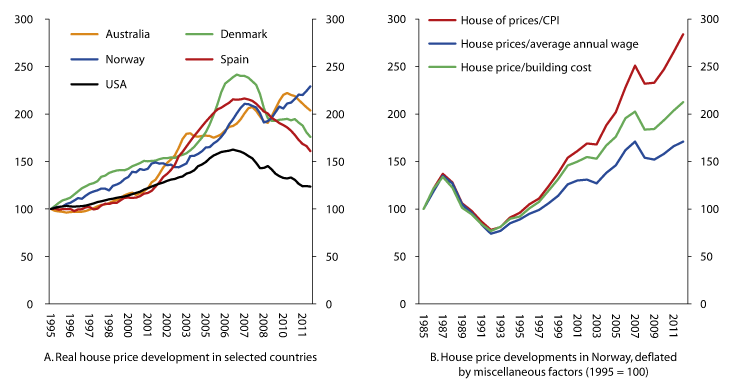
Figure 2.8 Real house price developments in selected countries and house price developments in Norway, deflated by miscellaneous factors (1995 = 100)
Source Federal Reserve Bank of Dallas, OECD, Statistics Norway and Ministry of Finance
Norwegian house prices rose by about 8 per cent in 2012, compared to 9 per cent in 2011. The growth rate has remained high thus far in 2013. In January alone, house prices rose by about 5.3 per cent. Adjusted for inflation – real house prices – house prices are now at an all-time high. In the years preceding the international financial crisis, house prices increased in very many countries, not least due to low interest rates and high optimism. Following the financial crisis, house prices have fallen in many countries; see Figure 2.8A.
The supply of residential properties in Norway is higher today than in 1995. The explanation for the increase in house prices in Norway since 1995 must therefore be that, overall, demand has increased by more than supply. High, increasing population growth, migration, low unemployment, solid wage inflation and low interest rates are all factors that may help to explain the rise in demand.
However, how much households are willing to pay for a home is not only determined by such fundamental factors, but also by households’ belief about the future. A belief in future price inflation may prove self-fulfilling. Surveys1 show that when house prices rise, people increasingly expect the price rise to continue.
Economic theory indicates that houses are constructed when the price of a newly built home exceeds the building cost and the alternative value of the plot of land. House prices in central parts of Norway are now high compared to building costs, and the difference is increasing; see Figure 2.8B. High house prices around large cities are triggering high levels of construction activity. Over time, this activity will bring about an increase in the supply of homes relative to demand, and thus dampen house price inflation. Residential property construction takes time, and capacity limitations both in the construction industry and on the part of the regulatory authorities may mean the lapse of many years from when a demand shock is felt until its effect on the supply side passes.
1 Gelain, P. & K.J. Lansing (2013), «House prices, expectations, and time-varying fundamentals», Norges Bank Working Paper 05.
When house prices fall, the value of banks’ security for existing residential mortgages also falls. This may cause the banks to restrict the supply of new loans. However, demand for new loans may also drop because houses become cheaper and because turnover in the housing market may fall. A strong decline in house prices may reduce household demand for goods and services, as net wealth shrinks. Accordingly, a drop in house prices can affect the earnings of non-financial enterprises.
When household finances weaken, households often give priority to repaying their mortgage debt and restricting consumption and other expenditure. This occurred in Norway during the banking crisis of the early 1990s, and is currently happening in many European countries. During periods of financial distress, bank losses on residential mortgages may therefore be relatively small, even though many households carry large debt burdens. However, such an imbalance in the financial position of households may nevertheless affect banks because it increases bank losses on commercial loans.
The ability of enterprises to service debt is vulnerable to economic developments both in Norway and internationally. The debts owed to banks by enterprises have increased considerably in recent years; see Figure 2.9. Commercial loans account for approximately 40 per cent of total lending by banks and mortgage companies.
Norges Bank’s lending survey shows that banks tightened credit supply to enterprises in 2012. Regarding loans to enterprises engaged in commercial property, which account for about 30 per cent of commercial loans, the credit supply has become relatively more tightened. Banks point to concerns about the equity capital ratio as the most important reason for the cut-back.
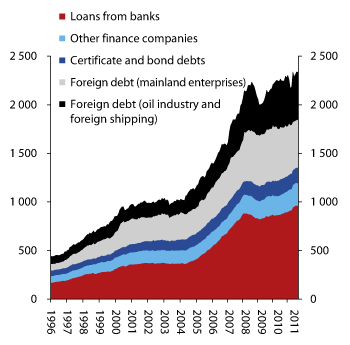
Figure 2.9 Commercial debt by source. Balance. NOK billion
Source Norges Bank
In most industries, the debt-servicing ability of enterprises (profits as a percentage of bank and bond debt), has fallen in recent years. Figure 2.10 illustrates the trend for listed companies as a whole. Debt-servicing ability provides an indication of the ability of enterprises to handle weaker earnings without affecting creditors. The equity capital ratios (net assets as a percentage of the balance sheet total), of enterprises have remained close to 40 per cent since 2002.
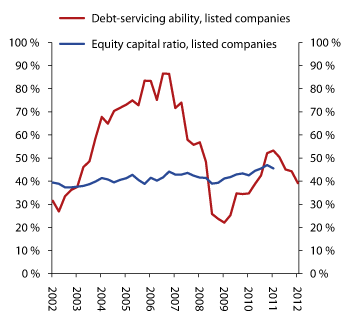
Figure 2.10 Debt-servicing ability and equity capital ratio of listed companies
Source Norges Bank
A large proportion of total bank lending to enterprises comprises loans to enterprises engaged in shipping or commercial property; see Figure 2.11. Commercial property and shipping are industries vulnerable to economic fluctuations.
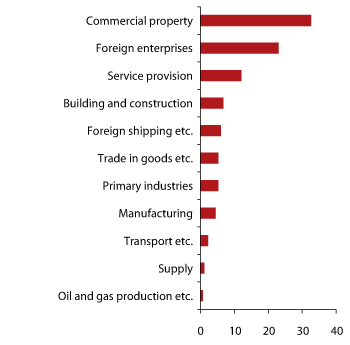
Figure 2.11 Bank lending to different industries. Percentage of total loans to enterprises
Source Norges Bank
Commercial property operations are sensitive to fluctuations in the domestic economy. The office segment is the largest in the context of commercial property lending, and the real prices of office premises and office rent in Oslo, for example, have correlated with the Norwegian employment rate for the last 30 years. If unemployment were to rise in Norway, there is good reason to believe that profitability in the commercial property sector would decline.
In the shipping industry, the risk profile varies for different sub-segments, although the earnings of shipping companies as a whole are sensitive to global economic developments. The industry has been affected by the current international unrest. Freight prices in several sub-segments have fallen since 2011, due to excess capacity. Lower freight prices mean lower profitability and poorer debt-servicing capacity in the shipping industry.
2.4.3 Solvency and earnings
The capacity of banks to absorb losses without depositors and other ordinary creditors incurring losses depends on the level and quality of banks’ tier 1 capital and other capital. The capital adequacy rules provide that tier 1 capital shall constitute no less than 4 per cent of risk-weighted assets, and that total capital (capital as a percentage of risk-weighted assets), shall constitute no less than 8 per cent; see the discussion in Chapter 3. All Norwegian banks met the minimum requirements with a good margin at the end of 2012. Weighted by bank size, the average capital adequacy rate was 13.3 per cent at the end of 2012, up 1.1 percentage points on the previous year.
Since the international financial crisis, CET1 capital coverage – i.e. where subordinated loan capital and hybrid capital instruments (instruments with properties common to both debt and equity), are deducted – has been used more frequently as a measure of bank solvency. Finanstilsynet stipulated that all Norwegian banks should have CET1 capital coverage of at least 9 per cent by the end of the first half of 2012. The conclusion is that all except three banks achieved the target before the deadline, and that all banks did so by the end of 2012.
Figure 2.12A illustrates the fact that Norwegian banks have strengthened their solvency in recent years. For banks as a whole, CET1 capital coverage has risen evenly since 2008, and totalled 11.1 per cent at the end of 2012. This is 1.2 percentage points higher than at the same time in 2011. The figure also shows how much CET1 capital the banks have as part of their non-risk-weighted total assets. The difference between these two measures of solvency indicates that asset growth has outstripped increases in capital requirements. The difference has increased over time, and has never been greater than at the end of 2012. The increase in the difference may indicate that banks are reorienting the industry towards loans that are given a lower weighting in the calculation basis for capital requirements, for example by lending more for residential purposes and less to enterprises.
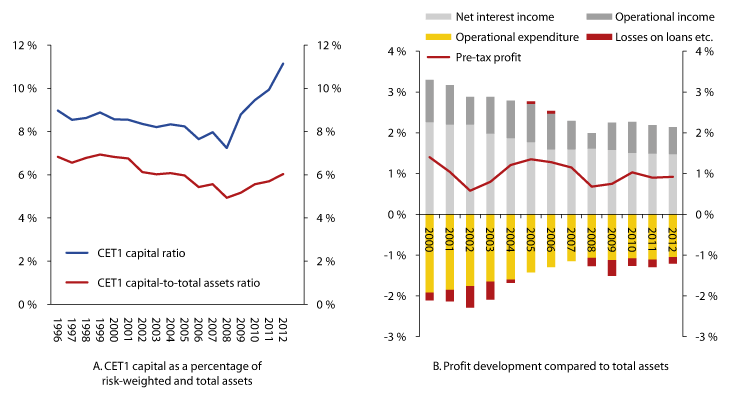
Figure 2.12 CET1 capital as a percentage of risk-weighted assets and total assets and Profit development compared to total assets
Source Finanstilsynet
Banks improved their solvency in 2012 by obtaining capital from the market and retaining a proportion of earnings. Banks achieved total pre-tax profits of some NOK 37 billion, approximately NOK 4 billion more than in the previous year.2 Compared to total assets, the 2012 results were on a par with the average for the last 10 years; see Figure 2.12B. The improvement in profits was primarily linked to an increase in net interest income, banks’ most importance source of income.
Credit premiums on bank debt have fallen; see Figure 2.13A. As a result, banks have access to cheaper funding. Despite the fact that prices have fallen considerably, Norwegian banks still face higher funding costs in securities markets than before the financial crisis. The interest rate margin, i.e. the difference between the average lending and deposit rates, also dropped in 2012; see Figure 2.13B.
The implementation of the Basel III standards in EEA law and in Norway will introduce higher minimum capital adequacy requirements than the currently applicable requirements; see discussion in Chapter 3. Even though Norwegian banks are well on the way to meeting these future minimum requirements, it is important that they continue to improve their solvency.
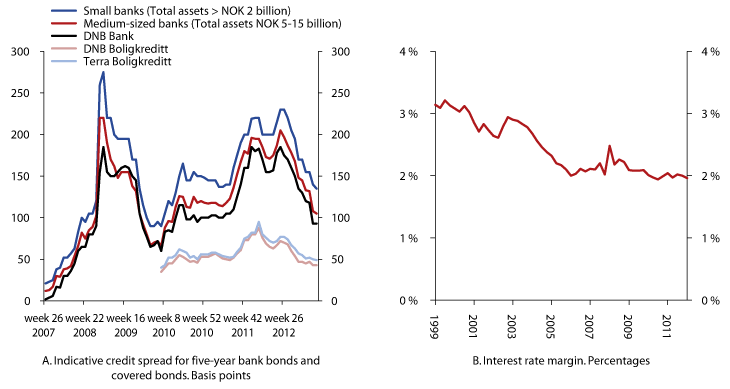
Figure 2.13 Indicative credit spread for five-year bank bonds and covered bonds and Interest rate margin
Source Finanstilsynet, DNB Markets
Because banks largely transfer their loan portfolios to mortgage companies, there has been a large increase in the number of loans held by mortgage companies. Around 60 per cent of all Norwegian residential mortgages are now accumulated in residential mortgage companies that issue covered bonds.
Mortgage companies (excluding Eksportfinans ASA), experienced lower profits in 2012 than in 2011, primarily due to a drop in net interest income. As share of total assets, pre-tax profits declined from 0.47 per cent in 2011 to 0.27 per cent in 2012. Mortgage companies obtain most of their funding through the issue of covered bonds. Although the costs of covered bond-based funding fell in 2012, the drop in interest income was larger.
Mortgage companies improved their solvency in 2012. Mortgage companies that issue covered bonds and are wholly owned by a bank increased their CET1 capital coverage from 10.2 per cent to 12.2 per cent in 2012. Mortgage companies that issue covered bonds and are part-owned by several banks increased their CET1 capital coverage from 9.9 per cent to 10.6 per cent during 2012. Mortgage companies that do not issue covered bonds also increased their CET1 capital coverage by a couple of percentage points in 2012.
Finance companies achieved pre-tax profits of approximately NOK 2 billion in 2012, a slight improvement 2011. This profit growth is linked to an increase in net interest income. At the end of 2012, finance companies had CET1 coverage of 15.7 per cent, down 0.6 percentage points on the previous year.
2.5 Insurance and pensions
This sub-section contains a review of different risk factors particular to the insurance and pension industries, and of solvency and profit developments among institutions in this part of the financial market.
2.5.1 Insurance risk
Life insurance companies and pension funds promise insured persons a payment when a defined event occurs, for example that the insured person becomes incapable of work or reaches the required age for entitlement to a retirement pension. The monetary values of these promises constitute the most important liabilities of life insurance companies and pension funds.
At the individual level, it may be highly uncertain whether a certain event will occur or not. Insurance companies reduce the uncertainty associated with individual persons by having many customers. Their residual liability risk is largely linked to whether more people become incapable of work or whether the insured persons, on average, live longer than assumed. This risk is also linked to the type of insurance the insured person has. In the case of defined benefit schemes, unlike defined contribution schemes, the companies have often promised to provide a lifelong retirement pension. If the insured persons live longer than assumed when the premiums were paid in, the insurance companies must cover the shortfall.
Life expectancy is rising in Norway. The assumptions regarding life expectancy (the death basis, referred to as the K2005 basis), that have been applied to collective pensions in recent years have not been adapted to changes in the life expectancy of the insured persons. Finanstilsynet therefore proposed in March 2013 that life insurance companies and pension funds be required to comply with a new minimum death basis requirement from 2014. The new minimum requirement is intended to ensure that life insurance companies and pension funds allocate sufficient capital to deal with increased life expectancy; see Chapter 3 for further discussion. In practice, the new minimum requirement will mean that companies have to increase premiums for retirement pensions in collection pension schemes. The financial allocations to previously accrued retirement pension entitlements in collective schemes will also have to be increased. Companies may use any profits on the management of customer funds (returns on the collective portfolio in excess of the interest rate guaranteed to customers), to fund up to 80 per cent of the increase in allocations (reserve-building). The remaining 20 per cent have to be covered from the companies’ own funds.
The power of companies to use customers’ excess profits to fund reserve-building is limited in time, and applies to profits in the period 2014–2019. Figure 2.14 illustrates the size of the returns on customer funds the companies require during this period to make full use of the power to use customer profits (the upper dashed line), compared to the average guaranteed interest rate, historical book returns achieved by life insurance companies and the interest rate on 10-year Norwegian and European government bonds.3
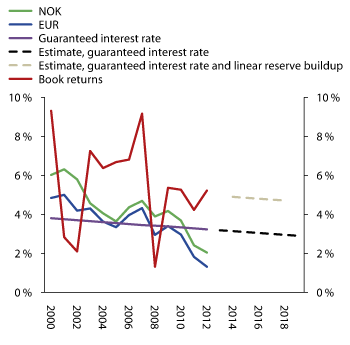
Figure 2.14 Development in average interest rate guarantees among Norwegian life insurance companies and interest rates on 10-year government bonds in Norway (NOK) and the Eurozone (EUR)1, book returns on assets and estimates of guaranteed returns and reserve-building needs.
1 Bonds with a AAA rating.
Source Finanstilsynet, Ministry of Finance
This return that companies must achieve does not include the return they must achieve on customer funds in order to meet their interest rate guarantee (without reducing their net assets).
2.5.2 Market risk
Under the operating rules in the Insurance Activities Act, which has been in force since 2008, customers that have purchased collective pension products entitling them to contractual payments are required to make annual pre-payments for the management of the funds linked to the insurance contract. Insurance companies bear market risk, as they have guaranteed customers a return on their funds (an interest rate guarantee), and this must also be compensated for through customer premiums. It is therefore important that companies charge a sufficiently high price for this interest rate guarantee, and that they use their income to build up adequate net asset buffers for the years in which customer portfolio returns are lower than the interest rate guarantee.
The interest rate guarantee is different in the case of paid-up policies and individual insurance contracts concluded before 2008. Companies cannot collect interest rate guarantee premiums for these products, and instead receive their income by sharing profits on capital with customers.
The returns on customer funds guaranteed in contracts for which premiums cannot be amended mean that life insurance companies and pension funds are particularly exposed to market risk, i.e. the risk of gains or losses due to changes in the market prices of assets.
Market interest rates have fallen in recent years, particularly for low-risk securities. On average, market interest rates on government bonds are now lower than the average interest rate guarantee; see Figure 2.14. Important reference rates such as the money market rate and key policy rate are low, and are expected to stay low for some time; see Figure 2.15. With a prolonged low interest rate level, companies will find it difficult to achieve sufficient returns in accordance with the interest rate guarantee.
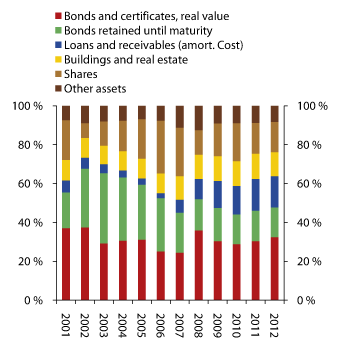
The market risk faced by life insurance companies has been linked more to the development of bonds and certificates. While the proportion of shares in asset portfolios has fallen, it has risen in portfolios of interest-bearing securities; see Figure 2.16.
The returns received by insurance companies and pension funds on the funds in their customer portfolios vary from year to year; see Figure 2.14. To even out profit and loss fluctuations, companies may, for example, record fixed-income securities at cost price (amortised cost). This requires companies to plan to keep the securities until maturity. One consequence of this valuation method is that if interest rates drop and the market price of interest receivables rises, companies may receive a higher annual return on their receivables in some years than the market interest rate would suggest. As older interest receivables mature and new ones are bought, however, it will become difficult for companies to achieve a higher interest rate than the ordinary market rate. Figure 2.15 Money market rate and key policy rate. Estimates for both. From Monetary Policy Report 1/13 Source Norges Bank Figure 2.16 Life insurance company assets. Proportion of total funding Source Finanstilsynet 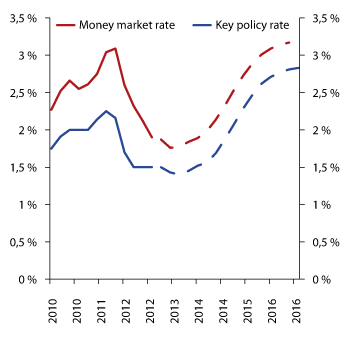
2.5.3 Solvency and earnings
In 2012, life insurance companies achieved pre-tax profits of NOK 5.1 billion, up from NOK 3.5 billion in 2011. The adjusted pre-tax 2012 profit (taking account of unrealised share gains), was NOK 13.4 billion.
Buffer capital expresses the ability of life insurance companies to absorb losses without breaching stipulated minimum capital requirements. Buffer capital – the capital buffer exceeding the stipulated minimum requirements – is composed of net assets and customer funds. The buffer capital of life insurance companies amounted to 5.5 per cent of total assets at the end of 2012, around 0.7 percentage points higher than in 2011; see Figure 2.17. This rise is primarily due to an increase in exchange rate equalisation funds, reflecting unrealised changes in the market value of assets included in collective portfolios.
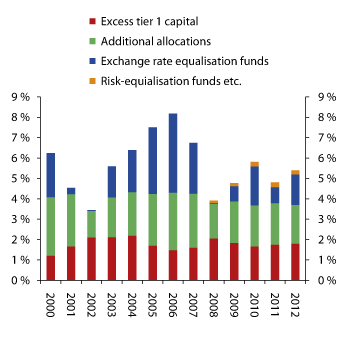
Figure 2.17 Buffer capital developments. Percentage of total assets
Source Finanstilsynet
The capital adequacy rate of the companies as a whole was 16.2 per cent at the end of 2012, representing a small increase on 2011. The capital adequacy requirement applicable to life insurance companies, like that applicable to credit institutions, is 8 per cent. All companies meet the requirement.
Finanstilsynet conducts regular stress tests to measure buffer capital utilisation, i.e. how much buffer capital has to be used to cover losses in a given stress scenario. At the end of 2012, the buffer capital utilisation of life insurance companies as a whole totalled 79 per cent, 24 percentage points lower than in 2011.
In 2012, pension funds4 achieved pre-tax profits of NOK 5 billion, equivalent to about 2.5 per cent of their average total assets. Most of the increase in profits is due to an increase in net financial income. Growth in the securities markets led to an improvement in adjusted and booked returns on pension funds’ collective portfolios; see Figure 2.18.
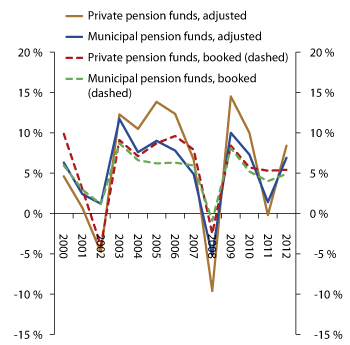
Figure 2.18 Adjusted and booked (dashed) returns on collective portfolios, private and municipal pension funds. Percentages
Source Finanstilsynet
The buffer capital of pension funds totalled NOK 22.8 billion at the end of 2012, corresponding to 11.1 per cent of total pension fund assets. This increase of approximately 2 percentage points is mostly due to positive developments in financial income in excess of guaranteed interest rates, and resulted in an increase in exchange rate equalisation funds.
At the end of 2012, pension funds had a total capital adequacy rate of 16.5 per cent, around 0.7 percentage points lower than in 2011. All pension funds met the capital adequacy requirement of 8 per cent at the end of 2012. Total buffer capital utilisation by pension funds fell from 82 per cent at the end of 2011 to 71 per cent at the end of 2012.
Life insurance companies and pension funds face substantial challenges connected to rising life expectancy and low interest rates. As the Ministry of Finance has emphasised in its financial markets reports for several years, it is very important than life insurance companies and pension funds ensure that risk and solvency are balanced with a good margin of safety.
Non-life insurance companies achieved pre-tax profits of NOK 7.1 billion in 2012, about NOK 4 billion more than in the previous year. The profits shown in the technical accounts (profits on insurance activities), rose by 38 per cent. This is because premium income increased by approximately 7 per cent at the same time as compensation costs fell slightly. Simultaneously, net financial income rose from around NOK 2 billion in 2011 to NOK 4.5 billion in 2012.
The “combined ratio” specifies total compensation and other insurance-related operating costs as a percentage of premium income. It expresses the profitability of insurance operations, i.e. how much of their expenses non-life insurance companies can recover through their premiums. If the combined ratio is greater than 100 per cent, a company must have other income to break even, such as financial income. In 2012, the combined ratio for non-life insurance companies totalled almost 90 per cent, a drop from around 96 per cent the previous year; see Figure 2.19. Both the loss ratio (compensation payments as a percentage of premium income), and the cost ratio (operating costs as a percentage of premium income), fell. The drop in the cost ratio accounted for most of the decline in the combined ratio.
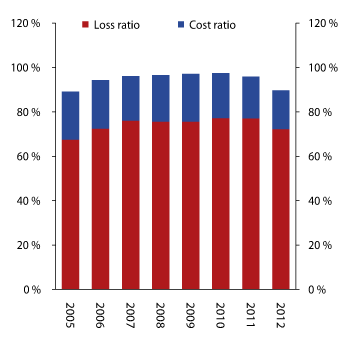
Figure 2.19 Development of the cost and loss ratios of non-life insurance companies
Source Finanstilsynet
Overall, the solvency of Norwegian non-life insurance companies was relatively good in 2012. Buffer capital utilisation totalled 41.8 per cent, compared to 55.4 per cent at the end of 2011.
2.6 Investment firms
Investment firms that are not banks achieved operating income of NOK 5.5 billion in 2012, approximately NOK 0.8 billion less than in the previous year. In 2012, the most important income sources for investment firms that are not integrated into banks were corporate finance (issue and advisory services), active portfolio management on behalf of investors, and investment advice. Investment firms that are not integrated into banks achieved total operating profits of NOK 590 million in 2012. This is NOK 135 million more than in the previous year.
2.7 Further details of competition in the banking market
This sub-section takes a closer look at competition in the banking market.
Strong competition between suppliers may enhance the efficiency of the economy. It may also spur innovation and thus contribute to increased economic growth. The economy as a whole may benefit from stronger competition between banks, but the relationship between banking competition and economic growth is complex. If the economy is to reap the benefits of increased bank competition fully, it is important to keep an eye on the relationship between financial stability and bank competition, and whether there are possibilities of ensuring financial stability while keeping a high degree of bank competition.
International research indicates that there may be a link between competition in the banking market and financial stability.5
Some authors claims that a high degree of competition may harm financial stability when profit margins of banks’ are squeezed, which in turn may spur bank risk-taking.6Ceteris paribus, reduced margins imply reduced interest rates on loans, which may induce higher household and enterprise debt. There is also claimed that a more decentralized market, makes it more difficult for regulators to assess the financial condition of the system as a whole, for instance because of uncertainty with regards to cascading effects between banks.
Other authors claim that the credit risk associated with bank loan portfolios is related to what profit margins the banks are operating with.7 Increased competition between banks, which may imply lower interest rates on loans, can reduce the credit risk. Furthermore, more competition can make the regulators’ jobs easier, as it constrain the growth of systemically important banks.
One potential characteristic of a highly competitive market is a high turnover of companies. Companies that are unable to handle the competition go bankrupt, and new companies can enter the market. This can also happen in the banking industry, although the effect may be less clear there than in other industries. Banks are subject to special rules that mean that the dynamism associated with competition and the flow of new companies in and out of the market is not as strong as in other markets. As a result, the market structure may, over time, differ from how it would have been in a different industry.
Assessing the degree of competition in the banking market is a difficult exercise. One helpful approach can be to combine different indicators. A frequently used measure of market concentration is the Herfindahl–Hirschmann Index (HHI), which equals the sum of the squared market shares of the suppliers in a market. A high HHI value shows that the market is relatively concentrated, a possible sign of lack of competition. An HHI value equal to 1 indicates a monopoly. An HHI value higher than 0.25 indicates that there is some degree of market concentration.8 Even though the HHI does not indicate competition directly, economic research suggests a clear connection between the two variables.9
Figure 2.20 illustrates the HHI trend based on market shares in the total assets of the Norwegian banking market in the period 1990–2011. The figure shows that the market has become increasingly concentrated in the last 10 years, with the exception of a short period around 2009 when market concentration fell.
When constructing a measure like the HHI, it is very important to consider what types of market are being examined. In fact, Norwegian banks compete in many sub-markets. The differences between the various sub-markets may, for example, relate to products and geography, and it can be difficult to distinguish the markets from one another. Different measures of concentration are most useful when analysing homogenous products in a delimited area. Accordingly, measures of concentration that include total market shares in respect of customer groups as diverse as personal customers and large undertakings have deficiencies as measures of competition.
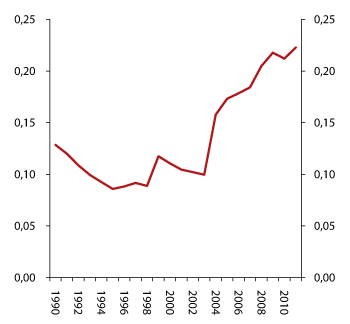
Figure 2.20 HHI trend based on market shares in total assets. Certain mortgage companies focused on specialised credit products, such as Eksportfinans and Kommunalbanken, are not included.
Source Finanstilsynet
Figure 2.21 shows the HHI trend for two sub-markets in the personal customer segment, in which products must be considered relatively homogenous.10 The graphs show that market concentration in the two markets peaked around 2004, and has subsequently fallen. Measured in this way, concentration in the markets for deposits from personal customers and residential mortgages for personal customers is relatively low. It can be noted that Figure 2.21 shows a different development trend than Figure 2.20. This may indicate that concentration in other parts of the banking market has increased quite substantially.
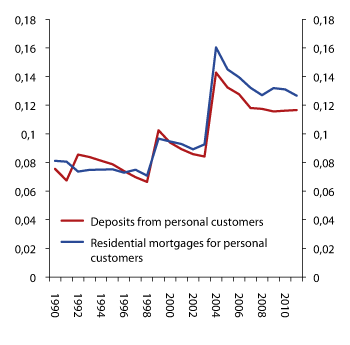
Figure 2.21 HHI for market shares for deposits from personal customers and residential mortgages for personal customers
Source Finanstilsynet
A further indicator of the degree of competition in the banking market is banks’ average interest rate margins (interest income minus interest costs). All other conditions being equal, there is reason to believe that higher competition results in lower interest rate margins.
Figure 2.22 shows that the interest rate margin relative to average total assets has been declining for several years. One explanation may be that competition has increased. However, the trend must also be considered in the light of other factors. For example, the Norwegian economy has experienced a long-lasting boom. A low rate of loan defaults, rising mortgage security and a generally strong real economy may have caused credit risk to be viewed as falling for many years. If this view is taken, falling credit risk will affect what risk premium banks should demand on their loans. An argument in support of this view is the trend of the difference between the average bank lending rate and the interest rate on a 10-year government bond, which may indicate the risk premium on bank loans. This difference has declined from 3.6 per cent in 1990 to around 1.6 percentage points in 2011, indicating that the risk premium has shrunk during this period.
However, falling lending rates relative to the interest rates paid on government securities are probably also linked to structural conditions in the banking market, such as the use of cost-cutting technology. This can be seen in figures for sectoral productivity growth in the national accounts. Productivity growth in the financial sector averaged about 4.6 per cent annually in the period 1990–2011, while general productivity growth in the economy during the same period totalled around 1.9 per cent annually, on average.
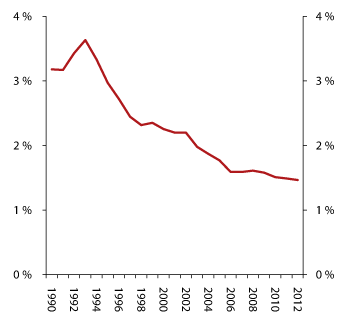
Figure 2.22 Trend of the interest rate margin (interest income minus interest costs). Percentage of average total assets
Source Finanstilsynet
Figure 2.23 shows that branches of foreign banks have entered the Norwegian banking market in the years since 1993. Their market share rose evenly and quickly until the financial crisis, when it fell back somewhat.
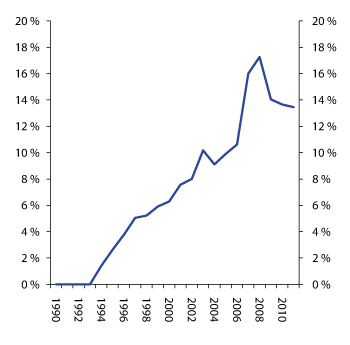
Figure 2.23 Market share trend for foreign branches in the Norwegian banking market, including both new establishments and former subsidiaries
Source Finanstilsynet
The increase in the participation of foreign entities in the Norwegian banking market suggests increased internationalisation, which is opening the door to additional suppliers and increased competition.
Footnotes
Canoy, M., M. van Dijk, J. Lemmen, R. de Mooij and J. Weigand. (2001). “Competition and Stability in Banking”. The Hague, Netherlands: CPB Netherlands Bureau for Economic Policy Analysis.
Keeley, M.C. «Depsoit insurance, risk and market power in banking» (1990). American Economic Review, 80, 1183 - 1200
De Nicolo, G and Lucchatta, M. «Bank Competition and Financial Stability. A General Equilibrium Exposition» (2013). CESifo Working Paper Series No. 4123
J.A. Bikker & K. Haaf (2002), “Competition, concentration and their relationship: An empirical analysis of the banking industry”, Journal of Banking & Finance, Vol 26, Issue 11.