2 Facts about social inequalities in health in Norway
«The Norwegian population enjoys good health. However, averages conceal major, systematic inequalities. Health is unevenly distributed between social groups in the population.»
Figure 2.1 Social inequalities in health
2.1 Systematic inequalities in health
The correlation between social position and health is gradual and continuous through all social strata. In general, it is not the case that there is a cut-off point in terms of income or education where health suddenly improves dramatically. This means that social inequalities in health pose a challenge on all social levels.
Textbox 2.1 Definitions
Social inequalities in health: inequalities in health that vary systematically with level of education, occupational group or level of income.
In this chapter, we use education – short (7–9 years), medium (10–12 years) or long (13 years or longer) – as the main indicator of social position.
Mortality: the number of deaths per 100 000 inhabitants per year.
Life expectancy is calculated on the basis of the mortality rate in all age groups at a given time.
It should be mentioned that hereditary factors do not explain social inequalities in health. Hereditary factors affect the individual’s health, but have little effect on systematic variations in health that follow education, occupation and income. Social inequalities in health are mainly due to differences in material, psychosocial and behaviour-related risk factors.
2.1.1 Substantial and growing social differences in mortality among adults
Figures 2.2 and 2.3 demonstrate trends in mortality according to level of education among adults (45–59 years) from the 1970s to the present (note that follow-up time was shorter in the last period. The individuals monitored in this period will be slightly younger and thus have slightly lower mortality). In the period since the 1970s, mortality has dropped for most educational groups, but it has dropped most in the group with the longest education. The inequalities between the educational groups have therefore increased. In 2001, life expectancy for 30-year-old men who had completed lower secondary school (i.e. a total of nine years of education) was 71.8 years, compared with 76.7 years for men with a university education. The corresponding figures for women were 78.0 years and 81.4 years respectively.
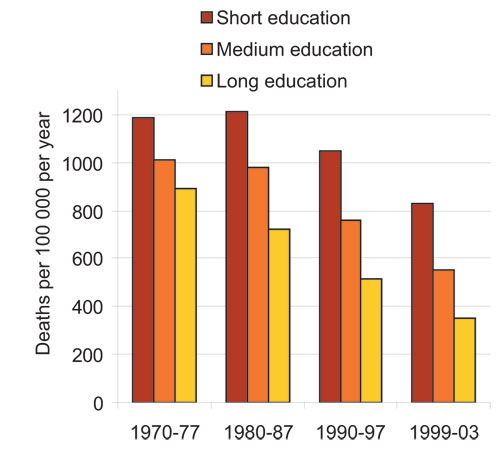
Figure 2.2 Mortality by education, men 45–59 years.
Source The Norwegian Institute of Public Health
Thedifferences in mortality are smaller for women than for men. This is primarily because women in this age group have lower mortality than men.
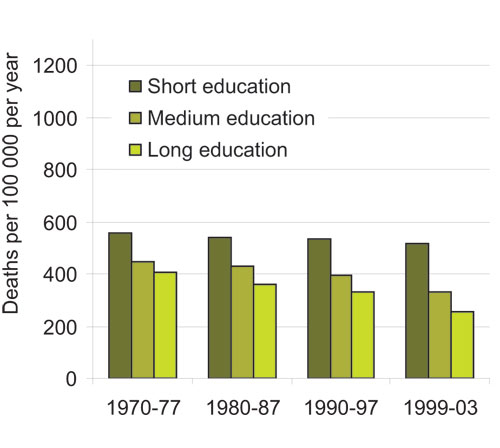
Figure 2.3 Mortality by education, women 45–59 years.
Source The Norwegian Institute of Public Health
We find social inequalities in health pretty much regardless of how we measure social position. Here we have used education to indicate social position, but there are also clear inequalities in health if we use occupation and income as indicators. We will discuss this later in the chapter.
2.1.2 Most of the main causes of death are unevenly distributed in society
Figures 2.2 and 2.3 show differences in mortality regardless of cause. In the age group 45–59 years, cardiovascular diseases are the dominant cause of death for both sexes. Figures 2.4 and 2.5 show cause-specific mortality rates for the various educational groups based on mortality figures from 1990–1997. (The category «Other» includes respiratory tract diseases and accidents/violent deaths). These figures show that the differences in mortality between the educational groups appear in all categories of cause of death. This suggests common, underlying causes – living conditions and social factors – that manifest themselves via different disease mechanisms. This consistent pattern is the reason why the World Health Organization recommends paying more attention to social factors than disease-specific solutions.

Figure 2.4 Cause-specific mortality by education, men 45–59 (1990–97).
Source The Norwegian Institute of Public Health

Figure 2.5 Cause-specific mortality by education, women 45–59 (1990–97).
Source The Norwegian Institute of Public Health
Statistics Norway’s health interview surveys, which are repeated every three or four years, include questions about self-assessed health. The results consistently show a higher percentage of people with a long education who regard their health as good or excellent than among people with a short education. The size of these differences has not changed significantly from 1995 to 2002 for men or women. Figure 2.6 shows the percentage of people in the different educational groups who assessed their health as good or excellent in 2002. The differences between the sexes are insignificant.
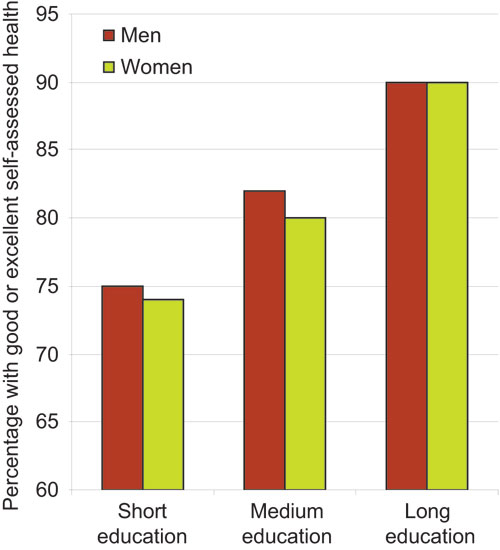
Figure 2.6 Percentage of people who assess their health as «good» or «excellent» by education, men and women 25–64 (2002).
Source Statistics Norway and the Norwegian Institute of Public Health.
These surveys also show that ever fewer people lose all their teeth. The number of teeth people have is used as an indicator of the population’s dental status. Self-assessed dental health generally follows the same social patterns as self-assessed general health.
2.1.3 Significant social inequalities in mental health
Statistics Norway’s health interview surveys also monitor mental health using a standardised battery of questions ( Hopkins Symptoms Check List). A score above a certain level indicates significant symptoms of depression or anxiety. There are clear inequalities between educational groups. Figure 2.7 shows that the inequalities in this area are significantly greater among women than among men. There were no material changes between 1998 and 2002 in this area.

Figure 2.7 Significant symptoms of depression and anxiety by education, men and women 25–64 (2002).
Source Statistics Norway and the Norwegian Institute of Public Health
2.1.4 Inequalities in health through the life course
Social inequalities in health are manifest throughout the whole life course. Although there have been marked improvements in survival in connection with birth and the first year of life, there is still a higher risk of stillbirth and death in the first year of life among children of parents with a short education. Infant mortality fell substantially in the period 1967–1998, and inequalities in mortality in the first four weeks of life – neonatal mortality– by mother’s education have also decreased. However, the inequalities in infant death after the first four weeks – post-neonatal mortality – have increased, mainly as a result of greater inequalities in sudden infant death syndrome and infections.
Children and young people in Norway generally have good health, and there have been few studies of possible social inequalities in health in these age groups. Some studies have observed a higher frequency of chronic disorders such as asthma, allergies and eczema in households where the parents have a short education. Social inequalities have also been found in mental health, especially in certain risk groups. For example, children of parents with mental ailments, children of parents with alcohol/drug problems and children that experience violence in the family.
Social inequalities in health are more pronounced in adults than at other stages of life. Social inequalities in health among adults are described above.
Inequalities in health remain marked up to a very old age. The oldest age groups are dominated by women, and they more often live alone and have a shorter education than the men in this age group. In this age group, men tend to be healthier than women.
Many of the most common categories of disease in the population take a long time to develop and are due to detrimental influences that accumulate throughout life. A growing number of international and Norwegian studies demonstrate that living conditions during childhood have a major influence on health later in life. Therefore, although social inequalities in health are often most pronounced in the adult population, we need to consider the entire life course in order to reduce inequalities in health.
2.2 Social structures affect health
The causes of social inequalities in health are to be found in many sectors of society. Below we will indicate some of the most important mechanisms that affect health and the distribution of health in the population. The topics discussed in this chapter correspond to the four priority areas defined in this Report to the Storting.
2.2.1 Income
There is a clear correlation between income and health in Norway, and the causes of this correlation are probably numerous. These complex mechanisms are further complicated by the dimension of time: observed mortality today may be due to factors long ago.
Figure 2.8 shows mortality among 45–60 year olds distributed over 20 equisized income groups. The income group at the far left in the figure is the five percent of the population with the lowest income, while the income group at the far right is the five percent of the population with the highest income.
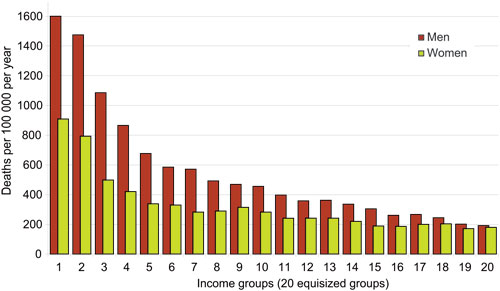
Figure 2.8 Mortality 1999–2003 for men and women 45–59 years, distributed over 20 equisized income groups.
Source The Norwegian Institute of Public Health
As is shown in figure 2.8, mortality gradually decreases as income increases. At the same time, the reduction in mortality gets smaller as income increases – the bars level out. The greatest differences in mortality are thus between the groups with the lowest income. This tendency is manifest for both sexes, although the mortality rate is lower for women in this age group.
The concave correlation between income and health is a well-known phenomenon and has been much discussed by researchers. One important explanation of the correlation is that access to financial resources directly affects the individual’s health, partly because more money allows people greater opportunities to invest in health – for example better residential environment, healthier food, health-promoting leisure activities and better health insurance. The health advantages of income gradually decrease as income increases, because there are fewer and eventually no more opportunities to invest further in health.
This kind of direct causal connection between income and health entails that narrowing the income gap will lead to reduction of inequalities in health and better average health. The health of the people in the highest income group in figure 2.8 will not deteriorate much by moving down a level or two on the income scale, but the people in the lowest groups will experience substantial health gains by moving upwards. So transferring income or other resources from the most advantaged people to the least advantaged will increase average health in the population. How big an impact income equalisation has on inequalities in health depends on a number of factors, including how strong the direct causal connection is between income and health. Many studies demonstrate this kind of causal connection, but there is debate as to how strong it is.
Another explanation of the correlation between income and health is that health affects income. Researchers call this health-related mobility. Good health means people have more time and energy to invest in their education and career, while poor health can cause problems for education and work. Researchers do not agree on how important these mechanisms are for the correlation between income and health. However, most agree it has the strongest impact in the lowest income groups. In these groups, financial problems and health problems create a vicious circle whereby a lack of money leads to worse health, which in turn leads to even less spending power. In the middle and higher income brackets, it seems that income affects health rather than vice versa.
A third explanation of the correlation between income and health is that there are common factors affecting both. It used to be commonly thought that genetics might help explain social inequalities in health, because our genes determine both our abilities and our health potential. It was believed that the lower down the income hierarchy you went, the more susceptibility genes you would find. Today we know that genetics does not explain socially patterned variations in health in the population. Genetics may be decisive in connection with some diseases, but genes are fairly evenly spread across the different income groups and do not explain inequalities in health that systematically follow income. Social and environmental factors play a much larger part in the social patterning of health we observe in the population.
There may also be other factors affecting both income and health. For example, we know that there is a correlation between education and health. There is also a correlation between education and income, although this correlation is not as clear in Norway as it is in a number of other countries. Occupation is another factor that can influence both income and health. The occupational groups that incur the most work-related health problems often also have a relatively low income.
Evidence suggests that the income gap is widening in Norway. The Gini coefficient, which is a measure of income inequality, has risen steadily in Norway over the last ten years (see box 2.2). However, this image of the widening income gap needs nuancing. The reason for the increase in income inequality is that the richest people are earning relatively much more. From 1990 to 2004, income inequality in the population remained fairly constant – with one notable exception: in 2004, the people in the upper tenth in terms of income had a much larger proportion of the total income than they did in 1990 (see figure 2.9). So, the increase in income inequality in Norway is primarily due to changes in income distribution among the wealthiest people.
Textbox 2.2 The Gini coefficient
The Gini coefficient is a measure of income distribution in the population. Using an imaginary situation where everyone in the population has exactly the same income as its starting point, it measures how far actual distribution is from this situation. A Gini coefficient of 0 means perfectly even income distribution (everyone has the same income); while a Gini coefficient of 1 means maximum inequality (one person has all the income). Real populations have a score of somewhere between 0 and 1, and the greater the inequality, the higher the Gini coefficient. In Norway, the Gini coefficient rose from just below 0.22 in 1990 to roughly 0.26 in 2000. In 2000, Denmark had a Gini coefficient of approx. 0.23, the OECD average was just above 0.3, and USA was at 0.35.
One problem with using the Gini coefficient to measure income inequality is that it does not indicate where in the income distribution the greatest inequalities are. Another problem is that it is relative, i.e. it does not say anything about the absolute level of income in a country. In principle, an extremely poor country can have the same Gini coefficient as a wealthy country.
For some years now, there has been international debate as to whether the size of the income gap – in society as a whole – has a separate impact on health, in addition to the direct effects that the individuals’ personal economy have on their health. The income inequality hypothesissuggests that average health is better in areas with small income inequalities than in areas with a large income gap. On the individual level, each individual will be best served by having the highest possible income, because this yields the best health; but if the income inequality hypothesis is correct, everyone will be better off if the individual inequalities are not too large. In areas where there are only relatively small differences between people, there may well be a stronger sense of community, less crime and less sense of impotence.
A Norwegian study published in December 2005 suggests that the income inequality hypothesis seems to apply, at least partly, in Norway. The study, based on deaths among adults (25–66 year olds) in Norway over a six-year period, found lower mortality rates in regions with smaller inequalities in income. This effect was primarily due to lower mortality among people with little education. Thus, the study did not confirm that everyone has better health in areas with less income inequality. What it did find was that people with less education and lower income benefit, in terms of health, from living in an area with a smaller income gap.
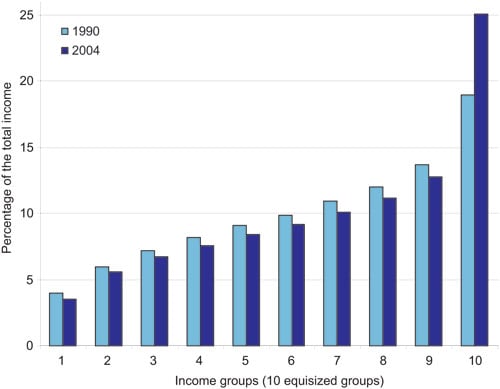
Figure 2.9 Distribution of household income (after tax, per consumer) for people, 1990 and 2004. Percentage of the total income per decile (tenth of the population).
Source Statistics Norway
2.2.2 Childhood conditions
The World Health Organization’s report The Solid Facts, detailing the significance of social circumstances for health, states that every stage in life is important and that children’s and young people’s development and education have life-long consequences for their health. Today’s social inequalities in health are partly due to inequalities in childhood conditions several decades ago. The Norwegian Institute of Public Health has recently published a study confirming that social and economic circumstances in childhood indirectly (through the person’s own education) and directly affect health later in life. The study demonstrates that for men there is a direct correlation between their father’s level of education and premature death as a result of cardiovascular diseases in adult life. Sons of men with little education are more likely to die early because of cardiovascular diseases.
Research on social inequalities in health in a life-course perspectiveis usually based on one of two main models. The first model assumes that there is a critical periodin life– usually very early – during which certain types of influence have major consequences for health later in life. An example of use of this model is the Norwegian doctor Anders Forsdahl’s pioneering studies into the correlation between early childhood living conditions and mortality from cardiovascular diseases in adult life. Forsdahl’s hypotheses have since been refined and confirmed in many varieties; for example, many studies have proven the significance of certain influences during pregnancy on morbidity as an adult.
The other main model within life-course studies of social inequalities in health is based on the idea that beneficial and detrimental influences on health accumulatethroughout life. Detrimental determinants of health are not randomly distributed in the population, but occur more frequently in some population groups than others. Each individual risk factor increases the risk of sickness and early death by a relatively small amount, but if the same people are exposed to many risk factors that accumulate, the final effect is significant.
These two main models – critical period and accumulation – are not necessarily mutually exclusive. It would appear that the health outcome being studied determines which of the models is most appropriate. Some diseases and conditions occur as a result of influences at certain periods in life, while it is more difficult to identify particularly sensitive periods for other diseases.

Figure 2.10 Selected indicators of living conditions for children in low-income families versus a random sample of families. Percentage.
Source Norwegian Social Research (NOVA)
International summaries of knowledge suggest that almost all studies of social position in childhood (measured using the parents’ social position) and mortality in adult life find a clear connection. The exact nature of the correlation varies. For some causes of death, for example lung cancer, the correlation tends to be described more indirectly, as a result of the individual’s own health behaviour as an adult. For mortality from cardiovascular diseases, factors in childhood and adulthood both play a direct role. For some causes of death, for example stomach cancer and strokes, factors in childhood play a decisive role.
Children’s living conditions are closely linked to the family’s socioeconomic circumstances. A report from Norwegian Social Research (NOVA) about the impact of the family’s income for children’s living conditions, shows that children in low-income families (under 60 % of the median income) have a lower score on a number of indicators than children from a random control sample (see figure 2.10).
Education constitutes a major part of children’s upbringing. As we stated earlier in this chapter, there are clear statistical correlations in the population between length of education and adult health. Nevertheless, research on social inequalities in health does not claim a causal relationship between lengthof education and health later in life. Over the course of life, however, a lackof education – by dropping out of the education system – may indirectly cause health problems. One in four pupils that started upper-secondary vocational training for the first time in 2000 did not complete their education (i.e. receive a certificate) in the following five years. We know something about who these pupils are: the percentage of young people who complete upper-secondary education increases with the parents’ level of education. Almost 80 % of the pupils and apprentices that started their education in 2000 whose parents had a long education completed their upper-secondary training in the normal time. By contrast, only 30 % of the pupils whose parents only have compulsory schooling completed their upper-secondary education in the normal time. We do not have much knowledge about what will happen to the pupils who did not complete upper-secondary schooling.
2.2.3 Work and working environment
Factors at work have an impact on health. These factors may be physical (ergonomic, chemical and biological), psychosocial or organisational. In keeping with other socioeconomic indicators (education and income), we find a continuous gradient of health according to position at work. We also find a gradient in exposure to harmful factors at work, within occupations and between different occupational categories. This exposure may be the risk of occupational strain injuries, the risk of accidents in the workplace, heavy lifts and gas or dust. However, there is insufficient documentation about the correlation between specific working-environment factors and the observed inequalities in health.

Figure 2.11 Life expectancy for a sample of occupations, men (based on occupation at the 1980 census and deaths recorded 1996–2000).
Source Statistics Norway
There are large variations in health between different occupational groups in Norway. Figures 2.11 and 2.12 show life expectancy for selected occupational groups in the population.
These two figures reveal fairly major differences in life expectancy between occupational groups, especially among men. While average life expectancy for a male chef is approx. 71 years, a male secondary school teacher can expect to live almost ten years longer. Statistically, waitresses live until almost 79 years, while female secondary school teachers live more than five years longer, on average.
There are several possible reasons for these kinds of correlations. Differences in working environment constitute one important explanation. Inequalities in health-related behaviour, such as smoking, diet and physical activity, also seem to vary according to different occupational groups to a certain extent. Finally, different forms of health-related mobility may also play a role. Health problems during education may, for example, cause an individual to fail to complete their chosen course of education, which in turn means that their choice of occupation is limited to jobs requiring little education. Inequalities in health between occupational groups are linked to education: the upper parts of figures 2.11 and 2.12 represent occupations requiring a relatively long education.
On average, around 30 000 work-related injuries are reported to the Norwegian labour inspection authorities each year, and in 2005, a total of 48 people died in accidents at the workplace in Norway. Almost all of the victims of fatal accidents were men, with the most at-risk industries being agriculture, forestry and the construction industry.
A Finnish study estimates that some 1800 deaths a year (i.e. 4 % of all deaths in all age groups) are due to factors in the working environment (sickness and injuries). Because mortality varies according to gender, age, occupation and industry and these vary from country to country, these figures cannot be applied to Norway without adjustment. However, we can be sure that the number of deaths as a result of work-related illness is much higher than the number of deaths due to workplace accidents. In the Finnish study, industrial accidents and other violent deaths (including murder and suicide) constituted only 4.5 % of all the work-related deaths.
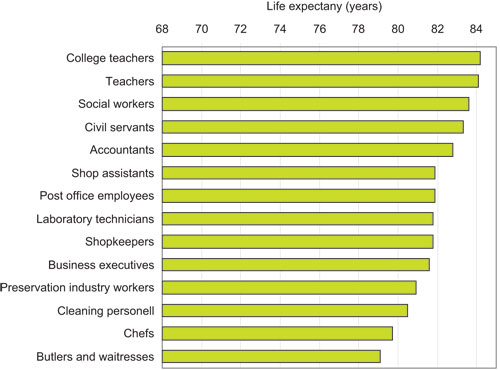
Figure 2.12 Life expectancy for a sample of occupations, women (based on occupation at the 1980 census and deaths recorded 1996–2000).
Source Statistics Norway
The Norwegian Labour Inspection Authority receives reports of 3000–3500 cases of work-related illness each year. In Norway, all doctors have a duty to report all cases of assumed work-related illness to the Norwegian Labour Inspection Authority, but it is up to the individual doctor to interpret what exactly this means. In 2003, only 3 % of GPs and fewer than 25 % of company doctors reported one or more cases of work-related illness to the Norwegian Labour Inspection Authority, and there is substantial underreporting or misrepresentative reporting of work-related injuries and illness. The Petroleum Safety Authority Norway receives an average of some 650 reports of work-related illness each year, and reporting in this sector is regarded as more complete than for most onshore industries.
Statistics Norway’s Survey of Living Conditions from 2003 shows that 44 % of the registered instances of sick leave during the last 12 months consisting of a continuous period of sickness absence of more than 14 days was stated as being work related. These surveys therefore suggest that a large part of absence from work due to sicknesses is work related. Women report the most health problems and are absent from work due to sickness more than men.
The business sector «health and social services» had the highest level of absence from work in Norway in 2005. Jobs in health and social services include considerable work-related strain, and a high proportion of women work in this sector. Women also tend to have more care tasks within the family. The high level of sickness absenteeism in the health sector is explained by work situations entailing strain and repetitive stress injuries and time pressure. Time pressure at work leading to extended working hours and overtime may in turn create problems in people’s private life. Stress and the feeling of always being behind may also have negative consequences for people’s health. Recent years have seen some major reforms, especially in the public sector, that may have led to more work-related strain in the health sector.
Textbox 2.3 The healthy worker effect
One methodological problem facing research on social inequalities in health based on occupation is the so-called «healthy worker effect». In occupations with major health problems, people who cannot bear the strain so well will disappear with time. This means that the remaining workers are healthier and have lower mortality. Thus, morbidity and mortality rates will often be underestimated in these kinds of occupations – which often entail heavy, manual labour. Some of the people who disappear from these kinds of physically demanding occupations will start working in less physical clerical occupations. Here the tendency will be that the health risk attached to these kinds of occupations is overestimated. In other words, the healthy worker effect entails underestimation of the inequalities in health between occupational groups.
The largest diagnosis groups for exclusion from employment because of extended sick leave and being put on a disability pension are musculoskeletal disorders (which make up some 45 % of all instances of sick pay) and mental ailments (approx. 17 % of instances of sick pay). Among people over the age of 45 years, musculoskeletal disorders are the most common cause of people being put on disability pension; among people under 45 years of age, mental ailments are the main reason.
These diagnosis groups are often linked with organisational and psychosocial factors in the working environment and working conditions that prevail in the labour market these days: increasing rate of change, technological developments, time pressure, and high efficiency and competency requirements. Several studies demonstrate a correlation between mobility at work and the risk of exclusion. Staff cutbacks in particular increase the risk of exclusion and sickness absence – even among the employees that remain. A study conducted by Statistics Norway revealed that fulltime employees who in 1993 worked in companies where there were staff cutbacks in the period 1993–1998, had 28 % higher probability of being put on a disability pension in 1999 than comparable people working in companies where there were no cutbacks.
Life expectancy is short for people outside the labour market. According to the calculations of life expectancy summarised in figures 2.11 and 2.12, life expectancy for occupationally passive men was only 67 years. This is three years shorter than for the occupationally active group with the shortest life expectancy. Occupationally passive women could expect to live for 80 years, which is slightly longer than the worst occupationally active groups. This is because many of the occupationally passive women included in the statistics have worked in the home as homemakers.
2.3 Systematic inequalities in health behaviour and access to health services
2.3.1 Health behaviour
Diseases where health behaviour contributes to the development of the disease constitute a major health challenge in Norway. These include type 2 diabetes, cardiovascular diseases, Chronic Obstructive Pulmonary Disease (COPD) and certain types of cancer.
Diet and physical activity
Differences in the population’s diet are linked to social background variables such as income and length of education. There are also substantial differences between women and men and between age groups. In general, we find that groups with a long education and high income eat a healthier diet than groups with a short education and low income. For example, groups with a long education have a higher intake of fruit and vegetables than groups with a short education. It has also been shown that children of parents with a long education eat more healthily and have more regular meals than children of parents with a short education.
The Oslo Health Study (HUBRO) reveals that one in five women and one in four men are inactive in their free time. In general, the level of physical activity in the population is too low. At the same time, there are clear social inequalities in level of activity. The proportion of physically inactive people is highest in groups with a short education and low income. People with a long education exercise more often than people with a short education. Children whose parents have a long education exercise more often than children whose parents have a short education. Surveys of the level of physical activity among young people in Oslo demonstrate that young people from well-off families tend to be more physically active than young people from poorer families.
Immigrants from South-Asian countries such as India, Pakistan and Sri Lanka have a significantly higher incidence of type 2 diabetes than the rest of the population. The incidence of type 2 diabetes in the age group 30–59 in the Romsås and Furuset urban districts of Oslo in 2000 was 28 % among women and 14 % among men from South Asia. By comparison, it was 3 % among women and 6 % among men of Western origins. Among people with a Western background, the risk of developing type 2 diabetes was greatest among the people with the lowest income or shortest education.
Smoking
Smoking is the health behaviour whose correlation with health is best documented. At the same time, it is the factor where the social inequalities are most obvious. Smokers are overrepresented in population groups with low income, short education and manual occupations. More than twice as many people smoke daily in the group with only compulsory education as do in the group with higher education. There are fewest smokers in technical/scientific occupations and most among people employed in the industrial and transport sector and unemployed people. In the group with low income or short education, people smoke more and they more frequently use the most addictive tobacco products. In addition, the average age at which people start smoking is lower, tolerance for passive smoking is greater and there are fewer restrictions on smoking at home in the lower social strata. People in this group are more often misinformed about the health risks associated with the various different types of tobacco products.
In the period 1976–2005, the proportion of daily smokers with higher education dropped from around 30 % to 13 %, while the proportion of daily smokers in the group with only compulsory schooling remained relatively stabile at around 40 %. Since this group has got smaller, it means that there are now fewer daily smokers. Among young people, there are more girls than boys who smoke. The reverse is true among non-Western immigrants. Young people whose parents are divorced, young people whose parents smoke and young people planning on taking vocational training are more likely to smoke than other young people.
Because smoking is so unevenly distributed in society, diseases related to smoking are also unevenly distributed. According to the report 2006:4 How lethal is smoking? from the Norwegian Institute of Public Health, 6700 deaths in 2003 (16 % of all deaths) were due to smoking. Among women, smoking caused 26 % of all deaths in the age group 40–70 years, while the corresponding figure for men was 40 %.
Intoxicants
The correlation between alcohol use and social background is more complex than it is for physical activity, diet and tobacco use. Among men, there is a J-shaped curve with men with the shortest education and lowest income drinking more than men with a slightly longer education and higher income, before the curve rises once again, with men with the longest education and highest income drinking most. The pattern is different for women: women with a short education drink less than women with a long education. However, groups with a short education often have more harmful use of alcohol than groups with a long education, i.e. they drink more at a time. This means that more people in the population groups with a short education and low income incur acute alcohol injuries.
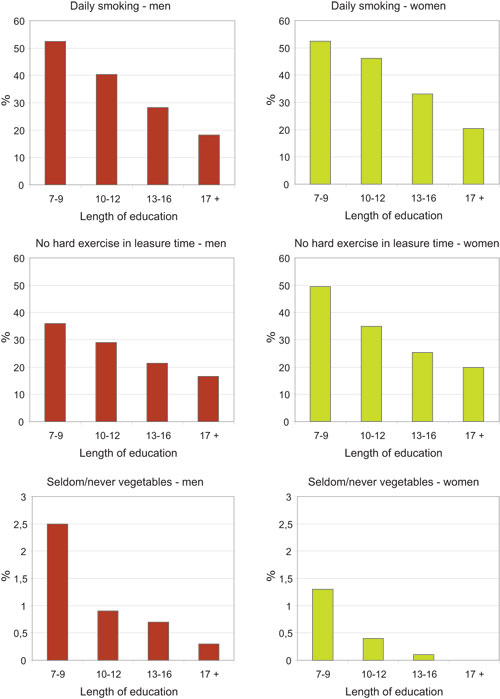
Figure 2.13 Inequalities in health behaviour by length of education, men and women 40–45 years.1
1 The diagrams show the percentage of self-reported smoking, no hard exercise in free time and seldom/never eat vegetables for men and women in the age group 40–45 by length of education. The figures are taken from health interview surveys in Oslo, Hedmark, Oppland, Troms and Finnmark counties, 2000–2003. 40–45 year-olds are not representative of the population as a whole, but the figures do give a good indication of the relationship between length of education and health behaviour in the population. The diagrams show that health behaviour varies systematically with length of education for smoking, physical activity and diet. The same tendencies are found among women and men. Inequalities in health behaviour are an important cause of the inequalities we see in morbidity and mortality among social groups in the population.
Source The Norwegian Institute of Public Health
Some population groups are particularly prone to developing alcohol and/or drug problems. For example, children whose parents are addicted to intoxicants and children of mentally ill parents, as well as children and young people who themselves have mental ailments. Against the background of other knowledge about social inequalities in health, there are grounds to believe that these kinds of risk factors vary according to social background, but this is an area where we still need more knowledge. Drug addicts and alcoholics are overrepresented in groups with a short education and low income. In many cases, abuse of intoxicants results in people losing their job and social problems, which may in turn serve to reinforce the drug/alcohol problem.
Textbox 2.4 Experiences with supervision
Service providers, both public and private, have a duty to abide by statutory requirements concerning their services and staff. As an added security, the authorities carry out supervision to make sure this is being done and to make sure that companies providing services check that their activities are being performed in compliance with the authorities’ requirements. State supervision is one of several policy instruments used to follow up the intentions in the legislation. Supervision focuses on organisations that provide social and health services. Health-care workers are also subject to supervision, and they are bound by a special professional law, the Health Personnel Act.
The experiences of the Norwegian Board of Health confirm that in many cases there are variations in the accessibility and quality of the services offered and that this affects different patient and user groups differently. There may be many causes of these variations. An underlying premise for large parts of the health service is that people requiring help must contact the health service themselves. Patients must also take the initiative to complain if they feel they have received poor treatment from the health service. This system works well for the majority, but it does tend to favour patients and next of kin with good resources: they know the health service, know what it can offer, and they know how to go about getting help. Basing access to services on self-selection entails that people who do not make their needs known, do not know their needs or are incapable of looking after their own best interests do not get help unless others take action on their behalf.
Supervision experiences from 2003 show that in many cases information about patients’ right to choose which hospital they receive treatment at within the specialist health service was unsatisfactory. A survey carried out by SINTEF Health shows that patients with a high use of health services tended to make less use of the right to choose hospital than other patients. The survey revealed that the system is used mostly for one-off interventions or consultations within the somatic part of the specialist health service and to a lesser extent by patients with chronic and/or complex disorders. Thus, patients with large needs and/or patients with little knowledge about the health service made less use than others of the opportunity to influence waiting time for health assistance.
In 2005, the Norwegian Board of Health inspected the municipal services for drug addicts and alcoholics. The reports from these supervisions demonstrate numerous substantial deficiencies in the services. This and other supervisions revealed major challenges for the services when patients and users have several or complex problems, as this requires coordination between services and between different levels of service.
In 2006, the Norwegian Board of Health carried out a nationwide supervision of services within interdisciplinary specialised treatment for drug addicts and alcoholics in the specialist health service. The summary of these supervisions along with the evaluation of the drug reform will provide a more extensive and thorough description and assessment of the capacity, quality and organisation of the services available to this group of patients.
Source Norwegian Board of Health
Accidents and injuries
Accidents and injuries are the fourth most important cause of death in Norway. The number of deaths as a result of injuries has been on the decline for the last 30 years, but injuries from accidents are still a major public health problem. At the same time, this is a field where we have good knowledge about causes and effective preventive measures. There is room for improvement by means of efforts in several sectors. There is a lack of research in Norway about social patterns in accidents and injuries. A Swedish study from 2002 suggests that there are more traffic accidents in groups with a short education and low income than in groups with a long education and high income. There are grounds to believe that there are major social inequalities in accidents in Norway too. On the basis of figures provided by Oslo accident and emergency unit in 2001, the Public Health Authority in Oslo has calculated that the frequency of injury is highest in the eastern urban districts of the city (Romsås, Grünerløkka-Sofienberg and Gamle Oslo) and lowest in the western urban districts (Bygdøy-Frogner, Ullern and Vinderen). We need research that studies these patterns in more detail and considers policy instruments to reduce the social inequalities.
Gambling addiction
Studies reveal that gambling addiction often coincides with other social and health disorders such as suicidal thoughts, stress-related symptoms and emotional problems. There also appears to be a relationship between gambling addiction and drug/alcohol abuse. Young people from low-income families are particularly vulnerable. According to a study from 2005 carried out by the market research company MMI about Norwegians’ gambling habits, the lowest income groups are overrepresented among people with gambling problems. This applies to slot machines in particular, but the ban on note acceptors introduced on 1 January 2006 has reduced slot machine turnover drastically. As is the case for consumption of tobacco and alcohol, accessibility is decisive for consumption. Groups with access to slot machines are more likely to develop a problem. We have insufficient knowledge about the situation with regard to social inequalities in addiction to online money games.
2.3.2 Health services
Little research has been done into the correlations between the use of the health services and social background in Norway. Of the studies that have been done, only a handful have attempted to study the use of services in connection with morbidity and patients’ needs. The studies referred to below nevertheless suggest that there is skew social distribution in the use of primary and specialist health services – especially if we look at use in connection with presumed need.
Research on the use of the health services among children and young people suggests that use of the specialist health services increases with the length of the parents’ education. As far as school health services and health centres for young people are concerned, it appears that use is determined more by needs than social position.
Among adults too, it seems that use of the specialist health services increases with length of education and size of income. The pattern appears to be reversed for use of primary health services, but not if we take morbidity into account, which is higher in groups with a shorter education and lower income.
Rehabilitation and habilitation services are often intended for people with low income (people receiving benefits and/or people with an unstable relationship with the labour market). Nevertheless, we have insufficient knowledge about the social component.
As regards mental health, few studies have focused on correlations between use of services and social background. One exception is the Oslo Health Study, which found more frequent use of psychologists or psychiatrists in inner city areas and in groups with lower incomes.
Few if any social inequalities have been found in the use of dental health services among children and young people in Norway. Among adults, there is a correlation between social background and taking contact with the dental health service, but once contact has been made, there do not appear to be any inequalities in use of services.
Statistics Norway recently carried out a study about the role of regular GPs as a gatekeeper for the specialist health service. This study suggests that there are few social inequalities in referrals if we overlook the fact that there are social inequalities in health in the different social groups. However, if the analysis takes account of the fact that people with little education have the poorest health, the study then shows that people with a short education are less frequently referred to a specialist than people with a long education.
Few studies have been undertaken in Norway to investigate whether different social groups receive different quality treatment. However, the issue of whether disparities in different social groups’ survival rates for certain diseases can be linked to factors in the health services has been studied for cancer. One study found that patients with low income, only compulsory schooling or manual work had a lower rate of survival of a number of types of cancer. Mortality is higher even if we take account of the spread of the cancer at the time of diagnosis. This suggests that various factors in the health service may affect mortality.
2.4 Groups with special health challenges
2.4.1 Groups with long-term social problems
Complex, long-term social problems that are detrimental to health are more prevalent in certain population groups; e.g., prisoners, long-term recipients of social assistance, heavy drug addicts and alcoholics and some immigrant groups. These groups are not necessarily poor, but many people live in difficult circumstances and have extensive health problems. This pattern also applies to children whose parents belong to these groups.
People with long-term social problems often have little or no contact with the labour market. As a result, they have not earned the right to a guaranteed income from the National Insurance Scheme or they receive low social security benefits. Examples include people who have spent time in institutions and some recently arrived immigrants. Many of these people are long-term recipients of financial social assistance. Long-term recipients of social assistance have poorer health than the rest of the population. Prisoners often have low education and are much more likely not to have a home, work or income than the rest of the population. Many are encumbered with large debts, are addicted to drugs and/or alcohol and have physical and mental ailments. Problems with drugs and alcohol drive many people into poverty, and heavy drug addicts and alcoholics are among the most disadvantaged people in Norway. Mental illness can lead to poverty because the illness makes it difficult for the sufferer to complete a course of education and hold down a job. More than 40 % of the patients undergoing forced psychiatric health care do not have their own home. These patients often have little education, poor personal economy and weak social ties.
Growing inequalities between people with low income and the rest of the population
The Norwegian Institute of Public Health has looked at trends in mortality in the age group 45–59 in the period 1994–2003 and compared the low-income group with the rest of the population (see figures 2.14 and 2.15).
Mortality among men in this age group is decreasing in the low-income group and in the rest of the population, but the inequalities between the groups is increasing. This is because the decrease in mortality is greater among men not in the low-income group. Among women, mortality is actually increasing in the low-income group, while it is decreasing for women above the low-income threshold. Income is measured as annual household income adjusted for the number of people in the household. The low-income group consists of people with an annual income below 50 % of the median income.
Financial circumstances in groups with reduced functional capacity
As a group, people with reduced functional capacity have less money to live off than the average for the population as a whole. Three main factors determine people’s financial circumstances: employment (and thus income from work), transfers from the state in the form of National Insurance benefits and social payments, and any extra costs incurred as a result of the individuals’ disability.
Statistics Norway’s Labour Force Surveys show that while around 75 % of the population as a whole are employed, only some 45 % of people with reduced functional capacity are employed. Add to that the fact that more physically disabled people tend to work part-time. There have not been any significant changes in this situation in the period 2000–2005.
Statistics Norway’s Survey of Living Conditions shows that on average people with limitations in functioning and participation have an income that constitutes around 75 % of the average income for the population as a whole. Almost 50 % of the income of people in these groups comes from different types of transfers.
People with reduced functional capacity often have various types of extra expenses, for example because they cannot make use of simple, cheap options available to other people and because they necessarily have a higher consumption of some products and services to compensate for their reduced functional capacity. We do not have adequate information about the size of these extra expenses, but they vary widely, for example, according to place of residence. A recent survey performed by ECON (a market research company) charting user fees for social services reveals major differences in how the individual municipalities practise the system of user charges.
2.4.2 Children and young people at risk
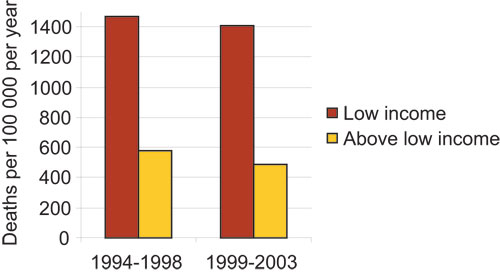
Figure 2.14 Mortality men 45–59 with and without low income, 1994–2003.
Source The Norwegian Institute of Public Health
Development of mental ailments and disorders in children is closely linked to family problems and a lack of social resources. Some children and young people grow up in such difficult conditions that they have a higher probability of developing mental ailments and disorders before they are even born. Children in families where the parents have mental ailments, abuse drugs and/or alcohol or are violent have an especially high risk of developing mental ailments. At least 15 000 children under the age of 18 live with one or two parents who are receiving some form of mental health care treatment. Add to this figure children living with parents with mental ailments who are not receiving treatment. It is difficult to calculate how many children are being affected by their parents’ drug or alcohol abuse, as this is often covert, but we reckon that around 10 % of the population have an alcohol/drug problem and we know that many of these people live with children under the age of 18 years.
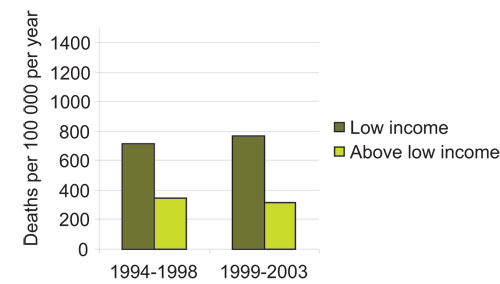
Figure 2.15 Mortality women 45–59 with and without low income, 1994–2003.
Source The Norwegian Institute of Public Health
A survey by the Norwegian Institute for Urban and Regional Research (NIBR) shows that some 99 000 children and young people received assistance from the child welfare authorities in the period 1990 to 2002. This constitutes approx. 6 % of all the children and young people under 18 in Norway. Just over 10 000 of them had spent time in a child welfare institution. The survey showed that children and young people who are in contact with the child welfare authorities, and their biological parents, tend to have more health problems than other families. Recent studies show an overrepresentation of death due to illness and violent deaths (accidents, suicide, murder) in this group. Children receiving assistance from the child welfare authorities tend to have parents with a lower income, shorter education and poorer health. We also know that long-term clients of the child welfare authorities are more frequently boys, have parents with a short education and low income, are children of unmarried mothers and have more often been neglected or abused.
Half of all inmates in Norwegian prisons have children. This means that some 4000 children a year experience their mother or father being imprisoned. This may have serious consequences for the child’s life situation and development, in the form of shame, grief, insecurity, anxiety, missing their parent, the risk of bullying and parental conflicts.
2.4.3 Immigrants
There are major inequalities in education and income between different groups of immigrants, and it seems that inequalities in morbidity and mortality vary more between immigrant groups than they do in the rest of the population. It is common knowledge that some immigrant groups are more predisposed to some diseases. The Oslo Health Study revealed that immigrants from non-Western countries have more psychiatric problems than other Norwegians. Refugees are particularly prone to a high frequency of mental ailments. Torture, incarceration and other traumatic events explain some of the increased frequency of mental ailments we find among refugees. The main social explanation seems to be unemployment on arrival in Norway, and to a lesser extent financial problems. Important psychosocial explanations include: lack of integration in Norwegian society, discrimination (for example in the housing market), and a general feeling of impotence. 24 % of immigrants from Asia and Africa have mental ailments. 12 % of immigrants from Western Europe and the United States have mental ailments. The corresponding figure for ethnic Norwegians is 10 %.
There is a higher incidence of certain communicable diseases such as tuberculosis, HIV, hepatitis A and B, malaria, typhoid fever and shigellosis in some immigrant groups. Self-reported morbidity is higher in some immigrant groups than in the population as a whole. Studies from Oslo suggest higher incidence of obesity among female immigrants from Turkey and Pakistan in particular. Type 2 diabetes is more common in many immigrant groups, especially among people from the Indian subcontinent.
There has been a positive turn in dental health in children and young people in the population. However, studies show that children with an immigrant background have three to four times poorer dental health than other Norwegian children.
Women from Sri Lanka, Pakistan and Vietnam smoke far less than women born in Norway. By contrast, smoking is much more common in some male immigrant groups than in the rest of the population.
Some immigrant groups are not very physically active and seem less inclined to use low-fat food products than the rest of the Norwegian population. Vitamin D deficiency is more common among immigrants from Pakistan, Turkey, Iran and Sri Lanka. Immigrants of Pakistani origins have a greater risk of stillbirth, sudden infant death syndrome and birth defects. Women from Somalia had more complications in connection with childbirth than other women. In Oslo, it was also found that immigrants were overrepresented among applicants for abortion. Further studies need to be undertaken to clarify socioeconomic factors and health among immigrants in Norway.
2.4.4 Areas with Sami and Norwegian settlements
We currently have little knowledge about the correlation between social factors and health in the Sami population, and few studies have been undertaken comparing Sami and Norwegian circumstances. This is partly due to the fact that many of the health and living conditions surveys that have been carried out have not taken sufficient account of ethnic background and special Sami living conditions. The Centre for Sami Health Research has conducted a survey into health and living conditions in areas with Sami and Norwegian settlements (SAMINOR). This study splits the sample population into three categories: 1) people who speak Sami at home and whose parents and grandparents speak/spoke Sami at home, 2) other people who state they are of Sami origins, and 3) people who state they are of Norwegian origins (including Kvens and immigrants). One purpose of this study was to ascertain the degree of satisfaction with the municipal primary health care service in areas with Sami and Norwegian populations. Patients who spoke Sami were generally less satisfied with the municipal medical services than the Norwegian-speaking patients. They were less satisfied with the doctor’s command of the language and stated that there were more misunderstandings between doctor and patient caused by language problems. One third stated that they did not wish to use an interpreter. The results indicate that great importance should be attached to applicants’ language skills when employing doctors in municipalities within the administrative area for the Sami language. This might improve satisfaction with the medical services.
Education is used as an indicator of social inequalities. There are major inequalities in education between the three categories, especially among the elderly. At the same time, it is important to underline that education as an indicator of social background does not necessarily reflect social inequalities in connection with indigenous peoples in the same way as in a monocultural Norwegian population. Within the same level of education, there are few inequalities in self-reported morbidity among the three categories once we have adjusted for age and sex.
There are major inequalities among the categories in terms of health behaviour, but preliminary analyses suggest that this is not so clearly reflected in self-reported sickness.
Preliminary analyses of the material in SAMINOR show that among the Sami population in category 1, one in three have experienced discrimination because of their Sami identity. This corresponds with other studies done to ascertain self-experienced discrimination among Samis. For example, a report from Norut NIBR Finnmark shows that one in four Samis have experienced ethnic discrimination during the last two years. In general, we know from other studies that ethnic discrimination is associated with lower health status. This association is most clearly connected with mental health, and there are grounds to believe that this may apply to the Sami population as well.
2.4.5 People living alone
Several studies appear to indicate that married and cohabiting people consistently have better mental and physical health than unmarried and previously married people. In particular, divorcees and widows/widowers have poorer mental health than others, often manifest in the form of more depression and anxiety, but also higher mortality. This may be partly related to the fact that marriage and cohabitation provide social support and partly due to the fact that married/cohabiting couples have fewer financial problems than people living alone.
Men and women living alone (age 45–59) with a short education and/or low income have a relatively high risk of death by Norwegian standards. Data from Statistics Norway’s health interview surveys show that single people are particularly prone to financial problems and more frequently experience relationship breakdown. Single providers are the group that struggle the most with serious financial problems. Divorce also seems to triple the risk of long-term incapacity for work.
Since the percentage of people living alone in general, and in particular divorcees, is continuing to rise, health problems in these groups constitute a growing public health problem. This will also affect social inequalities in health. According to Statistics Norway, relationship breakdown is one of the factors that yield the greatest risk of low income. Children living in low-income families often have a single main provider with a short education. Lone providers’ social problems can have a huge impact on their own and their children’s mental and physical health. Although most children with single or divorced parents manage well, one Norwegian study has shown that divorce increases the risk of mental ailments during adolescence and adult life.