3 Trends and challenges
3.1 More people attracted to urban life
It is attractive to live in cities for many Norwegians. People are attracted to the opportunities and the pulsating life. The opportunity for a more anonymous or uninhibited life style than would be possible in a small community is another attraction.
Cities offer a wide array of educational opportunities for people of all ages. Large and varied job markets give a greater choice of profession and career. At the same time, it is easier for parents with small children to obtain flexible work arrangements. Bigger markets result in a broader assortment of products and more specialised stores and services.
Cities and towns can offer varied forms of housing and building-structures. This makes it more likely that an individual will find housing that meets the needs of their particular life situation, whether it is a small studio, a larger apartment, a town house, single family home, or other type of housing.
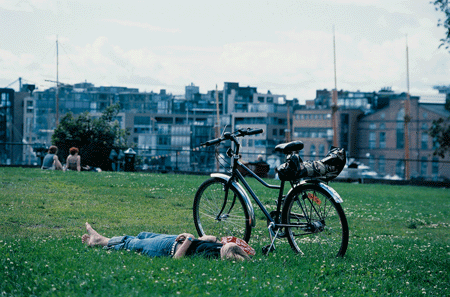
Figure 3.1 Centrally located parks and green structures are important recreational areas.
Photo: Svein Magne Fredriksen
The good life in the city is characterised by rich and diverse cultural and leisure activities that satisfy most people's desires and needs. Movie theatres, galleries, concert venues, restaurants, cafés and bars, libraries and museums give new impressions and mental stimuli, while sport centres and fitness studios create opportunities for phsyical activities.
Cultural heritage sites and milieus reflect a foundation for our present and future society, and give us feelings of identity and belonging, as well as providing roots for our own life. Cities and towns are like history books with numerous stories. Still, new functions and architecture further develop the identity of the place and improve our physical surroundings in keeping with more modern values.
City life involves vast opportunities for social encounters with people outside organised networks, whether in the neighbourhood, in public spaces like parks, squares and playgrounds, or nightlife. In the bigger cities, there are also people of diverse nationalities, religions and cultures, which give us new knowledge and stimuli, expand our horizons and create closer ties to international communities.
Most Norwegian cities and towns have a special relationship to nature, facing the ocean with rivers, hills and forests giving form and identity. River and creeks are important elements of the city, and trails, parks and beaches are often found in close proximity to housing and businesses. The combination of urban opportunities and vicinity to nature and recreational experiences makes it easier to lead a good life in densely developed areas. Nature is also important for our physical health because it promotes physical activity, sports and outdoor leisure activities – what is for many people a necessity for a healthy life.
Cities and towns have a lot to offer inhabitants and visitors, but without sufficient accessibility, the opportunities are worth little. Accessibility is also necessary for the inhabitants to maintain their social networks, which are increasingly spread out geographically. In most cities, there is a wide range transportation methods – bus, tram, metro, train, boat, private car, bicycle or foot. A great variety of transportation leads to flexibility in everyday life – also with regard to choosing environmentally friendly and health-enhancing transportation alternatives to the car.
The Government considers it important to accommodate and support development that protects and improves the qualities of city life.
3.2 Environmental quality is a competetive advantage for cities
The same driving forces and trends – whether of economical, political or cultural nature — have an increasingly large impact on countries, cities and individuals. Globalisation leads to more intense competition to attract businesses that results in economic development. The national policy for city development supports the policy for business development by making the country attractive for the establishment of new businesses and the development of innovative, successful industries. Norway’s petroleum resources will not last forever, and during the next decades it will be necessary to develop several new industries to supplement and partially replace the current industrial structure.
Many european countries are now emphasising long-term strategic planning to strengthen the cities' competitiveness and economic development. Planning like this must be based on the cities' special characteristics and comparative advantages. Successful cities have managed to co-ordinate policies for cultural and economic development with the policy of developing functional city-structures and environmentally friendly transport. Economic policy and policies for city development are increasingly two sides of the same issue.
The Government believes new models for voluntary and binding co-operation are necessary to accomplish such strategies. Public authorities should be proactive, by producing guidelines and to work as a driving force for desired development.
Capital moves easily, and human mobility is increasing. This makes cities' and towns' attractiveness with regard to environment, cultural and social needs a more important factor for localisation and investment decisions in the private sector.
A good environmental profile is increasingly becoming a competitive advantage – not only for the individual business, but also for inter-competetive cities. The main objective of environmental policy is to protect the eco-systems representing the foundation for all economic activity. There is consequently a close relationship between environmental policy and long-term economic policy. Successful industries that continue to generate value over time, do not impact the environment negatively, but operate within the limits of what the natural and man-made environment tolerates.
City policy should aim to achieve sustainable development which best accommodates positive trends in the private business sector. To public authorities, the main challenge is to develop consistent, predictable conditions that pave the way for an efficient private sector, business innovation, establishing of new businesses, and secure investments.
3.3 Cities and towns are growing
Norwegian cities and towns have been growing steadily during the last decades, both in numbers of inhabitants and jobs. People moving into the cities, including immigration from foreign countries, have contributed most to the growth of the largest cities during the last 30 years. At the same time, a higher birth rate in the cities has strengthened this growth. For example, compared to the general growth, Oslo has had a relatively higher share of new births.
The population growth has been most significant in the central eastern provinces of the country and in the southwest, centralisation towards cities and towns all over the country can be observed. About half the population are now living in the country’s 10 largest cities, and 77 % of the population are living in the country's 900 cities and towns. A town is here defined as an area of at least 200 persons, where there is normally less than 50 meters between buildings.

Figure 3.2 The population development in towns of varying size from 1990 to 2000.
Source Statistics Norway
More and more families with children also desire centrally located dwellings. During the 1990s, the increased number of children living in the dense parts of cities has been a general tendency all over Europe. In Oslo, for example, the number of children younger than 14 years living in downtown areas doubled from 1988 to 1998. Students and young people with higher education are often attracted to urban life in downtown areas, and they are increasingly staying after having children.
Parallel to this, there are substantial trends for centralisation within business development, especially in the international and service industries. Businesses are establishing centrally because of vicinity to business partners and customers, efficient transport, and not least to attract a high-competency work force.
The city regions were responsible for most of the country's business growth and new jobs already during the 1980s. This evolution continued during the 1990s, when the largest city regions experienced 80 percent of the growth. Employment has increased strongest in the region of the capital Oslo. Cities are continuously gaining more important roles in business development and economic growth.
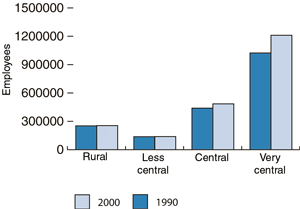
Figure 3.3 The development of employed people in municipalities of different centrality.
Source Statistics Norway
3.4 Land-use and transport
3.4.1 Cities are still expanding, but at a slower rate than before
The strong growth of inhabitants and jobs in the cities is resulting in a substantial demand for land. This pressure is strengthened by the fact that land-use per inhabitant is steadily increasing, as a result of less people per household and other trends. The land-use per inhabitant in cities increased from 450 square meters in 1970 to 550 in 1990. Most of the growth came during the 1970s, but land-use is still increasing at a higher rate than the number of inhabitants. The result is urban sprawl and lower density.
This urban sprawl leads to greater distances between houoseholds, work places and services, which leads to a greater need for transport, particularly with the private car. This contributes to the reduction of biological diversity, encroaches on agricultural land of high production value, and threatens other areas of natural and cultural value.
However, land-use per inhabitant is significantly lower in the large cities than in smaller cities and towns. This is partly due to urban dwellings that are more land-use-efficient. The building pattern in towns is more strongly dominated by single, family homes, and there is often a higher share of undeveloped land in smaller towns.
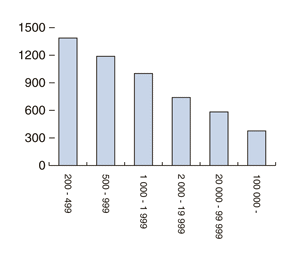
Figure 3.4 Square meters of built land per inhabitant in cities and towns of varying size.
Source Statistics Norway
Preliminary calculations from the national bureau of statistics show that on average, 32 % of the land in towns is used for housing. The share varies from 23 % in the smallest towns with less than 500 inhabitants, to 37 % in towns housing 20.000- 100.000 inhabitants. Around 10 % of the land within the borders of towns is used for businesses, and somewhat more than 15 % is used for roads and transport, and these numbers seem to be independent of the size of the town. In the smallest towns, 50 % of the land is not utilised, while this share is 35 % in the larger towns.
The demand for centrally located dwellings in cities has been substantially higher than the number of dwellings available. This creates an imbalance in the market and a price-spiral that is disadvantegous for most people. Today, there are enormous price differences between centrally located dwellings and more peripherally located housing.
Expensive housing centrally, and the resulting increased demand for housing in more rural surroundings, intensifies the pressure on development in peripheral zones of the growth areas. Competing with the cities, municipalities around the cities often offer relatively less dense housing in order to attract new inhabitants that can strengthen their local economy. However, less dense development weakens the market-foundation for public transport to succeed. This leads to increased use of the private cars for transport, demand for more road capacity into the cities, and consequently more strain on the environment.
A main challenge for local authorities is to achieve better regional co-ordination of development patterns and transportation systems, in order to secure sufficient and strategically located housing related to the public transport system. Some cities and surrounding municipalities have already changed their development policy towards more concentrated building of dwellings within the building zone and around public transportation nodes. One example of this is the Jæren region; which is referred to in chapter 4.
The private sector has contributed to urban sprawl, both through restructuring and new acitivities. Many businesses moved out of centrally located areas in cities to more peripheral zones, where property prices were lower and road access more convenient. Production and storage businesses are not the only ones localising along main roads with spacious areas for parking; shopping malls and commercial retail outlets have also decided this is often suitable. At the same time, many public institutions in health, education and other fields, have established themselves in the cities' outer zones.
During the last few years, however, there have been clear signs of change in the pattern of business localisation. Particularly businesses in the growth industries – knowledge, high-tech and service – prefer a central localisation. Opportunities to promote the business with a modern image and urban qualities are important, among other reasons, to attract the most competent work force. Shopping malls increasingly being established in city-centres is another obvious trend. Also other businesses oriented towards a greater market of customers, for example movie theatres and swim-park centres, are now being centrally located. There are also changes within the freight transportation industry, changing the ports' needs for land and localisation.
These trends have resulted in new opportunities for transforming previous industry areas in central parts of cities into housing and diverse urban functions, including shopping centres, cultural venues and recreational areas for outdoor activities. This makes the city-centres more attractive for living, and it contributes to synergy between housing and business development that strengthens the evolution of more concentrated and sustainable cities.
New building projects in cities and towns are often controversial. Green structures may be threatened, related areas may be exposed to more traffic, noise and pollution, and other overall poorer conditions because of a loss of sun, light and view. New development that does not involve the protection and utilisation of cultural heritage and environments to a sufficient extent may reduce the qualities and special characteristics of the area.
Better utilisation of built-up areas has been an important question for cities and towns for several years. Many municipalities have emphasised infill projects in their land-use plans, but there has been less focus on the special challenges these kinds of strategies represent in the implementation phase. Accomplishment of infill projects of high quality is highly complicated and demanding for both public and private parties. Difficult ownership structures, interest-conflicts, high land values, and large infrastructure investments make infill projects highly demanding to realise.
The municipalities have functions as both organisers and negotiators, and must at the same time assure political support for realising building projects. Successful realisastion of infill projects of high quality often gives a windfall situation with a positive economic effect for society as a whole. It is a challenge to the municipalities to develop plans and strategies for city transformation that safeguard existing qualities and prioritise the important criteria in new development.
3.4.2 Concentrated development strengthens environmentally friendly transport
The private car has increased our geographical radius and improved our freedom of movement and flexibility in daily life. It has been an important element in general welfare development. However, the increased use of car transport has also contributed to make urban sprawl possible in city-regions.
The pattern of development significantly impacts the competitive situation between the different transportation modes. Less dense development intensifies the growth of transport needs, congestion problems, expensive expansions of the road system and increased environmental strain. At the same time, it remains increasingly difficult and expensive to serve cities and towns with public transport. Long distances and an insufficient network of bicycle lanes and pathway make it less attractive to walk and bicycle.
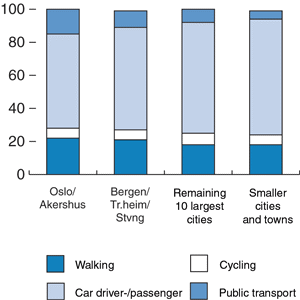
Figure 3.5 Transportation mode distribution in different city regions in 1998.
Source Institute of Transport Economics
To solve the transportation challenges in big cities, transportation growth must to a larger extent be taken by public transport. This requires, among other factors, more dense development. Dense development will also result in less time consuming travel and make it easier to choose environmentally friendly and health-enhancing transportation modes like bicycling and walking. The available choice of transport modes for the individual will increase and make daily life easier.
The overall picture is that the public transport share in cities is low; 10-15 % in the largest cities. In smaller cities and towns, the share is even lower. This is due to smaller markets of potential passengers and less dense development in smaller cities.
Between 1980 and 2000, travel by private car increased by 74 % in the nation as a whole, while travel by public transport (except air travel) hardly changed at all. The last few years though, there has been an increase in travel by public transport by 13 %, not including air travel. It is particularly rail transport on short and medium-distance trips that is increasing, both suburban and intercity transport.
In the seven largest urban agglomerations, the number of trips by public transport per inhabitant (bus, metro, tram) decreased by 10 % from 1986 to 1992, but then again increased by 5 % between 1992 and 1999. There are significant differences between city regions, and the rise after 1992 is greatly due to the increase in passengers in Oslo. A more detailed description of the public transport development can be found in the White Paper on Public Transport.
3.5 Less physical activity and increased health costs
3.5.1 Structural social changes decrease individual inactivity
Society has changed considerably during recent decades, and some of the changes have had significant impacts on our daily levels of activity. Errands and activities that previously required at least some walking or cycling are now often done by car. Nearly 60 % of all trips by car are shorter than 5 kilometres. Longer distances between dwellings, jobs and other nodes of activity lead to more motorised transport. A general rise in wealth means easier access to technical equipment that makes physical activity avoidable.
Children's playing has to a greater extent moved indoors during the last generation. More and more children are physically inactive. A quarter of Norwegian children spend more than four hours per day in front of television and computer screens. Children are increasingly spending time within the boundaries of kindergartens and schoolyards, where the possibilities for physical activity for children are limited, because of insufficient play-area.
Research also shows that motorised transportation by car or bus to schools, kindergartens and organised leisure activities is increasing. One of the causes is probably increased accident risk as a result of more traffic. A study of children's transportation patterns in the spring of 2000 showed that 50 % of the pupils aged 6 to 15 were being brought to school by car.
3.5.2 Inactivity increases risk of developing several common diseases
Physical inactivity involves increased risk of developing several common diseases. Inactivity leads to a higher risk of developing diabetes, cardiovascular diseases, high blood pressure, some forms of cancer and other serious illnesses. Estimates from Finland indicate that 30-40 % of all new incidents of cardiovascular diseases are due to lack of physical activity. For children, inactivity leads to underdeveloped physical skills, reduced muscular power and endurance, as well as increased risk for obesity.
The World Health Organisation (WHO) describes the rise of overweight and obesity as a global epidemic with enormous consequences for the population's health and society's health care costs. The average weight of Norwegian men has escalated by more than 9 kilos from the beginning of the 1960s until today. Women's weight has increased at the same rate since the 1980s. A recent study from Oslo shows an adjusted average weight gain of 3 kilos among children aged nine since 1975.
Textbox 3.1 Physical inactivity increases society's health costs
The population's level of daily physical activity have changed considerably during a relatively short period of time. It is increasingly easy to be physically inactive. This results in poor health and a number of diseases and ailments, which give society huge treatment costs and the individual reduced quality of life. It is not possible to calculate exact figures of the economic gains related to regular physical activity, but increased activity levels would without doubt lead to enormous savings within the health care sector.
Diabetes II is one of the fastest growing diseases in the population, with more than 5,000 new incidents every year. The treatment costs of diabetes were about NOK 4.4 billion in 1999 (ca. 0.5 billion Euros). Moderate physical activity is assumed to reduce the growth of new cases by more than 20 %. For cancer, society's costs are estimated to be more than 1.1 billion euros per year, and physical activity may reduce the growth of new cancer occurrences with about 10 %. Medication for treatment of high blood pressure costs NOK 1-1.5 billion per year, and physical activity has great potential to prevent and reduce high blood pressure.
In addition to these three diseases, there are a number of other illnesses, such as muscular and skeletal ailments, rheumatism, epilepsy and psychological complaints, where physical activity may have great preventive impact. For example, muscular and skeletal ailments constitute more than 50 % of the illnesses causing sick leave. Total sick leave payments for private businesses and public authorities are around 5 billion Euros per year.
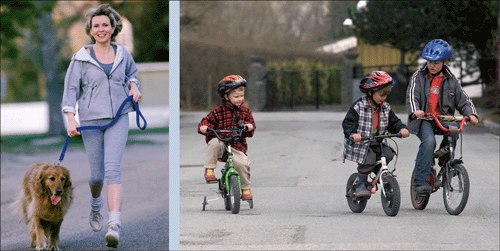
Figure 3.6 Recreation and play in the city. It is important to create opportunities for physical activity.
Photo: Scanpix, Gorm Kallestad
Half an hour a day is sufficient!
Regular physical activity protects against the development of a wide range of common diseases. Moderate physical activity of half an hour a day will give significant health gains for inactive people. Additional activity will improve health even more. Active transport like walking and biking gives low-impact exercise that can easily be integrated in daily life, without requiring special equipment. For many people, this may be the most pleasant and natural way to achieve the recommended daily activity level.
Textbox 3.2 The London-Charter on Transport, Environment and Health
The third Minister Conference on Transport, Environment and Health in London 1999, resulted in the so-called London-Charter. The Charter was a result of a process, in which WHO, and a series of Governments in Europe, recognized the need to develop a co-ordinated international approach to the challenges that transport cause to environmental and health issues.
The Charter complete earlier initiatives, and support the work to reduce the negative impacts the transport sector causes. The Charter was particularly oriented towards the challenges in regards to health, and the need to develop comprehensive strategies, in order to reduce car-use and promote walking, cycling and public transport.
The Charter was prepared with active participation from the Ministers of Transport, Environment and Health (the members of WHO Europe), together with international organisations, interest groups and experts.
The Charter contains key knowledge in regards to the inter-relation between transport, environment and health. It describes principles and strategies, in order to achieve a sustainable and health-enhancing transport. After the adoption of the charter in London in 1999, there has been considerable international emphasis on improving methods, high-level meetings and ad hoc experts group, in order to ensure implementation.
The following three key areas are prioritised:
Integrate important aspects in regards to environment and health in the transport policy, by developing new methods, monitoring, capacity building and new types of co-operation
Environmentally friendly transport through investment strategies, land-use policies and comprehensive packages
Develop sustainable city transport through integrated external conditions, and initiate measures and means that promote walking, cycling and public transport
For children and youth, regular physical activity is necessary for normal growth and development, and it is of great importance for their health. Kindergartens, schoolyards and residential areas should therefore be inviting and exciting for different kinds of play and outdoor physical activity.
In 1999, about 865,000 Norwegians were more than 60 years old, and these people are heavy users of health services. Regular physical activity is of crucial importance for the functionality, self-sufficiency and quality of life, also for the elderly people.
3.5.3 The challenge is to accommodate active transport and lifestyles
Land-use and transportation planning is of great importance for choosing health-enhancing transport modes and lifestyles. More concentrated city-structures and better conditions for walking and biking will increase the levels of physical activity.
It is also important to plan for residential areas that boost activity in local neighbourhoods. In addition to swimming pools, people rate nearby forests, trails and bicycle paths as the most important element for their levels of physical activity. Several studies show that over 50 % would establish regularly habits of physical activity, if local opportunities were provided.
In order to integrate preventive health policies more efficiently into land-use and transportation planning, it is necessary to develop and communicate the knowledge about relationships between land-use, city-structures, transport choices, physical activity and health.
3.6 Environmental challenges
3.6.1 Noise
Noise is an environmental problem impacting many people in Norway. About 1,5 million individuals are exposed to an average daily level higher than 50 decibels (dBA) at their dwelling. A majority of these are plagued by this noise. The primary source is road traffic, according to more than 70 % of those surveyed. Other important sources are aeroplanes, railways and heavy industry, but also building activities, shooting ranges, speedways and areas for military training contribute. Furthermore, people are affected by noise from neighbours and such technical equipment as lawn mowers.
Noise represents a substantial threat for the health and well-being of inhabitants of cities and towns, particularly for people living along roads with heavy traffic. Night-time noise may disturb sleep, and about 200,000 Norwegians (5 %) are assumed to have sleep problems because of noise. The experience of being distracted during rest and recreation, or in a work situation, is affecting people's well-being and health. Noise also disrupts communication and learning.
Noise nuisance does not in itself lead to increased mortality, but it is a serious health problem for many people. Long-term annoyance may contribute to the development of diseases, especially for people otherwise susceptible. Stress of this kind may be a contributing factor in developing different health problems, for example muscle tensions and pain – common reasons for sick-leave and disability.

Figure 3.7 Noise nuisance distributed by source and the degree of nuisance distributed (1000 persons).
Source Norwegian Pollution Control Authority
3.6.2 Local air pollution
Clean air is important for both health and quality of life. Air pollution is a problem in large Norwegian cities, both during short periods of time with high levels of concentrations and through being exposed over longer periods of time. Both may give negative health effects, and a large share of the population is exposed to levels that increase the risk for health ailments and accelerated death, through bronchial infections, lung diseases and cancer.
National targets for air quality are established for particulate matter, nitrogen dioxide, sulphur dioxide and benzene. The targets are given as marginal values for air concentrations. Studies show that more than 80,000 individuals in Oslo are exposed to concentrations involving increased risk for health damage. The national targets for nitrogen dioxide, particulate matter and benzene are exceeded in several cities. The national target for sulphur dioxide is not exceeded in large cities, but there are some transgressions in some of the smaller cities with heavy industry.
The most important sources of air pollution in cities are emissions from road traffic, heating (particularly from burning wood), industry emissions and long-distance pollution from abroad. Airborne particulate dust and nitrogen dioxide are the pollution components creating health problems for large population groups. Particulate dust comes from wear and tear of road surfaces, as a result of studded tires, exhaust gases from cars, wood burning and long-distance air pollution. While emissions from cars have the most significant impact along roads with heavy traffic, wood burning may constitute a substantial source for particle pollution in other parts of cities. Nitrogen dioxide emissions are mostly caused by road traffic, but emissions from ships in ports also contribute. Benzene comes mainly from incomplete combustion of petrol, wood burning and other types of combustion, while sulphur dioxide mainly results from industrial activities.
The adoption of new environmental requirements for vehicles and fuels will reduce emissions of particulate matters, NO2 and benzene from road traffic. Measures to achieve similar reductions from other sources, for example to combat emissions from wood burning, are not yet agreed upon. Estimates show that the national targets will still be exceeded in large cities in 2010 if the current policy is not supported by additional measures.

Figure 3.8 Air pollution in Oslo and Trondheim, number of days when particulate matter, PM10, exceeds 50 g/m3 , limited to one measuring station per city.
Source Norwegian Pollution Control Authority, The Norwegian Public Road Authorities in Oslo, and the municipality of Trondheim
3.6.3 Greenhouse gas emissions and energy consumption
Greenhouse gas emissions may result in increased average global temperatures that may change precipitation patterns and wind systems, remove climatic zones and elevate the see-level. Such changes may seriously affect the natural eco-systems and the society. Norwegian commitments to the Kyoto protocol imply that our emissions of greenhouse gases during the period 2008-2012 should not be more than 1% higher than our emissions in 1990.
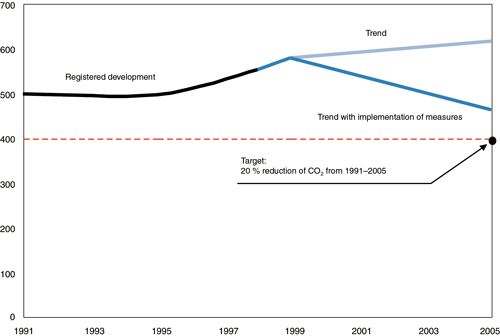
Figure 3.9 Greenhouse gas emissions in Bergen; Forecasted trends with and without implementation at a wide range of measures.
Source The municipality of Bergen
Several municipalities, counties or groups of municipalities have during recent years developed plans of action to clarify how individual cities may help reduce emissions. Norwegian Pollution Control Authority (SFT) has estimated that these plans in total may reduce the greenhouse gas emissions by 3,4 million tons of CO2-equivalents.
Some of the actual measures proposed by local authorities are strategic planning of and better provisions for waterborne heating, co-ordinated land-use and transportation planning, increased use of bio-energy, and more serious efforts to increase environmentally friendly transport.
Actions and measures to reduce greenhouse gas emissions from energy consumption and the transport sector are described more thoroughly in the Report No. 54 to the Storting (2000-2001) Norwegian climate policy and the ammendment Report No. 15 to the Storting (2001-2002).
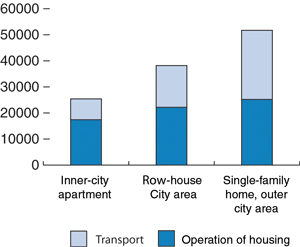
Figure 3.10 Energy consumption (kWh) for transportation and housing purposes per year depending on localisation and type of dwelling (based on housing units of 120 square meters).
Source Statistics Norway and Johan-Ditlef Martens
3.6.4 The green structure
Nature in and around cities and towns is crucial to give people a convenient opportunity to regularly use and enjoy environmentally friendly outdoor activities and recreation. Nature — with green areas, trails, footpaths and bicycle lanes — is valuable for people's health and well-being, and is of great importance for play, recreation, physical and social activities, and outdoor life all year round. Numerous studies indicate that contact with nature affects hormones and the immune system, and accelerates the healing processes of the sick.
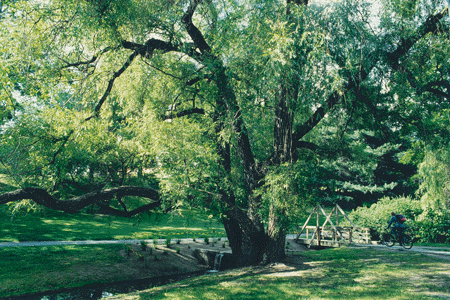
Figure 3.11 Green areas with thoroughfares for walking and biking are of great importance for leisure activities and physical activity, and contribute significantly to quality of life in cities.
Photo: Svein Magne Fredriksen
Nature is important to give form and identity to urban centres, and green areas are necessary to preserve urban wildlife and vegetation. Some of the areas with the richest biodiversity are actually found in and around the cities. Vegetation also has a positive impact on air quality, and it can reduce noise-levels.
The green structure consists of different kinds of natural and cultivated landscapes in and around the cities; playgrounds, parks, schoolyards, cemeteries, trails, sports fields, allotment gardens and private gardens. Creeks, rivers, lakes and coastal zones are also of great importance. The term green structure represents all these green and blue (water) areas and qualities.
Green structures under strain
The growth of cities and towns, in combination with dense development within the building zone, leads to increased demands on land in both central parts of the cities and in the more peripheral zones. This represents a threat to continuous networks and corridors of green areas, as well as centrally located and particularly valuable areas for play and recreation. During the last few decades, green structures in many cities and towns has deteriorated and become more fragmented. Individual areas have been reduced in size, and green corridors have been cut off. This has negative consequences for biological diversity, recreation and play, and reduces the ability to travel on foot or cycle. Part of the reason for the decline is that valuable green areas are not secured against development and change of use. A survey of four cities in 1996 showed that just 20-30 % of the natural areas from the 1950s were still intact.
Children are among the groups using outdoor areas the most, and especially outdoor access in their neighbourhood qualities are important for them. Several studies in urban areas show that children's radius of action is limited, and that most outdoor activities take place close to their homes. This applies, above all, for the youngest children. Most 5-6-year olds remain within 100 meters of their home, and until 8 years old, most children remain within 200 metres of their homes. Also, more than half of teenagers aged 13-16 years remain within 300 metres from their home when spending time in the neighbourhood. Diminishing outdoor areas and more barriers like trafficked roads particularly impact those having the least radius of action, like children and the elderly.
In many cities, people's opportunities for enjoying waterfront and riverside areas are reduced because of development, port and industry activities, and downsizing of green areas along rivers and creeks. Privatisation of beachfront properties further contributes to this situation.
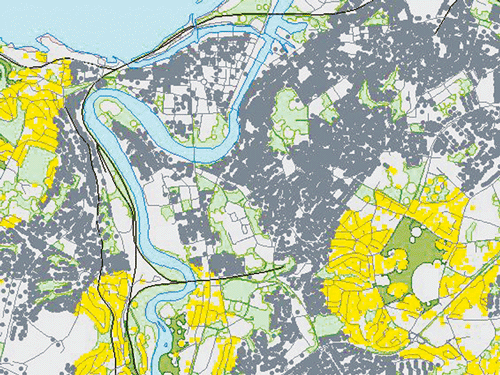
Figure 3.12 Map showing recreational areas for outdoor activities in Trondheim (>5 decare = light green, >200 decare = dark green).
Source Statistics Norway
Table 3.1 Kindergartens, schools and dwellings that have access to recreational areas within 200 metres, varying on the size of the city (1999), and expressed as a percentage.
City/town size | Kindergartens | Schools | Apartment blocks | Small homes |
200 – 499 | 93 | 91 | 82 | 88 |
500 – 999 | 94 | 91 | 81 | 86 |
1 000 – 1 999 | 93 | 94 | 76 | 85 |
2 000 – 19 999 | 85 | 84 | 69 | 79 |
20 000 – 99 999 | 83 | 80 | 63 | 73 |
> 100 000 | 78 | 77 | 65 | 68 |
Entire country | 89 | 87 | 70 | 85 |
Source Statistics Norway
Realisation of plans for green structures
In order to minimise further development of valuable green areas, municipalities should develop a well-functioning and continuous green structure. Green corridors should, to the greatest possible extent, connect residential areas, schools and kindergartens, as well as coastal zones and forested areas around. The green structure should consist of a rich biodiversity, and accommodate different needs and desires of the population. In the Report No. 39 to the Storting (2000-2001) «Outdoor life», the plan is that all municipalities with growing urban areas should have mapped and assessed their green structure within 2006.
Several cities are now planning to protect and further develop a continuous green structure as one of the main elements of their city-structure. A number of municipalities have invested great resources into mapping and systematising «green information», and developed strategies and plans for how to protect green structures through their land-use planning. For example, the city of Trondheim has recently developed a municipal plan for green structure, which resulted in protection of areas that were previously planned for development. This also affected a number of property owners.
Still, occasional development of valuable green areas happens in most cities. Sometimes, parts of the green areas are used for kindergartens, sporting fields and similar purposes. Over time, the number of small changes contributes to fragmentation of the green structures and decreased accessibility to green areas. Many green areas are also poorly managed. This means that valuable assets in those areas are cannot be properly utilised. Also, it means that a huge potential for improved neighbourhoods, with plenty of playgrounds and valuable areas for outdoor activities, is not being exploited.
3.6.5 Cultural heritage and milieus
Cultural heritages sites and milieus give a distinctive character, identity and add quality to our cities and towns. Denser development based on infill and transformation may result in the loss of valuable cultural heritage site and milieus. Studies in a number of growth municipalities around large cities show that about 1 % of the buildings from 1537-1900 are being torn down every year, and additional buildings are losing their cultural value because of rebuilding projects. The challenge is to protect and integrate valuable qualities both in local areas and cities as a whole. The construction industry often views cultural values as a barrier to efficient development, instead of seeing the potential of such elements in existing cultural and architect context.
Buildings represent about 70 % of the real assets of the nation, while existing agglomerations of buildings represent about 40 % of these values. Management of these resources is directly related to the environmental burden of our society. Active utilisation of cultural heritage sites and milieus leads to a more sustainable and resource-efficient economy, by contributing to recycling, decreased use of resources, and less pollution.
Archaeological sites are the only sources of knowledge and insight into society in earlier times. The country's 14 cities or city-like centres from the Middle Ages represent our most significant and interrelated archaeological values. They cover large areas, and the layers of cultural value might be up to 6 meters deep. Surveys from Oslo, Tønsberg, Bergen and Trondheim show that about a quarter of the cultural layers from the Middle Age are lost. Yet certain elements of the medieval cities are still visible today — in city-structure, real estate boundaries, and a few individual buildings.
Many cultural heritages and milieus are lost because of bad mapping, weak bases of poor assessing, poor databases, and a general lack of competency among key figures and decision-makers, both within municipalities and the property development industry. Municipalities also need to take stronger measures in order to manage their cultural heritage and milieus.
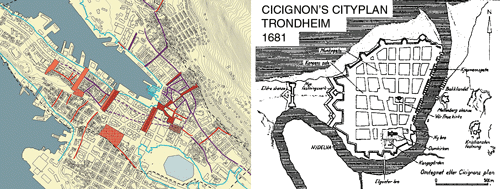
Figure 3.13 Historical Bergen: The map of cultural heritage shows main arteries, streets and urban spaces in the city from the 17th century that still give Bergen identity. To the right: The Cicignon plan for central parts of Trondheim from 1681. This grid-structure is still intact.
Source The municipalities of Bergen and Trondheim
3.6.6 Waste and deterioaration
City districts with low environmental quality are often characterised by an accumulation of social problems as well. Lack of environmental quality may contribute to increased segregation and make it less attractive for new businesses to establish, which in turn leads to a lack of jobs, shops and services in that local city-district or sub-centre. Different trends of development, both positive and negative, are often rooted in the physical environment and in how safe and attractive a specific area is perceived to be. Poor management and maintenance of buildings areas and public spaces signals low priority and creates a bad image. If, to the contrary, a local area is managed and maintained properly, inhabitants and investors are given signals of positive change. This increases opportunities to attract new businesses and services, making the area exciting and pulsating. Comprehensive and strategic efforts towards rehabilitation, maintenance and development of local assets and qualities is often what is needed to spark a positive trend, with the associated increase in activity, prosperity, social control and common identity.
3.7 Planning and development – roles and responsibility
Municipalities have the main responsibility for land-use planning and for developing and managing the physical environment of urban areas. But city and town development is a complicated process where a number of participants often have contradictory interests. The municipalities are dependent on close co-operation with the private sector, public and private developers, national authorities of various sectors, the counties and their neighbouring municipalities in order to create a comprehensive approach, co-ordinate efforts and balance out different interests.
Most challenges related to land-use and transportation planning in urban agglomerations stretch across several municipalities. The individual municipality's responsibility for land-use planning is therefore insufficient to solve shared regional issues. This often results in poor overall solutions because neighbouring municipalities adopt inconsistent development patterns and transportation choices.
The counties are responsible for regional planning and professional guidance of municipalities in regards to public transport, protection of cultural treasures, as well as other tasks important for city and town development. However, in reality the counties have had limited means to influence regional solutions, and county plans have only partially influenced the municipal land-use plans or the National Transport Plan.
The Government wants to emphasise the need for co-operation on planning issues that involve several municipalities and counties. The Government can point to promising experiences with regional co-operation on partial regional plans to encompassing limited issues or geographical areas. Still, the Government does not want to change the status of such plans to make them legally binding with regard to land-use, for example. This would have given counties a superior role over municipalities.
The Government also points out the proposal of inter-municipal planning Co-operation by the Committee on Improving the Planning and Building Act. This committee will evaluate various regulatory changes related to planning, including challenges across municipal borders, in parallel with other proposals. National authorities are responsible for investments and operations of infrastructure such as railways and national roads, and are also in control of large national concerns responsible for many jobs, including higher education, health services, defence systems and justice systems. Choices of localisation and prioritising of national infrastructure investments play a major role in the cities' development. National authorities’ role in city and town development is mainly to:
Establish national objectives and principles for environmentally friendly development of cities and towns.
Develop and co-ordinate national frameworks conditions: legalisation and guidelines, taxes and duties, subsidies and loan arrangements, organisation of the public sector, and, to some extent, services that national authorities subsidise, such as public transport.
Set an example and co-ordinate national activities in the municipalities, including respecting municipal and county plans which are based on national objectives and principles.
Initiate and support pilot projects in cities and towns; for instance, launch co-operative projects on planning and implementation schemes within specific areas that support environmental strategies.
Contribute to increase competency in the field of city and town development through networking and improved knowledge.
Improve the monitoring systems for capacity building in cities.
Participate in international co-operation for development of urban and environmental policy.