3
3.1 Fiscal policy
Norway has a strong economy and robust public finances compared to most other countries and is well placed to get through challenging times. A sustainable economic policy will nevertheless require difficult choices and prioritisations along the way, also for Norway. Norway is a small, open economy, which is influenced by global economic developments. This has been clearly illustrated by the increase in both international and domestic inflation. However, domestic economic developments are also influenced by Norwegian economic policy. Fiscal, monetary and labour policy, as well as the tripartite collaboration on wage development, influence developments in prices, wages, employment and the level of economic activity. There is a long tradition of the various policy areas pulling in the same direction.
Persistently high inflation is now the key stabilisation policy challenge. The responsibility for bringing down inflation is primarily on monetary policy. It is nevertheless important for fiscal policy and monetary policy to work in tandem; see Box 3.2. The Government’s policy aims to maintain the favourable fundamentals of the Norwegian economy, to keep unemployment low and employment high, while at the same time curbing inflation. If fiscal policy and wage formation fail to contribute to the necessary stabilisation, interest rates will have to be raised further and remain high for longer. A higher interest rate level will be challenging for many households and businesses.
3.1.1 Fiscal policy stance in 2024
Under the Government’s fiscal budget proposal for 2024, Fund spending, measured by the structural non-oil fiscal deficit, is projected to be NOK 409.8 billion at 2024 prices; see Table 3.1. Measured as a percentage of mainland Norway trend GDP, Fund spending has increased in recent years, and is projected to be 10.3 per cent in 2024; see Figure 3.1. This represents a change from the previous year, also known as the fiscal impulse, of 0.4 percentage points; see Figure 3.2. The fiscal impulse is a measure of the change in underlying Fund spending and is an indicator of fiscal policy changes. Under the budget proposal, Fund spending is projected to be 2.7 per cent; see Figure 3.3 and Table 3.4.
The Norwegian fiscal guideline stipulates that considerable weight should be accorded to the prevailing economic situation; see also the description of the fiscal policy framework in Box 3.1. Periods of high inflation and a tight labour market do not call for a fiscal policy stance that further stimulates the economy. As a continued high level of activity and pressure is anticipated in the Norwegian economy, although this is expected to level off somewhat, it would be prudent to restrain Fund spending.
The structural non-oil fiscal deficit measures underlying Fund spending, but the budget’s effect on the economy depends on overall spending via the budget and the composition of revenue and expenditure. For example, the budget’s effect on the economy depends on the automatic changes in taxes and unemployment benefits triggered by changes in the economic situation (“automatic stabilisers”). Such effects are not included in the structural deficit calculation.
The Norwegian Ministry of Finance uses the macroeconomic models KVARTS and NORA to analyse the budget’s impact on the economy. These provide calculations that take into account automatic stabilisers and budget changes for the entire public administration. These will also take into account that different budget items have different effects on the economy. The calculations indicate that the budget proposal for 2024 will, in itself, have a more or less neutral effect on the level of activity in the mainland economy next year. This is mainly due to the expenditure side of the budget growing, on the whole, roughly in line with trend growth in the economy. The revenue side is growing less than trend growth in the economy, but the calculations indicate that this does not have much of a stimulating effect on the economy; see Box 3.3 for further details. Many budget changes influence the economy with a time lag, and the model calculations indicate that the combined impact of the budgets for the years 2022–2024 on the activity in the Norwegian economy next year is moderately expansionary.

Figure 3.1 Structural non-oil fiscal deficit. Per cent of mainland Norway trend GDP
Source: Ministry of Finance.

Figure 3.2 Structural non-oil fiscal deficit, in per cent of mainland Norway trend GDP. Change from previous year (fiscal impulse)
Source: Ministry of Finance.
The budget proposal assumes a Fund value of NOK 15,300 billion at the beginning of 2024; see Figure 3.4. This estimate is based on the Fund value at the end of Q2 2023, extrapolated with the expected real return. The market value of the Fund has increased significantly recently, mainly as a result of increased equity values, but also because Norwegian kroner have depreciated. The projections in this white paper suggest that the Fund will increase by close to NOK 3,000 billion during 2023, which would in itself reduce Fund spending as a share of the Fund by 0.6 percentage points. In the event of the Fund value declining significantly in the near future, Fund spending may be higher than suggested by the long-term guideline.

Figure 3.3 Structural non-oil fiscal deficit. Per cent of the Government Pension Fund Global
Source: Ministry of Finance.

Figure 3.4 Market value of the Government Pension Fund Global.1 NOK billion
1 For 2023, the market value is shown as of the end of Q2. Nominal return is net of investment management costs.
Sources: Norges Bank Investment Management and Ministry of Finance.
The size of the Fund and its mounting importance in financing the welfare state mean that the fiscal policy is more vulnerable to permanent reductions in Fund value than before. Fund spending is estimated to cover more than 20 per cent of fiscal budget expenditure in 2024. This is significantly more than in the years before the Covid pandemic, and this share has doubled since 2012; see Figure 3.5.
In order to prevent Fund spending in itself from becoming a source of instability in the economy, major changes in Fund value should not immediately entail major changes in Fund spending. The fiscal guideline calls for Fund spending to instead be modified over several years to provide stability in terms of welfares service and the policy framework, rather than contributing to abrupt booms and busts in the economy; see Box 3.1. However, Fund spending may tend to increase more readily when Fund value increases, without a corresponding tendency for Fund spending to decrease in response to a decline in Fund value. In addition, there is a risk that major economic setbacks will require extraordinary fiscal policy measures, as during the pandemic. This will on average result in higher Fund spending, since it will not be matched by corresponding declines in spending during upturns. Furthermore, experience suggests that although many extraordinary measures will be phased out as the situation improves, some of the measures may be kept in place for longer. This may be either because it is not desirable to rapidly disapply such measures or because it is politically challenging to bring these to an end. All in all, these features of the political system, the economy and the fiscal policy arrangements will entail a risk of overspending. In order to comply with the fiscal guideline over time, Fund spending should therefore in normal times be well below 3 per cent. An analysis that seeks to quantify the impact of these factors is shown in Box 3.4.

Figure 3.5 Fund spending as a share of fiscal budget expenditure.1 Per cent
1 Non-oil expenditure.
Source: Ministry of Finance.

Figure 3.6 Combined surplus in the fiscal budget and the Government Pension Fund. Per cent of mainland Norway trend GDP
Source: Ministry of Finance.
Table 3.1 The structural non-oil fiscal balance1. NOK billion
2022 | 2023 | 2024 | ||
|---|---|---|---|---|
Non-oil fiscal deficit | 282.7 | 290.5 | 336.5 | |
+ | Net interest and transfers from Norges Bank. Deviation from trend | 0.2 | 11.8 | 26.1 |
+ | Special accounting considerations | -23.0 | -8.9 | -4.4 |
+ | Taxes and unemployment benefits.2 Deviation from trend | 78.7 | 78.9 | 51.7 |
= | Structural non-oil fiscal deficit | 338.6 | 372.3 | 409.8 |
Measured in per cent of mainland Norway trend GDP | 9.5 | 9.9 | 10.3 | |
Percentage point change from previous year (budget indicator)2, 3 | -1.1 | 0.4 | 0.4 | |
Memo: | ||||
Investment income in the Government Pension Fund. Estimated trend | 297.6 | 327.8 | 359.1 | |
Structural deficit, including investment income | 41.0 | 44.5 | 50.7 | |
Measured in per cent of mainland Norway trend GDP | 1.1 | 1.2 | 1.3 | |
1 See Appendix 1 for a more detailed description of how the structural non-oil fiscal deficit is calculated.
2 The adjustments are influenced by tax reform responses.
3 Positive numbers indicate that the budget has an expansionary effect. The indicator does not take into account that different revenue and expenditure items may differ in their effect on economic activity.
Source: Ministry of Finance.

Figure 3.7 Public expenditure.1 Per cent of mainland Norway trend GDP
1 The public administration is comprised of the central government administration, the regional government administration and the local government administration.
Sources: Ministry of Finance and Statistics Norway.

Figure 3.8 Real, underlying fiscal budget expenditure growth. Percentage change from previous year
Sources: Ministry of Finance and Statistics Norway.
The actual transfer from the Government Pension Fund Global to the fiscal budget; the non-oil fiscal deficit, is projected to be NOK 336.5 billion in 2024. See also the discussion of the non-oil fiscal deficit in Box 3.1.
The combined surplus in the fiscal budget and the Government Pension Fund is projected to be NOK 856.3 billion in 2024, which is equivalent to 21.6 per cent of mainland Norway trend GDP; see Figure 3.6 and Table 3.2. This amount reflects projected high revenues from petroleum activities. Net Fund transfers, i.e. net cash flow from petroleum activities less the transfers to the fiscal budget, are estimated at NOK 495.7 billion in 2024. In comparison, the average non-oil fiscal deficit exceeded central government’s net cash flow from petroleum activities over the period 2016–2021.
Table 3.2 Key figures in the fiscal budget and the Government Pension Fund. NOK billion
2022 | 2023 | 2024 | ||
|---|---|---|---|---|
Total revenues | 2,668.4 | 2,408.7 | 2,387.3 | |
1 | Revenues from petroleum activities | 1,313.6 | 930.1 | 858.2 |
1.1 Taxes | 720.9 | 605.6 | 491.6 | |
1.2 Other petroleum revenues | 592.7 | 324.5 | 366.6 | |
2 | Non-oil revenues | 1,354.8 | 1,478.5 | 1,520.1 |
2.1 Taxes from mainland Norway | 1,240.7 | 1,352.4 | 1,380.4 | |
2.2 Other revenues | 114.2 | 126.2 | 139.8 | |
Total expenditure | 1,665.9 | 1,796.0 | 1,882.6 | |
1 | Expenditure on petroleum activities | 28.4 | 27.0 | 26.0 |
2 | Non-oil expenditure | 1,637.6 | 1,769.0 | 1,856.6 |
Fiscal budget surplus before transfer to the Government Pension Fund Global | 1,002.5 | 612.7 | 495.7 | |
- | Net cash flow from petroleum activities | 1,285.2 | 903.1 | 832.2 |
= | Non-oil fiscal surplus | -282.7 | -290.5 | -336.5 |
+ | Transfer from the Government Pension Fund Global | 309.9 | 290.5 | 336.5 |
= | Fiscal surplus | 27.1 | 0.0 | 0.0 |
+ | Net provision for the Government Pension Fund Global | 975.3 | 612.7 | 495.7 |
+ | Interest and dividend income, etc., in the Government Pension Fund1 | 279.3 | 328.9 | 360.6 |
= | Combined surplus in the fiscal budget and the Government Pension Fund1 | 1,281.8 | 941.6 | 856.3 |
Memo: | ||||
Interest and dividend income, etc., in the Government Pension Fund Global | 267.4 | 312.7 | 344.0 | |
Market value of the Government Pension Fund Global2 | 12,355 | 12,413 | 15,300 | |
Market value of the Government Pension Fund2 | 12,688 | 12,732 | 15,637 | |
Retirement pension commitments under the National Insurance Scheme2,3 | 9,621 | 10,175 | 10,861 | |
1 Does not include foreign exchange gains or losses.
2 At the beginning of the year.
3 The present value of existing accrued rights to future retirement pension benefits under the National Insurance Scheme.
Sources: Ministry of Finance and Statistics Norway.
Public expenditure, i.e. combined expenditure in the central government administration, the regional government administration and the local government administration, exceeded 60 per cent of mainland Norway trend GDP for the first time in 2020; see Figure 3.7. Under the budget proposal in this white paper, this share is projected to be 61.9 per cent in 2024. Underlying fiscal budget expenditure growth measured in fixec prices is projected to be 0.7 per cent in 2024; see Figure 3.8 and Table 3.3.
Table 3.3 Underlying fiscal budget expenditure1. Projections in NOK billion and percentage change
2023 | 2024 | ||
|---|---|---|---|
Fiscal budget expenditure | 1,796.0 | 1,882.6 | |
- | Government petroleum activities | 27.0 | 26.0 |
- | Unemployment benefits | 10.8 | 12.9 |
- | Interest expenses | 11.4 | 13.6 |
= | Expenditure other than on petroleum activities, unemployment benefits and interest expenses | 1,746.8 | 1,830.1 |
- | Refugees in Norway financed through the development aid appropriation | 4.7 | 3.8 |
+ | Adjustment for pension premiums, etc., in health enterprises | -1.2 | 1.2 |
= | Underlying expenditure | 1,740.9 | 1,827.6 |
Value change in per cent. | 5.0 | ||
Price change in per cent. | 4.2 | ||
Volume change in per cent. | 0.7 | ||
1 The calculation of underlying expenditure growth excludes fiscal budget expenditure on government petroleum activities, interest expenses and unemployment benefits. In order to make expenditure comparable over time, adjustments have been made for extraordinary changes and certain accounting considerations in accordance with standard procedures.
Source: Ministry of Finance.
Table 3.4 Government Pension Fund Global, 3 per cent real return and structural non-oil fiscal deficit. NOK billion and per cent
Current prices | Fixed 2024 prices | Structural deficit | ||||||||
|---|---|---|---|---|---|---|---|---|---|---|
Government Pension Fund Global at the beginning of the year1 | 3 per cent of Fund capital | Structural non-oil fiscal deficit | 3 per cent of Fund capital | Structural non-oil fiscal deficit | Deviation from 3 per cent trajectory | Per cent of mainland Norway trend GDP | Per cent of Fund capital | |||
2001 | 386.6 | - | 16.7 | - | 37.6 | - | 1.4 | 4.3 | ||
2002 | 619.3 | - | 32.3 | - | 69.5 | - | 2.5 | 5.2 | ||
2003 | 604.6 | - | 36.0 | - | 74.6 | - | 2.7 | 6.0 | ||
2004 | 847.1 | - | 42.1 | - | 84.7 | - | 2.9 | 5.0 | ||
2005 | 1,011.5 | - | 44.3 | - | 86.4 | - | 2.9 | 4.4 | ||
2006 | 1,390.1 | - | 43.0 | - | 81.1 | - | 2.6 | 3.1 | ||
2007 | 1,782.8 | - | 42.5 | - | 76.5 | - | 2.5 | 2.4 | ||
2008 | 2,018.5 | - | 51.2 | - | 86.8 | - | 2.8 | 2.5 | ||
2009 | 2,279.6 | - | 90.4 | - | 147.6 | - | 4.6 | 4.0 | ||
2010 | 2,642.0 | - | 101.1 | - | 159.3 | - | 4.9 | 3.8 | ||
2011 | 3,080.9 | - | 88.2 | - | 134.2 | - | 4.1 | 2.9 | ||
2012 | 3,307.9 | - | 107.1 | - | 157.8 | - | 4.7 | 3.2 | ||
2013 | 3,824.5 | - | 121.1 | - | 172.6 | - | 5.1 | 3.2 | ||
2014 | 5,032.4 | - | 144.0 | - | 199.3 | - | 5.8 | 2.9 | ||
2015 | 6,430.6 | - | 167.9 | - | 227.0 | - | 6.5 | 2.6 | ||
2016 | 7,460.8 | - | 199.5 | - | 263.4 | - | 7.4 | 2.7 | ||
2017 | 7,509.9 | - | 213.0 | - | 275.4 | - | 7.6 | 2.8 | ||
2018 | 8,484.1 | 254.5 | 212.9 | 319.8 | 267.5 | -52.3 | 7.2 | 2.5 | ||
2019 | 8,243.4 | 247.3 | 241.1 | 301.7 | 294.1 | -7.5 | 7.8 | 2.9 | ||
2020 | 10,086.2 | 302.6 | 374.1 | 363.7 | 449.7 | 86.0 | 11.6 | 3.7 | ||
2021 | 10,907.1 | 327.2 | 358.0 | 377.4 | 412.9 | 35.5 | 10.5 | 3.3 | ||
2022 | 12,355.2 | 370.7 | 338.6 | 404.5 | 369.5 | -35.0 | 9.5 | 2.7 | ||
2023 | 12,413.5 | 372.4 | 372.3 | 388.0 | 387.9 | -0.1 | 9.9 | 3.0 | ||
2024 | 15,300.0 | 459.0 | 409.8 | 459.0 | 409.8 | -49.2 | 10.3 | 2.7 | ||
1 The estimate is based on the Fund value at the end of Q2 2023, projected with expected real return.
Source: Ministry of Finance.
3.1.2 Updated fiscal policy figures for 2023
Fund spending in 2023 is now projected to be NOK 372.3 billion, measured by the structural non-oil fiscal deficit. Fund spending projections have changed extensively since the budget adopted by the Storting in December 2022 (Balanced Budget 2023); see Table 3.5. In the Revised National Budget 2023 (RNB23), Fund spending increased, especially as a result of the consequences of the war in Ukraine, as well as higher wage and price growth than assumed last autumn. Structural deficit projections have not changed much since RNB23. The current projections for wage and price growth in 2023 are slightly lower than those that formed the basis for the wage and price adjustment in RNB23. This suggests that recipients of funds via the fiscal budget are likely to be overcompensated for cost growth in 2023.
Table 3.5 Key figures in the budget for 2023. Projections made at different times.1 NOK billion
Non-oil fiscal deficit | 256.9 | 45.7 | 302.6 | -12.1 | 290.5 | |
Structural non-oil fiscal deficit | 316.6 | 57.5 | 374.1 | -1.8 | 372.3 | |
Per cent of mainland Norway trend GDP | 8.8 | 1.2 | 10.0 | -0.1 | 9.9 | |
Per cent of Fund capital | 2.5 | 0.5 | 3.0 | 0.0 | 3.0 | |
Fiscal impulse (percentage points)2 | -0.6 | 1.0 | 0.5 | -0.1 | 0.4 | |
Real, underlying expenditure growth (per cent) | 1.7 | -0.1 | 1.6 | 0.7 | 2.3 | |
Combined surplus in the fiscal budget and the Government Pension Fund3 | 1,415.4 | -366.4 | 1 048.9 | -107.3 | 941.6 | |
1 Balanced Budget 2023 adopted in autumn 2022 (Balanced), adopted Revised National Budget 2023 following deliberation of RNB23 by the Storting in June 2023 (RNB23) and National Budget 2024 (NB24).
2 Change in structural non-oil fiscal deficit measured as a share of mainland Norway trend GDP. A positive number indicates that the budget has an expansionary effect. The indicator does not take into account that different revenue and expenditure items may differ in their effect on economic activity.
3 Including the Government Pension Fund Global and the Government Pension Fund Norway.
Source: Ministry of Finance.
The increased Fund spending in RNB23 also resulted in a fiscal impulse increase for the current year. The fiscal impulse is now projected to be 0.4 per cent in 2023, up from a projected -0.6 per cent in the Balanced Budget 2023.
Fund spending in 2023 is projected to be 3.0 per cent of the capital in the Government Pension Fund Global at the beginning of the year; the same as in RNB23. The non-oil fiscal deficit is projected to be NOK 290.5 billion.
The estimate for the central government’s net cash flow from petroleum activities in 2023 has been revised downwards since RNB23, to NOK 903.1 billion. This downward revision is primarily due to a lower gas price estimate. The combined surplus in the fiscal budget and the Government Pension Fund, which includes interest and dividend income from the Government Pension Fund Global and the Government Pension Fund Norway, as well as the cash flow from petroleum activities, has thereby also been revised downwards, and is now projected to be NOK 941.6 billion in 2023; somewhat less than in RNB23. This corresponds to almost 25 per cent of mainland Norway GDP.
3.1.3 Fiscal policy going forward
The Ministry of Finance presents analyses of fiscal policy sustainability in the white papers on long-term perspectives on the Norwegian economy, which are published about every four years. The most recent white paper was published in February 2021. The next white paper on long-term perspectives is scheduled to be published in spring 2024.
Previous calculations, including in the White paper on Long-term Perspectives on the Norwegian Economy 2021, have shown that fiscal budget revenues are expected to grow less over the period to 2030. The projections indicated both that petroleum revenues will gradually decrease and that growth in employment and productivity will be lower than in the previous decade. This will result in weaker tax revenue growth, while an increasing share of elderly people will mean increased expenditure on pensions, health and care. With Fund spending in line with the fiscal guideline, the calculations showed that the room for manoeuvre in the current decade will be reduced and will be in line with the growth in expenditure projected to result from increased demographically-driven costs in local government and health enterprises. Looking beyond 2030, the challenges posed by rising expenditure due to an ageing population will increase.
Political goals, as expressed in for example declarations of intent, white papers to the Storting and plural notes in the Storting, entail significant future budget commitments. Follow-up of the long-term plan for the defence sector is an example of a high-priority area with political commitments. In addition, unforeseen events may require major expenditure via the fiscal budget. The financial crisis (2009), the oil price slump (2014), the Covid pandemic (2020) and the war in Ukraine are salient examples.
The geopolitical situation, a more fragmented world, as well as climate policy and climate adaptation, will require increased expenditure or changed priorities in the years to come. In addition, these trends may affect international conditions and lead to higher prices on goods imported by Norway.
The sustainability of public finances also depends on developments in the Fund value and cash flow from the petroleum activity. In recent years, the Fund value has developed more favourably than previously assumed, which will influence new calculations of funding needs. The future Fund value is subject to considerable uncertainty, both due to much uncertainty about international financial market developments and due to significant uncertainty about central government’s future cash flow from the petroleum activity.
3.1.4 The fiscal set-up for the local and regional government sector – not translated
3.1.5 Developments in public finances
The public administration surplus is measured in the national accounts by net lending. For Norway, public administration net lending1 is projected to be about NOK 889 billion in 2024. This corresponds to 16.8 per cent of GDP; see Table 3.9. For 2023, public administration net lending is projected to be about NOK 727 billion, corresponding to 14.6 per cent of GDP.
Developments in the Norwegian public administration surplus are heavily affected by revenues from petroleum activities, as well as by interest and dividend income in the Government Pension Fund. Excluding these revenues, central government has in recent years been recording a deficit. In accordance with the Government Pension Fund Act, this deficit is covered by a transfer from the Government Pension Fund Global to the fiscal budget. Local and regional government have also had negative net lending for a long time, thus implying that the net debt of the local and regional government sector has increased.
Table 3.9 Public administration net lending.1 NOK billion and per cent of GDP
2022 | 2023 | 2024 | |||
|---|---|---|---|---|---|
A. | Central government net lending, accrued value | 1,507.5 | 759.8 | 930.0 | |
Combined surplus in the fiscal budget and the Government Pension Fund | 1,281.8 | 941.6 | 856.3 | ||
Non-oil fiscal deficit | -282.7 | -290.5 | -336.5 | ||
Net cash flow from petroleum activities | 1,285.2 | 903.1 | 832.2 | ||
Interest and dividend income, etc., in the Government Pension Fund | 279.3 | 328.9 | 360.6 | ||
Surplus in other government and social security accounts | -8.1 | -13.2 | -9.4 | ||
Differences in definitions between central government accounts and national accounts2 | 233.8 | -168.6 | 83.1 | ||
B. | Local and regional government net lending, accrued value | -47.5 | -32.4 | -40.7 | |
Local and regional government deficit, book value | -19.6 | -39.5 | -41.6 | ||
C. | Public administration net lending (A+B) | 1,460.0 | 727.4 | 889.3 | |
Measured as a share of GDP | 26.2 | 14.6 | 16.8 | ||
1 Includes central government’s accrued, but not booked, taxes, in relation to, inter alia, petroleum activities. Adjustment has also been made to reflect that capital contributions in commercial operations, including government petroleum activities, are recorded as lending in the national accounts.
2 The table is based on the definitions in the national accounts, which use accrued amounts. This entails, inter alia, a large difference between 2022 and 2023 due to accrued corporate taxes, including petroleum taxes, being significantly higher than booked amounts in 2022, which must be seen in relation with the high gas and electricity prices. This is reversed in 2023. Accrued petroleum taxes and corporate taxes from mainland Norway GDP are again projected to be higher than booked amounts in 2024.
Sources: Statistics Norway and Ministry of Finance.
A frequently used indicator of fiscal balance in European countries is net lending as a percentage of GDP. On average, the OECD and eurozone countries have recorded public sector deficits; see Figure 3.15. OECD projections suggest that member countries will collectively record public sector deficits equivalent to 3.1 per cent of GDP in 2024.
Norway’s tax level is higher than the OECD average, but roughly in line with that of Sweden and Denmark, measured as a share of GDP; see Figure 3.16. The tax revenue share will vary somewhat depending on factors such as the extent to which pensions are a public sector responsibility and whether public pension and benefit payments are subject to taxation.

Figure 3.15 Public administration net lending. Per cent of GDP
Sources: Ministry of Finance and OECD.

Figure 3.16 Public tax revenues. Per cent of GDP
Sources: Norwegian Ministry of Finance, Swedish Ministry of Finance, Danish Ministry of Finance and OECD.
The level of public expenditure as a share of GDP is high in Norway, compared with Sweden, Denmark and the OECD and eurozone average. Like in other countries, Norwegian public expenditure as a share of GDP increased during the Covid pandemic. In 2024, the expenditure share is projected to be 61.7 per cent of Mainland Norway GDP; about the same level as in 2023, but higher than in the pre-pandemic years; see Figure 3.17. Higher expenditure will increase this share, while higher mainland GDP will, in itself, reduce such share.
Public expenditure is comprised of consumption expenditure, transfers and gross fixed capital formation. Consumption expenditure in Norway has been higher as a share of GDP than in other European countries in recent years; see Figure 3.18, and is developing in line with public expenditure developments.

Figure 3.17 Public expenditure. Per cent of GDP
Sources: Ministry of Finance and OECD.

Figure 3.18 Consumption expenditure. Per cent of GDP
Source: Ministry of Finance and OECD.
Public administration gross fixed capital formation, i.e. public expenditure on the construction of roads, railways and public buildings, has also increased. The level of public sector gross fixed capital formation has for many years been higher in Norway than in many other OECD countries. Figure 3.19 compares public administration gross fixed capital formation as a share of Mainland Norway GDP with the corresponding shares in Sweden and Denmark.

Figure 3.19 Public administration gross fixed capital formation. Per cent of GDP
Sources: Ministry of Finance and OECD.

Figure 3.20 Public administration net financial assets. Per cent of GDP
Sources: Ministry of Finance and OECD.
Developments in public sector net financial assets depend both on the current surplus or deficit and on changes in the market value of the portfolio of outstanding receivables and liabilities, such as shares and bonds. Including the capital in the Government Pension Fund and capital contributions in government commercial operations, public administration net financial assets are projected to be about NOK 18,430 billion at the end of 2024, or 348.1 per cent of GDP; see Figure 3.20. This is predominantly in the form of capital in the Government Pension Fund.
Very few OECD countries have positive public administration net financial assets. For the OECD countries as a whole, the public administration is projected to have negative net financial assets, i.e. net debt, equivalent to 67 per cent of GDP in 2024. Such net debt rose sharply in 2020 and 2021 as a result of large public sector deficits during the pandemic.
Textbox 3.1 The fiscal policy framework
Like most other countries, Norway has a fiscal policy framework with fiscal balance requirements. In addition, the Norwegian framework is customised for the special Norwegian context of substantial, temporary petroleum revenues and substantial Fund income.
A key purpose of the fiscal policy framework is to convert a temporary revenue stream from the extraction of petroleum resources into a lasting revenue source. This is achieved by allocating the revenues from petroleum activities to the Government Pension Fund Global (GPFG) and, over time, spending only the expected real return on the Fund via the fiscal budget.
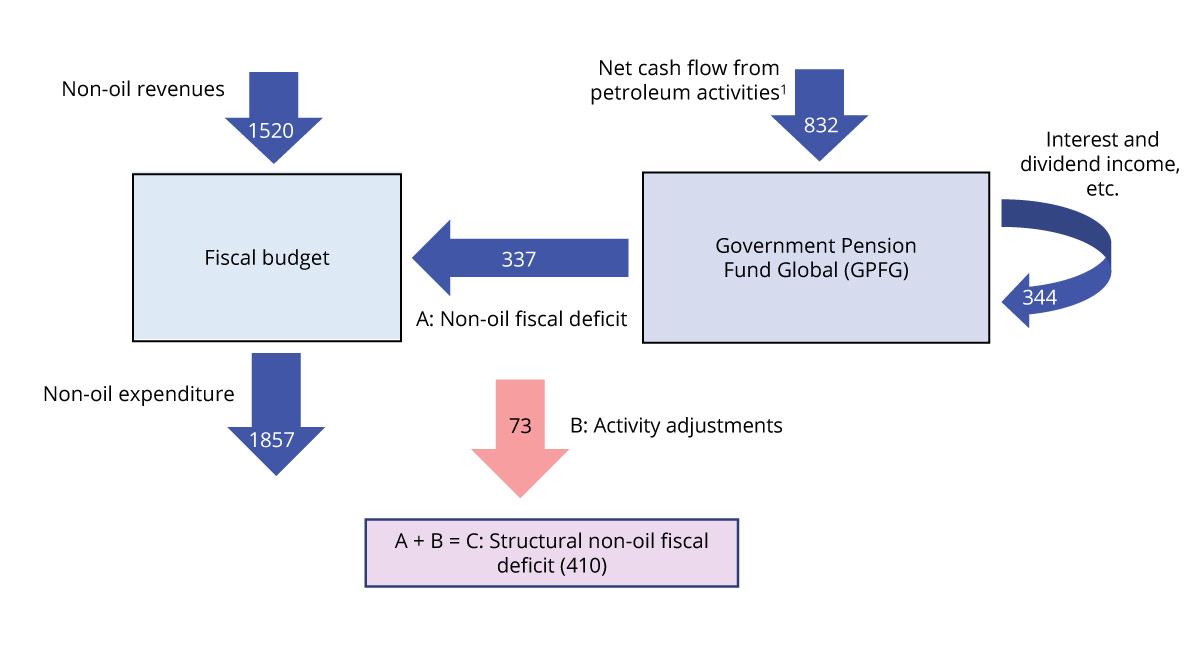
Figure 3.21 Cash flows between the fiscal budget and the GPFG. Figures from the National Budget for 2024. NOK billion
1 Government revenues from petroleum activities are recognised in the fiscal budget before the net cash flow from petroleum activities is transferred to the GPFG, but this is simplified in the chart.
Source: Ministry of Finance.
How the petroleum wealth is saved in the GPFG and phased into the economy is regulated in the Government Pension Fund Act. The Act ensures that central government’s net cash flow from petroleum activities is in its entirety transferred from the fiscal budget to the GPFG, and that the Fund capital can only be transferred to the fiscal budget pursuant to a resolution of the Storting. Interest and dividend income from the investment management is recognised as income directly in the Fund. The transfer from the Fund corresponds to the non-oil fiscal deficit, which is authorised by the Storting during its deliberation of the fiscal budget; see Figure 3.21.
The fiscal guideline
The fiscal guideline has guided Fund spending since 2001:
Fund spending shall over time be in line with the expected real return on the Government Pension Fund Global.
A strong emphasis shall be put on smoothing out economic fluctuations to ensure sound capacity utilisation and low unemployment.
Considerations and trade-offs when applying the fiscal guideline
The fiscal guideline calls for the Fund capital to be spent in a manner that provides a fair distribution between generations and that facilitates stable development in the Norwegian economy. These considerations need to be weighed against one other when assessing Fund spending.
On the one hand, Fund spending today needs to be weighed against the consideration that this wealth should also be available for spending in the future. Although this is often referred to as a matter of intergenerational distribution of the Fund capital, it also includes the consideration that current generations should have wealth available for future spending. The fiscal guideline facilitates preservation of the real value of the Fund. Spending that preserves the real value of the Fund will balance Fund spending today and in the future. A well-balanced distribution of the capital between generations also contributes to long-term economic stability.
On the other hand, consideration for a stable economic development from one year to the next suggests that significant weight should be accorded to the prevailing economic situation in the assessment of Fund spending. It is also important to ensure that the Fund spending does not in itself become a source of instability in the economy. The latter consideration means that especially large changes in the value of the Fund should not immediately result in major changes in Fund spending, and that changes in Fund spending should instead be modified over several years to avoid creating unstable conditions and contributing to abrupt booms and busts in the economy.
The fiscal guideline links Fund spending over time to the expected real return on the Fund, which is currently projected to be 3 per cent. To achieve this, it has in recent years been noted in the national budgets that Fund spending should in normal years, which will be most years, be well below 3 per cent. This is related to the need for an extra savings buffer that can be dipped into in the event of major economic setbacks or large Fund value reductions, and we can thereby avoid difficult policy changes involving major cuts in budget expenditure or significant tax increases; see Box 3.4 for further discussion.
Application of the guideline has become more challenging as the Fund has become more important to the fiscal budget and the economy. In addition, it can in coming years no longer be expected that a Fund value decline will be offset by Fund inflows from petroleum activities.
The fiscal guideline is flexible. A considerable degree of discretionary assessment is required in the application of the fiscal guideline in order to strike the right balance between the relevant considerations and to ensure that the guideline works as intended.
The structural non-oil fiscal deficit and automatic stabilisers
Fund spending is usually measured by the structural non-oil fiscal deficit, which is the non-oil fiscal deficit adjusted for cyclical fluctuations and other random fluctuations in individual revenue and expenditure items; so-called activity adjustment. See Appendix 1 for a more detailed description.
In a boom, it is normal for tax revenues to be high and unemployment benefit expenditure to be low, while the opposite is true in a recession. The structural fiscal deficit is adjusted for such cyclical factors. By linking Fund spending to the structural deficit, fiscal policy automatically has an expansionary effect during recessions and a contractionary effect during booms. Fiscal policy thereby contributes to stabilising economic development. Such fiscal policy effects are called automatic stabilisers and can be significant in the event of major cyclical fluctuations.
Fund spending forms part of an integrated budgetary process
The Government Pension Fund Act stipulates that Fund capital can only be transferred to the fiscal budget pursuant to a resolution of the Storting. This ensures Fund spending transparency by including and identifying such spending in the fiscal budget and the fiscal accounts. This means that the Fund capital forms part of an integrated budgetary process and is not earmarked for special purposes. This prevents the Fund from becoming an alternative source of funding for expenditure that is not prioritised in the ordinary budgetary process. The Government Pension Fund Act also stipulates that any fiscal deficit shall be covered by transfers from the Fund, rather than by borrowing, provided that the Fund capital has not already been exhausted.
Textbox 3.2 Fiscal and monetary policy should work in tandem
Major fluctuations in economic activity and employment will normally impose major costs on households and complicate planning. Consequently, economic policy aims to smooth out economic fluctuations and avert major booms and busts.
In the overall stabilisation policy, responsibility for monetary policy has been delegated to Norges Bank, while the Storting makes fiscal policy decisions based on proposals from the Government. Through a well-functioning labour market and responsible wage settlements, the Norwegian model for wage formation can contribute to permanently low unemployment and high employment compared with other countries.
A key stabilisation policy focus is to maintain stable and high employment, in order to make sure that people have jobs. A prerequisite for achieving this over time is low and stable inflation.
Monetary policy is best suited for, and is given the task of, controlling inflation. By changing the policy rate, Norges Bank can influence the Norwegian kroner exchange rate and overall demand for goods and services. All else being equal, a higher interest rate will make it more attractive to buy Norwegian kroner, thereby causing Norwegian kroner to appreciate. It will also cause investment plans to be postponed or scaled back, and will reduce the disposable income and consumption of households. Over time, this will reduce inflation. As a general rule, changing the interest rate level is an effective measure, since interest rate changes can be decided at short notice, can have a broad impact and can in many cases have a relatively rapid effect on the economy.
Fiscal policy also works by influencing the demand for goods and services, but is directed to a broader set of objectives and has a more finely meshed set of policy tools. The fiscal guideline is a long-term fiscal policy guideline, but also calls for a strong emphasis to be placed on smoothing out economic fluctuations; see Box 3.1.
There are nevertheless several reasons why it can be challenging to use fiscal policy very actively in stabilisation policy:
Implementation time: It often takes a long time from a fiscal policy measure is analysed and decided until it has any discernible effect on the economy. One example would be government investment projects. However, there are exceptions, such as modification of cash transfers under existing schemes.
Consideration for stability and predictability in welfare services and the policy framework: Large parts of the fiscal budget is comprised of expenditure that is necessary for a sound and well-functioning welfare system. It is not desirable to vary service provision as a part of stabilisation policy. Besides, many economic decisions depend on the general policy framework, including the tax system. Planning is easier when this framework is predictable. Under normal circumstances, policy framework changes will rarely be an appropriate stabilisation policy component.
Asymmetry in fiscal policy: It is generally more politically expedient to implement tax cuts than tax increases and, correspondingly, more expedient to implement expenditure increases than expenditure cuts. Active use of fiscal policy for stabilisation policy purposes would require any expenditure increase that boosts demand for goods and services to be swiftly reversed when the economy rebounds. This can be difficult in practice, and there is a risk that the fiscal deficit will grow over time if fiscal policy is given a key role in stabilisation policy.
These limitations mean that it will in periods of moderate cyclical fluctuations be appropriate for monetary policy to take centre stage in stabilisation policy. The most important contribution from fiscal policy will in such case be through the automatic stabilisers, i.e. the inherent budget features that serve to smooth out economic fluctuations. These include, in particular, the tax system and unemployment benefits.
In the event of major cyclical fluctuations it may nevertheless be necessary for fiscal policy to support monetary policy with active measures. In deep recessions, the policy rate may reach its effective lower bound close to zero, thereby preventing monetary policy from being sufficiently expansionary. Moreover, it may be necessary to use active fiscal policy to stimulate activity when there is a risk of prolonged recession, both to prevent unemployment from becoming entrenched at a high level and because long periods of very low interest rates may have unfavourable effects on risk-taking and financial stability. In addition, fiscal policy can work rapidly and effectively when there is a need for boosting household incomes, as during the pandemic. Fiscal policy should in such situations seek to stimulate the economy beyond the contribution from the automatic stabilisers. Fiscal and monetary policy should work in tandem in such scenarios.
Fiscal policy and monetary policy should also work in tandem during booms or periods of very high inflation, such as now. This is also recommended by both the International Monetary Fund (IMF) and the OECD.1 Large interest rate increases can be very challenging to handle for those with high debt, and distributional and financial stability considerations may limit what level of interest rate increases is desirable. To limit the need for sharp interest rate hikes, fiscal policy should in such situations not add to the need for interest rate increases by boosting economic activity. The Government has emphasised this consideration in its budgets for both this year and next year. Fiscal policy must nevertheless mitigate the burden of high inflation for particularly vulnerable groups. Moreover, it is important to maintain stable and predictable public welfare services, and it is not desirable to cut these as part of stabilisation policy.
1 See IMF Fiscal Monitor, April 2023, and OECD Economic Outlook, June 2023. The IMF states, inter alia, that “Fiscal policy can and should support monetary policy in bringing inflation back to target in a timely manner”.
Textbox 3.3 Activity effects of fiscal policy in 2022–2025
When assessing how a budget programme influences economic activity, it needs to be taken into account that different revenue and expenditure items differ in their effect on activity. The Ministry of Finance uses the macroeconomic models KVARTS and NORA for this purpose.1
The model calculations show that the Government’s budget proposal for 2024 has a more or less neutral effect on the level of economic activity in the fiscal year; see Tables 3.10 and 3.11. The revenue side of the budget is increasing by less than trend growth in the economy, due to lower revenues from the hydro power sector, amongst other things. This serves to increase the structural non-oil fiscal deficit as a share of mainland Norway trend GDP, but does not have much of a stimulating effect on the economy. The expenditure side is in aggregate growing somewhat slower than trend growth in the economy, which has a slight contractionary impact on the economy. All in all, the measured activity effect of the budget proposal for next year is therefore close to neutral. This contrasts with the fiscal impulse, i.e. the change in the structural non-oil fiscal deficit as a share of trend growth in the economy, which is positive. The fiscal impulse is a simple way of putting the change in Fund spending into perspective, as a share of mainland Norway GDP, but it primarily measures how the structural balance of the fiscal budget develops when we adjust for activity effects and other temporary factors. The budget effect calculations take into account the effects of so-called automatic stabilisers in the budget, i.e. that unemployment benefit expenditure increases and tax revenues fall in a recession, while the reverse happens during a boom. In addition, revenue and expenditure items (accrued) are analysed for the entire public administration.
Table 3.10 Budget effects on mainland GDP according to KVARTS. Per cent
Effects on mainland GDP1 | ||||
|---|---|---|---|---|
2022 | 2023 | 2024 | 2025 | |
Budget proposal for 2022 | 0.5 | 0.3 | 0.3 | 0.2 |
Budget proposal for 2023 | 0.3 | 0.4 | 0.5 | |
Budget proposal for 2024 | 0.0 | 0.0 | ||
2022–2024 in total2 | 0.5 | 0.6 | 0.6 | 0.7 |
Table 3.11 Budget effects on mainland GDP according to NORA. Per cent
Effects on mainland GDP1 | ||||
|---|---|---|---|---|
2022 | 2023 | 2024 | 2025 | |
Budget proposal for 2022 | 0.3 | 0.1 | 0.1 | 0.0 |
Budget proposal for 2023 | 0.3 | 0.2 | 0.2 | |
Budget proposal for 2024 | 0.1 | 0.1 | ||
2022–2024 in total2 | 0.3 | 0.4 | 0.4 | 0.3 |
1 The effect on economic activity is based on how various revenue and expenditure items (accrued) for the public administration as a whole develop compared with trend growth in the economy. The deviation from the baseline scenario is combined with fiscal multipliers. The multipliers are based on the models and describe the extent to which changes in various expenditure and revenue items influence economic activity. The effects of the so-called automatic stabilisers in the budget are taken into account, i.e. that unemployment benefit expenditure increases and tax revenues decline during a recession, while the reverse happens during a boom.
2 Due to rounding, the sum of the individual elements above may differ from the total presented in this row.
Source: Ministry of Finance.
The effects of fiscal policy in a single year will be subject to a time lag, and will therefore also be carried into subsequent years. The model calculations show that fiscal policy for 2022 and 2023 will also contribute to increasing the level of activity in 2024. Overall, fiscal policy for the years 2022–2024 serves to increase the level of activity next year by 0.4–0.6 per cent.
Just as fiscal policy in previous years has effects on the economy next year, the Government’s budget proposal for 2024 will also have effects on economic activity in the years following the fiscal year. For 2025, the budget proposal for 2024 is also projected to have a more or less neutral effect on the level of activity. This is based on the technical assumption that public revenues and expenditure will grow in line with trend GDP in 2025. If the expansionary effects of fiscal policy in the two previous years (2022 and 2023) are included, the model calculations indicate that the fiscal policy contribution over the period 2022–2024 will, in itself, serve to increase mainland GDP in 2025 by 0.3–0.7 per cent.
1 KVARTS is a macroeconometric model estimated on Norwegian data (mainly time series from quarterly national accounts statistics); see, inter alia, Appendix C in Bjertnæs, G., Brasch T. von, Cappelen, Å., Holmøy, E., Slettebø, O., Sletten, P. and Zhulanova, J. (2021) Covid 19, tapt verdiskaping og finanspolitikkens rolle, Statistics Norway, Reports 2021/13, for an overview of model properties and fiscal multipliers. NORA is a dynamic stochastic general equilibrium model which is calibrated, but not estimated, on Norwegian data, with a particular focus on analysing effects of fiscal policy, cf. NORA – A Microfounded Model for Fiscal Policy Analysis in Norway, available on the Government’s website. There is generally more inertia in KVARTS than in NORA, thus implying that the effects of fiscal policy changes are more prone to increase or persist in KVARTS than in NORA. Both models are maintained and developed by Statistics Norway.
Textbox 3.4 Asymmetric considerations in the application of the fiscal guideline
The fiscal guideline calls for Fund spending over time to be in line with the expected real return on the Government Pension Fund Global (GPFG); see Box 3.1, The fiscal policy framework.
The value of the Fund is now almost four times the annual value of production in the mainland economy. The size of the Fund and its mounting importance in financing the welfare state mean that fiscal policy is more vulnerable to long-lasting reductions in the value of the Fund than previously. It has in the national budgets in recent years been noted that in order to comply with the fiscal guideline over time, and at the same time avoid difficult policy changes involving major cuts in budget expenditure or significant tax increases following large reductions in the value of the Fund, Fund spending should in normal times be well below 3 per cent.
A similar need arises as a result of the economy periodically undergoing major and sudden downturns. These may take the form of a financial crisis, a substantial oil price slump, a pandemic, or a war or crisis in our neighbouring region that triggers a major slump. These episodes are not normally matched by correspondingly large and sudden booms. When such sharp downturns occur, it is often desirable to pursue an expansionary fiscal policy to cushion the impact on economic activity and employment. This entails a weakening of the fiscal balance that cannot be expected to be matched by any automatic strengthening when the crisis is over. Moreover, it may take time to phase out crisis expenditure, as it may not be desirable to swiftly reverse measures that have been introduced, as this may involve abrupt public sector downsizing or terminating projects prior to their completion.
Crises are asymmetric in nature. Similarly, the cost of major budget modifications is asymmetric; it is more politically challenging to implement large expenditure cuts or tax increases than to implement correspondingly large expenditure increases or tax cuts.
This box presents a simple model analysis that quantifies what level of Fund spending in normal times that will ensure compliance with the fiscal guideline over time, despite the economy being faced with such asymmetries. This “asymmetry buffer” will depend on how often crises occur, how much Fund spending is increased in times of crisis and, how challenging it is to cut expenditure or increase taxes after a period of high Fund spending. The analysis finds that Fund spending should be around 2.7 per cent in normal times, when taking into account that it is more challenging to reduce high Fund spending in the aftermath of crises or Fund value reductions than it is to increase Fund spending. The magnitude of the buffer depends on the ability and willingness to modify fiscal policy. The faster one is able to phase out temporarily large fiscal deficits, the closer Fund spending can be to the expected real return in normal times.
A model for Fund spending over time
The analysis is conducted by way of a macrofinancial model developed by the Ministry of Finance.1 This is an empirically based model that simulates developments in, inter alia, oil and gas prices, the international stock market and the economic situation in Norway. In addition to these relationships, Fund spending needs to be specified.2 To keep the model simple, specific public expenditure and tax decisions are disregarded. Instead, actual Fund spending, i.e. the non-oil fiscal deficit, is modelled directly. It is useful to break down the Fund spending in the following way:

Structural spending is comprised of underlying spending from the Fund, which is driven by the market value of the Fund, and discretionary countercyclical fiscal policy, which is driven by unemployment and crises. It is assumed that underlying spending adapts to changes in the value of the Fund over time, although it is easier to increase spending than it is to reduce it. The countercyclical spending will be asymmetric in nature, as major crises are not matched by correspondingly booms. However, this spending can also be assumed to be even more asymmetric, in that spending is swiftly increased during a recession or crisis, while it takes a fair bit of time to reduce spending when the economic situation improves.
Automatic stabilisers describe the fiscal balance effects of how tax revenue and unemployment benefits expenditure vary with the level of economic activity. This is captured in the model by letting the deficit vary with unemployment and crises. The automatic stabilisers will also be asymmetric in nature, as major crises are not matched by corresponding booms. It is assumed that expenditure increases due to the automatic stabilisers will be immediately reversed when the situation improves.
Underlying spending is gradually moving around a level of Fund spending corresponding to 


In order to quantify the parameters that determine Fund spending in this model, we have looked at developments in Fund value and Fund spending in Norway over the period from 2004 to 2024. Several of the parameters can be quantified on the basis of these data, but it is difficult to obtain precise estimates with so few observations. It is also challenging to quantify how slowly spending will adapt to a Fund value decline or how quickly it will be reversed after a crisis. During both the financial crisis and the pandemic, the post-crisis Fund value was significantly higher than the pre-crisis Fund value, thus implying that spending did not necessarily have to be reversed to pre-crisis levels. In the calculations, we will therefore base the results on different sets of assumptions to highlight the importance of various channels.
Model simulations
Using simulations on this model, it can be estimated what spending percentage in normal times, 


Figure 3.22 Asymmetry buffer. Percentage points.
Source: Ministry of Finance.
The simulations show how the asymmetry buffer is based on three considerations:
Crises are inherently asymmetric. In the model, crises occur about once a decade. It is assumed that the countercyclical policy during crises is equivalent to 4 per cent of GDP. This entails a need for an asymmetry buffer, even if we assume that Fund spending otherwise varies symmetrically around the normal spending percentage. Rare, but regular, crises increase the average spending percentage. In itself, this consideration suggests that an asymmetry buffer of around 0.1 percentage points should be assumed in normal times; see the first bar in Figure 3.22.3
Asymmetric adjustment to changes in Fund value. It is more difficult to reduce underlying spending than it is to increase it. This constitutes another source of asymmetry. If we add this to the effect of potential crises, the asymmetry buffer increases to around 0.2 percentage points; see the second bar in Figure 3.22.
Slow phaseout of countercyclical policies. It takes longer to reverse temporarily large deficits caused by crises or other cyclical fluctuations than it takes to increase deficits when a crisis occurs. This extends the policy asymmetry from the previous paragraph to include both deficits resulting from underlying spending and discretionary countercyclical policy. This consideration serves to further increase the asymmetry buffer, to 0.3 percentage points.
The effects of crisis expenditure and slow adjustment reinforce each other. The explanation is simple: Slow adjustment means less when large deficits are a rare occurrence. And crisis expenditure means less when it can be reversed quickly. If high crisis expenditure is combined with slow reversal, the impact on the asymmetry buffer may be significant.
Significance for application of the fiscal guideline
The fiscal guideline calls for Fund spending over time to be in line with the expected real return. However, asymmetric features of the economy and of fiscal policy suggest that it is in normal times necessary to aim for a level of Fund spending that entails an “asymmetry buffer” to compensate for excess expenditure that occurs during periods of large deficits. The simulations show that Fund spending should in normal times be 0.3 percentage points less than the expected real return when taking into consideration that it is difficult to quickly reduce Fund spending again after it has increased sharply. This entails aiming for a spending percentage of 2.7 per cent during normal times. The estimate depends on how the model is quantified, and other assumptions could have resulted in both a larger and a smaller buffer.
The size of the buffer depends on the ability and willingness to adjust fiscal policy. The more swiftly temporarily large fiscal deficits can be phased out, the closer to the expected real return Fund spending can be in normal times. However, it is not always a goal to reverse expenditure quickly – there may be sound reasons for avoiding, for example, abrupt public sector downsizing or the cancellation of uncompleted projects. Aiming for a spending percentage that includes an asymmetry buffer facilitates such considerations.
1 The analysis will be documented in a forthcoming Ministry of Finance working paper. The macrofinancial model is based on an estimated VAR model, which includes numerous foreign macroeconomic and financial variables, as well as the Norwegian business cycle modelled through unemployment. To shed light on spending percentage developments, the VAR model is extended with Fund spending development assumptions.
2 The specific assumptions on Fund spending developments are as follows: Underlying spending is determined by an asymmetric variant of the well-known Tobin rule, which attaches some weight to expected real return, but also attaches weight to previous levels of underlying spending. The asymmetry arises because more weight is attached to past spending when spending is declining than when it is increasing. Discretionary spending depends on the economic situation, as measured by unemployment, and on whether crises occur. Asymmetric adjustment is modelled by assuming that countercyclical policies are fased out more slowly after crises or economic downturns than in booms. Automatic stabilisers only depend on the current economic situation.
3 It may be noted that we would have an asymmetry buffer even without the crisis expenditure, as a result of the automatic stabilisers and the symmetric inertia in structural spending. However, these effects are very small and the implied buffer is close to zero.
Textbox 3.5 Effects of a weaker Norwegian krone exchange rate on the Norwegian economy
Over the past year, Norwegian kroner have depreciated markedly against the currencies of our trading partners. We use the macroeconomic model NORA to analyse the various effects of Norwegian kroner depreciation on the Norwegian economy. The model shows that Norwegian kroner depreciation can provide a significant export stimulus, while lowering investments and private consumption. The sum total of these effects in the model is that there is little impact on the overall level of activity, but that depends on how monetary policy responds. Norwegian kroner depreciation also increases inflation and, through increased profitability in the sector exposed to international competition, wage growth. Public finances improve in the short term when Norwegian kroner depreciate. This is because the domestic purchasing power of the Government Pension Fund Global (GPFG) is temporarily increased when Norwegian kroner depreciate. In addition, tax revenues increase as a result of temporarily high profitability in the export sector.
The Norwegian kroner exchange rate influences the Norwegian economy in various ways
Over the past year, Norwegian kroner have depreciated markedly against the currencies of our trading partners. This influences the Norwegian economy in various ways, including:
higher exports because international competitiveness is improved by making Norwegian goods and services cheaper when measured in foreign currency;
higher consumer price inflation and thereby weaker purchasing power development and weaker private consumption development;
higher wage growth because Norwegian kroner depreciation means an ability to pay higher wages in the manufacturing industry, which is traditionally the first sector to negotiate in the Norwegian model for wage formation;
higher interest rates because inflation is rising and Norges Bank is pursuing an inflation target;
increased value of the Government Pension Fund measured in Norwegian kroner, and thereby a higher trajectory for the expected return on the Fund. Norwegian kroner depreciation will also influence the fiscal room for manoeuvre through its effect on macroeconomic variables such as inflation, foreign trade, employment and wage growth, which in turn have implications for public finances.
All in all, Norwegian kroner depreciation will influence virtually all economic variables in the Norwegian economy. We have in this box used the macroeconomic model NORA1 to shed more light on this. NORA is a general equilibrium model that pays heed to the behaviour and expectations of economic agents. In the model, the responses of economic agents depend on how permanent the Norwegian kroner depreciation is expected to be. The effects will be weak if the depreciation is expected to be transient and temporary, while the effects will be stronger if the depreciation is persistent.
In the analysis, we assume that Norwegian kroner depreciate immediately by 10 per cent as a result of an increase in the risk premium on Norwegian kroner; see Table 3.12. This may happen, for example, if increased uncertainty among international financial market investors causes them to divest Norwegian kroner. The depreciation is fairly persistent, and the exchange rate remains about 5 per cent weaker after two years.
Increased exports, but lower consumption and investments
Norwegian kroner depreciation will result in goods produced in Norway becoming cheaper relative to foreign goods. Economic activity in Norway is thus stimulated through increased exports of Norwegian goods combined with lower imports of foreign goods. On the other hand, economic activity is curtailed by lower consumption and investments. This is a result both of higher import prices and of the central bank in the model pursuing a tighter monetary policy to bring inflation back to the inflation target. All in all, Norwegian kroner depreciation will have moderate positive effects on GDP; see Table 3.12, but noticeable effects on the composition of GDP. Figure 3.23 shows the deviation from the baseline scenario for mainland GDP, decompiled into the contributions from private consumption, investments and net exports, respectively.

Figure 3.23 Effect of Norwegian kroner depreciation on mainland GDP. Deviation from baseline scenario in per cent of mainland GDP
Source: Ministry of Finance.
Norwegian kroner depreciation results in higher inflation. Figure 3.24 shows the deviation from the baseline scenario for consumer price inflation decompiled into the contributions from imported and domestic inflation, respectively. It shows that the initial increase in inflation is solely due to the contribution from imported inflation, while domestic inflation will also gradually contribute over time, which amplifies the increase in inflation.
An important reason why domestic inflation increases is higher wage growth. In the NORA model, wages are determined through bargaining between a trade union and representatives of the sector exposed to international competition, in line with the Norwegian model for wage formation.2 The parties will take into account the macroeconomic situation, including how long the economic disruption is expected to last. When Norwegian kroner depreciation leads to higher profitability in the manufacturing industry, this serves to increase wages, although there is a time lag between profitability changes and wage growth changes. Over time, higher interest expenses will have the opposite effect on profitability, thereby resulting in lower real wages. Real wages increase by 0.3 per cent in the first year, but will after a few years be lower than in the baseline scenario, when the interest rate effect dominates and reduces profitability. In the model analysis, economic agents are assumed to have precise knowledge of the duration of the Norwegian kroner depreciation. In reality, uncertainty in this regard may result in a somewhat different and more sluggish wage growth response than described by the model.
Norwegian kroner depreciation strengthens public finances
Norwegian kroner depreciation influences public finances because the Government Pension Fund increases in value measured in Norwegian kroner, thereby shifting the expected Fund return trajectory upwards. The increase in the first year is equivalent to 0.5 per cent of mainland GDP; see Table 3.13. In subsequent years, the effect diminishes as Norwegian kroner appreciate somewhat and the domestic price level increases. Norwegian kroner depreciation improves the domestic purchasing power of the Fund capital as long as the real exchange rate is also weaker.
Higher wage and price growth also influences public revenues and expenditure. The main effect on the revenue side comes through the effect of Norwegian kroner depreciation on manufacturing industry earnings, which in the model results in higher operating income, higher dividend income for owners and higher wages for employees. In total, this will strengthen the revenue side by 0.5 per cent of mainland Norway trend GDP in the first year and by 0.4 per cent in the second year. In the long term, when all prices have been adjusted, the effect is neutral, as all revenue components have been normalised and are growing in line with mainland GDP.

Figure 3.24 Effect of Norwegian kroner depreciation on consumer price inflation. Deviation from baseline scenario in percentage points
Source: Ministry of Finance.
Table 3.12 Effect of Norwegian kroner depreciation on macroeconomic variables. Deviation from baseline scenario in per cent
Year | 1 | 2 | 3 | 10 |
|---|---|---|---|---|
Nominal exchange rate | 6.2 | 5.2 | 3.9 | 3.4 |
Real exchange rate | 5.9 | 4.3 | 2.2 | -0.5 |
Mainland Norway GDP, volume | 0.0 | 0.1 | 0.0 | -0.1 |
Mainland Norway GDP, nominal | 0.3 | 0.9 | 1.6 | 3.9 |
Price level (CPI) | 0.6 | 1.3 | 1.9 | 4.0 |
Money market rate, deviation in percentage points | 1.0 | 1.6 | 1.4 | 0.2 |
Inflation (CPI growth), deviation in percentage points | 0.5 | 0.7 | 0.6 | 0.2 |
Real money market rate, deviation in percentage points | 0.5 | 0.9 | 0.7 | 0.1 |
Real wages | 0.3 | 0.3 | 0.1 | -0.2 |
Employment | 0.0 | 0.1 | 0.2 | -0.1 |
Unemployment, deviation in percentage points | 0.0 | -0.1 | -0.1 | -0.1 |
Source: Ministry of Finance.
On the expenditure side, we make the technical assumption that the real level of public expenditure remains unchanged when inflation changes.3 Consequently, higher inflation and wage growth will lead to increased public expenditure measured in current prices, primarily through higher prices of goods and services and wages that form part of consumption expenditure and investment, as well as increased transfers. Measured as a share of mainland Norway trend GDP, the expenditure side is more or less neutral since expenditure grows roughly in line with trend.
Overall, the fiscal room for manoeuvre is expanded in the short term. Whether such expanded room for manoeuvre should be used needs to be assessed on the basis of applicable fiscal policy guidance. The fiscal guideline stipulates that major changes in the value of the Fund should not immediately result in major changes in Fund spending, which should instead be adjusted over several years. In the short term, Fund spending should also be adjusted to the economic situation. This white paperhighlights the importance of fiscal policy working in tandem with monetary policy, so as not to put undue upward pressure on interest rates. This calls for fiscal policy restraint when exchange rate depreciation exerts upward pressure on price and wage growth in the economy, while the impact on activity levels and unemployment is fairly modest.
In the long term, the effect of the Norwegian kroner depreciation on the budget and expected Fund return is neutral, i.e. revenue, expenditure and expected Fund return will then be unchanged as a share of nominal mainland GDP. The long-term effect of the Norwegian kroner depreciation is an increase in nominal values measured in Norwegian kroner, but in real terms the long-term situation is the same as in the baseline scenario. This clearly illustrates how the Norwegian kroner depreciation, regardless of how persistent it is, can only have a temporary effect on the domestic purchasing power of Fund returns. In the long term, domestic prices adjust, neutralising the purchasing power improvement resulting from the Norwegian kroner depreciation.
Table 3.13 Contribution to change in fiscal balance and expected Fund return, per cent of nominal mainland GDP trend
Year | 1 | 2 | 3 | 10 |
|---|---|---|---|---|
Revenue side (A) | 0.5 | 0.4 | 0.1 | 0.1 |
Expenditure side (B) | 0.0 | 0.1 | 0.0 | 0.0 |
Net effect on the budget of changes in prices and wages, etc. (A-B) | 0.5 | 0.3 | 0.0 | 0.0 |
Expected Fund return | 0.5 | 0.4 | 0.2 | 0.0 |
Source: Ministry of Finance.
1 NORA (NORwegian fiscal policy Analysis model) is a macroeconomic model that can be used to analyse how fiscal policy influences key macroeconomic variables in the medium term. Thus far, the model has been calibrated, and the model is currently being quantified using Norwegian data. This analysis is based on the 2019 calibration of the NORA model. This analysis complements a previous analysis of a similar issue in a simple theoretical model and using simulations in the KVARTS macroeconomic model; see Dyvi, Y. (2022), Kronekursendringer og handlingsrommet i finanspolitikken, Working Paper 2022/1, Ministry of Finance.
2 In NORA, the trade union and employers negotiate the level of the real consumption wage, which is the wage level relative to the consumer price index. A common representation of the Norwegian model for wage formationis that the real product wage, i.e. the wage level relative to producer prices, is negotiated. In the case of a shift in the exchange rate, as analysed here, this difference will not necessarily be of much significance, since the main reason why the bargaining outcome is influenced is the direct increase in profitability in the sector exposed to international competition, as a result of exchange rate depreciation.
3 Since public finances improve through both an increase in the Norwegian krone value of expected Fund returns and higher taxes, the authorities will in principle be able to increase expenditure more than is assumed in the analysis. The analysis is based on the technical assumption that the expanded room for manoeuvre is used for cash transfers to non-liquidity-constrained households, but this is excluded from the expenditure calculation. This ensures that the expanded room for manoeuvre is only to a minimal extent used in a way that has macroeconomic effects (since these households will save virtually the entire cash transfer), and will in practice have the same effect as retaining the capital in the Fund.
Footnotes
Central, regional and local government as a whole, and including the Government Pension Fund.