3 The petroleum industry
Figure 3.1
Chapter 3 provides an overview of the development within selected areas of the Norwegian petroleum industry in recent years.
3.1 Operations concepts
There are several different operations concepts on the Norwegian shelf and new solutions are being developed. The current solutions vary from subsea wells and simple wellhead platforms to integrated drilling, production and living quarters facilities.
Many fields on the Norwegian shelf have access to infrastructure with available capacity that can be utilised in the development of new fields. This has resulted in some new fields being tied in to existing facilities.
There are several production facilities on the Norwegian shelf that are normally unmanned, and that are only staffed in connection with maintenance. Such facilities currently in operation on the shelf have helicopter decks. The first simple facility without a helicopter deck has now been installed on the Oseberg field through the Oseberg Vestflanken 2 development project, but has not yet started production. Special ships have been developed in recent years with gangways that can also be used to staff such facilities. Mobile gangway solutions that can be installed on various types of existing offshore vessels have also been developed. These types of solutions are often called “walk to work“ (W2W). Simpler facilities without helicopter decks are an alternative for some future developments.
Integrated operations is a term that comprises everything from video conferences between offshore and onshore and suppliers’ monitoring of equipment, to moving control rooms onshore. Integrated operations have been applied on the Norwegian shelf for many years. Establishing higher quality data communication between facilities on the shelf and land has enabled closer cooperation between experts onshore and operations personnel on the shelf. This has resultet in tasks previously performed on the facilities being moved onshore. For several new fields, the solutions facilitate control room functions onshore in addition to control rooms on the facilities. For some facilities, the objective is to be able to monitor and provide operations support from land, while for others, the plan is to control the installation from land in its entirety, with the option of taking over control offshore. There is constant evaluation of which tasks could be moved onshore in connection with streamlining processes. The industry’s goal is to achieve safer and more efficient operations. Integrated operations have resulted in better exchange of information in real-time and have been implemented throughout large parts of the shelf.
The term multipurpose vessel is used in reference to advanced ships that can be used for multiple purposes. The multipurpose vessels are often specially designed for a specific activity segment, for example diving activities, but can also be used for other activities, such as construction, repair and maintenance activity.
Multipurpose vessels are not a separate ship category, but a collective term used to refer to vessels that can perform various supply and support functions. Multipurpose vessels are discussed in more detail in Chapter 4.6.2.
3.2 The player landscape
Today we have a wide range of players on the Norwegian shelf. The changes in the player landscape are inter alia the result of a long-term and deliberate policy to promote competition and efficiency on the Norwegian continental chelf. This policy has contributed to a number of discoveries and field developments.
The current number of companies is somewhat less than just a few years ago. This is largely due to the restructuring that has taken place in the industry in recent years. The changes among the operating companies are largely related to mergers and acquisitions, and have e.g. led to more robust companies on the shelf. Medium-sized companies with an active commitment on the Norwegian shelf have, in particular, emerged stronger from this restructuring process, in part due to the opportunities that have opened up when some of the largest international oil companies have sold out of certain older fields.
One recent development is closer cooperation between the oil companies and the oil service companies in several of the new developments. Smaller companies are joining forces more often to lease drilling facilities, and hire in dedicated companies that handle planning and operational support on behalf of these companies.
Storting Report 29 (2010–2011) Joint responsibility for good and decent working life, pointed out the challenges associated with changes in the player landscape, including the fact that new players had weaker competence and capacity, and less financial strength as compared with the major oil companies with long traditions on the Norwegian shelf. This was one of the reasons that the existing Ministry of Labour in 2012 appointed an expert group to review the supervision strategy and HSE regulations in the petroleum activities, cf. Chapter 5. One of the conclusions of the expert group’s report was that there is a need for a guide and facilitator function for the HSE regime and the regulations in relation to new licensees. This has been followed up with the establishment of an HSE Forum under the direction of Norwegian Oil and Gas association, with objectives including transfer of experience and lessons for new licensees and smaller companies on the Norwegian shelf.
While the player landscape has become more diverse in the new millennium, Statoil is still clearly the largest player on the Norwegian shelf. The company is the operator for about 70 per cent of the Norwegian oil and gas production. However, Statoil is now responsible for a considerably smaller percentage of new field developments than was the case previously. Due to its position, Statoil is important for the level of HSE in the industry, and has great significance for the overall activity on the shelf.
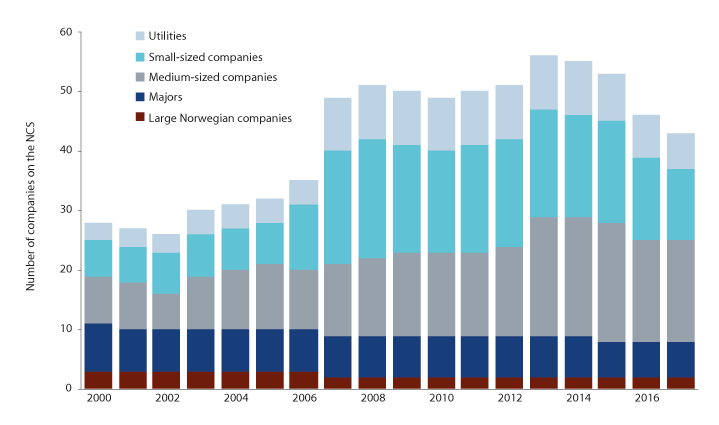
Figure 3.2 Number of players on the Norwegian shelf, distributed by size, 2000–2017
Source www.norskpetroleum.no
3.3 Activity level
The petroleum industry is a cyclical industry. After a period of decline, there are now signs that the activity level is on the rise. The players in the industry have worked together to streamline operations, optimise development plans and reduce costs.
3.3.1 Production and reserves
Total petroleum production in 2017 was 236.4 million standard cubic metres of oil equivalents (Sm³ o.e). Oil production in 2017 was somewhat lower than in 2016, but more gas was sold than ever before (122.0 billion Sm³ gas). A moderate increase in petroleum production on the Norwegian shelf is expected for the next five years, mainly due to new fields coming on stream.
Over time, the number of producing fields on the Norwegian shelf has grown. Older fields are still producing, while new fields have been added. Nevertheless, total production has not increased because the production from the new fields has not been greater than the decline as a result of draining the resources in existing fields.
The resource accounts for 2017 indicate that 45 per cent of the total petroleum resources on the Norwegian shelf were produced by the end of 2017. Of the remaining resources, it is estimated that approx. 50 per cent are located in existing fields, ten per cent in discoveries not approved for development, while nearly 40 per cent have not yet been discovered. Nearly half of the remaining resources on the Norwegian shelf are expected to be situated in the North Sea. About one-third are expected to lie in the Barents Sea, while the remainder are located in the Norwegian Sea. The situation is different for the estimated undiscovered resources. About two-thirds of these resources are located in the Barents Sea, while the rest are distributed between the Norwegian Sea and the North Sea.
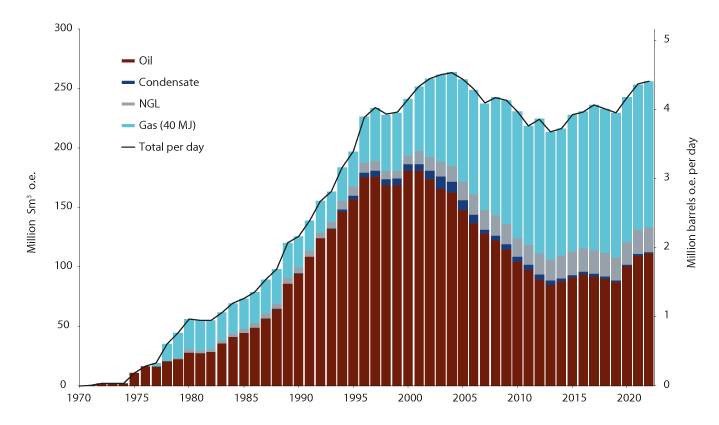
Figure 3.3 Historical and expected production of oil and gas in Norway, 1970–2022
Source www.norskpetroleum.no
3.3.2 Investments and exploration
The level of investment on the Norwegian shelf is high, but lower than the peak years 2012–2015. Development projects such as Johan Sverdrup have been important for development players in the industry after the decline in oil prices. Ten plans for development and operation (PDOs) were submitted in 2017 and submission of more development plans is also expected in 2018. Major investments are also being made in operating fields, in pipelines and onshore facilities. Over the longer term, the activity will depend on making new discoveries, developing existing discoveries and implementing improved recovery projects on existing fields.
Exploration activity has been stable over the last two years, despite lower oil prices. In 2017, 17 exploration wells were drilled in the Barents Sea, five in the Norwegian Sea and 12 in the North Sea. It is expected that the number of exploration wells in 2018 will be at about the same level as in 2017. Exploration activity on the Norwegian shelf is relatively high in a historical perspective.
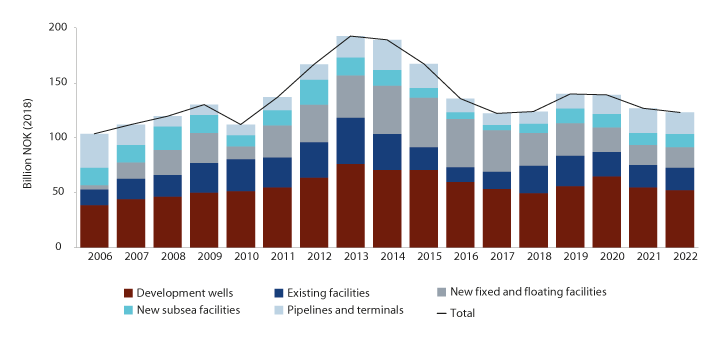
Figure 3.4 Investments on the Norwegian shelf distributed by main categories. Historical figures for 2006–2016 and forecast for 2017–2022
Source www.norskpetroleum.no
3.3.3 Mobile facilities
After 2013, there has been a reduction in the activity with mobile facilities on the Norwegian shelf. Figure 3.5 shows the development in number of days where mobile facilities have been in operation on the Norwegian shelf since 2000. The activity in 2017 was the lowest recorded since 2004. A gradual increase in activity is expected in 2018 and forward.
Of the 65 mobile facilities with an Acknowledgement of Compliance (AoC), 26 were active on the Norwegian shelf as of January 2018.
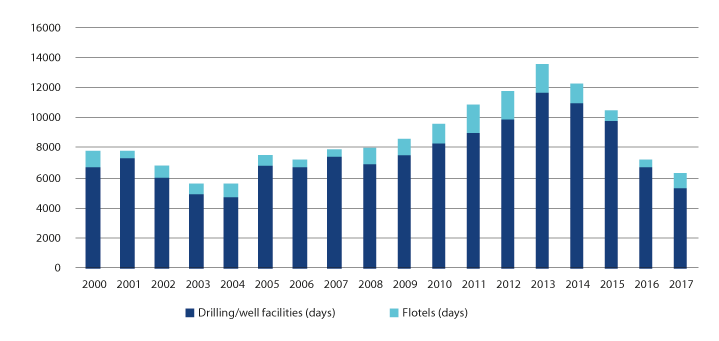
Figure 3.5 Development in rig days on the Norwegian shelf
Source RNNP 2017
3.3.4 Onshore facilities
There are eight onshore facilities for landing and/or processing of oil or gas in Norway. The refineries, which mainly produce gasoline and diesel, were subject to significant changes in the market after the financial crisis in 2009, when surplus capacity and pressure on margins for refinery products entailed a need to adjust the activity. The other onshore facilities are also affected by both changes in oil price and by the market for gas products.
Figure 3.6 shows the development in hours worked distributed between operator and contractor employees in the onshore facilities.
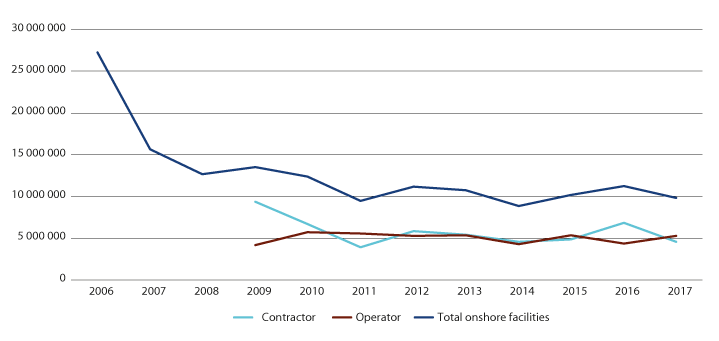
Figure 3.6 Development in hours worked distributed between operator and contractor employees in onshore facilities
Source RNNP 2017
3.3.5 Supplier industry
The supplier industry is Norway’s second largest measured in turnover (after the sale of oil and gas) and consists of more than 1100 companies throughout the entire value chain: from seismic, engineering, drilling rig equipment, shipyard industry, advanced offshore supply and service vessels, as well as subsea technology. During the period from 2002–2013, the Norwegian supplier industry underwent a period of strong growth, averaging 14 per cent per year. Sales in the supplier industry amounted to NOK 481 billion in 2015. In 2016, sales in the Norwegian-based supplier industry amounted to NOK 378 billion, of which 35 per cent in international markets1. Lower oil prices and a weaker market both internationally and in Norway has created a need for readjustment in the supplier industry.
3.3.6 Employment in the industry
In 2013, 232 100 employees in Norway could be linked to the petroleum industry, either as employees in the industry itself, or associated with suppliers or subcontractors to the industry. As a consequence of reduced investments in the petroleum industry, new estimates indicate that the number of employees associated with the industry was reduced to 183 800 in 2016, a decline of nearly 50 000 employees2.
3.3.7 Permanent, temporary employee or contract hire
The RNNP survey (cf. Chapter 4.2.1) maps whether employees offshore and at the onshore facilities have permanent or temporary employment, and whether they are contracted in to the company they work for. The mapping of contract hires offshore did not start until 2017. The results show that the percentage of temporary employees and contract hires is considerably higher in contractor companies than in operating companies. Figure 3.7 shows the percentage of temporary employees and contract hires in contractor companies. Figure 3.8 shows the percentage of temporary employees and contract hires in operating companies.
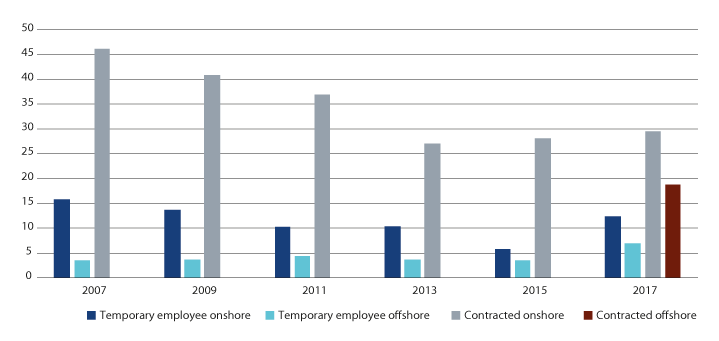
Figure 3.7 Percentage temporary employees and contract hires in contractor companies
Source RNNP survey 2017
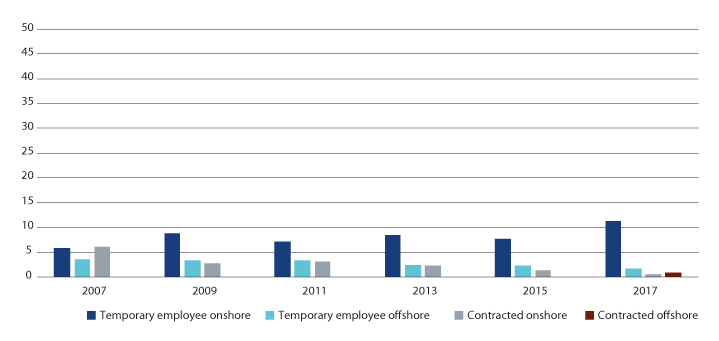
Figure 3.8 Percentage temporary employees and contract hires in operating companies
Source RNNP survey 2017
3.3.8 Hours worked on mobile facilities and production facilities
Figure 3.9 shows the development in number of hours worked on production facilities, distributed between operator employees and contractor employees, as well as the development in number of hours worked on mobile facilities. As can be seen from the figure, there has been a marked decline in the hours worked for contractor employees on production facilities and employees on mobile facilities in the period after 2014.
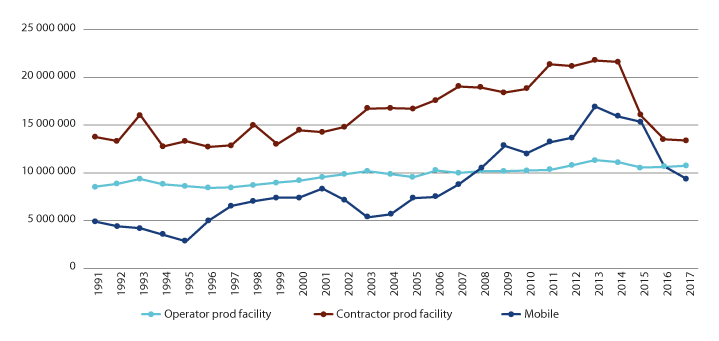
Figure 3.9 Development in hours worked distributed between mobile facilities and operator and contractor employees on production facilities
Source RNNP 2017
Footnotes
Report (2017). International turnover from Norwegian oil service companies. Report from Rystad Energy to the Ministry of Petroleum and Energy – 31 October 2017
Statistics Norway, published 18 January 2017: https://www.ssb.no/nasjonalregnskap-og-konjunkturer/artikler-og-publikasjoner/faerre-sysselsatte-knyttet-til-petroleumsnaeringen