Part 2
Prerequisites for private ownership in Norway
3 Ownership in Norway
3.1 The Norwegian capital market – overview and figures
The capital market is a collective term for the markets in equity and debt instruments (external capital). The market for external capital can be divided in turn into bank debt and bonds.
A well-functioning capital market contributes, through different functions, to efficient resource allocation over time and increased value creation. Among other things, the capital market facilitates the matching (of savings, consumption and investments) over time, by linking those who want to save with those who want to consume or invest, including in business and industry, and helps distribute risk between market participants. By issuing shares and bonds in the securities markets, enterprises can finance projects and the risk can be spread across several investors and lenders.
The total capital stock of non-financial corporations1 in Norway was around NOK 9,600 billion in 2012, of which NOK 5,600 billion was debt and NOK 4,000 billion was equity; see figure 3.1. Norwegian companies therefore have a larger share of their capital financed by external capital than by equity2. This proportion has been stable in recent years. There has been a moderate rise in the value of total balance sheet items, but given inflation and economic growth in the same period, the annual growth is moderate (around 3 per cent in real terms).
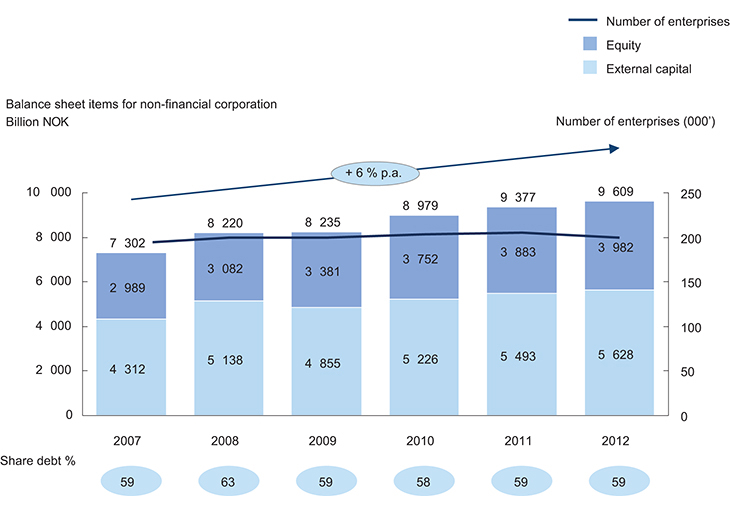
Figure 3.1 The allocation between equity and external capital among Norwegian corporations.
Source Statistics Norway
Compared with some other European countries, the size of the Norwegian equity market, as a share of GDP, is around the average. Book equity comprised 53 per cent of GDP at the start of 20143, whereas similar values for Sweden, Finland and the Netherlands, for example, were more than 75 per cent. In addition, Norway has a relatively small external capital market for non-financial enterprises compared with other European countries; see figure 3.2.
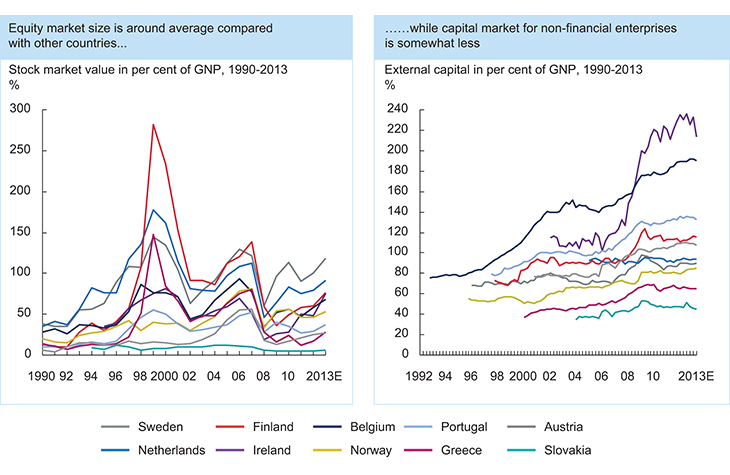
Figure 3.2 The markets for equity and external capital in selected European countries.
Source Standard & Poor’s, Statistics Norway and equivalent national statistical offices for other countries in the analysis.
The Norwegian capital market has tended to recover quickly in the wake of turbulent periods. Following the dot-com bubble in the early 2000s, the capital market in Norway was affected to a small extent, and although the financial crisis of 2008–2009 almost halved the value of the Oslo Stock Exchange, Norway was one of the countries which recovered fastest. To some extent, the latter may be due to the financial crisis in Norway not being followed by a fiscal crisis and high long-term unemployment, and to the sectoral composition of the companies on the Oslo Stock Exchange, among other things.
3.1.1 The equity market
The equity market can be divided into private and public sector, and into listed and unlisted companies. Figure 3.3 shows an overview of the ownership structure of equity in Norway. The figures for the listed share of equity represent market value at the start of 2014, while the unlisted share represents book value at the start of 20124. Of total equity, around 35 per cent is listed on the stock exchange, while around 65 per cent is unlisted. This means that the majority share of equity in Norway is not listed on the stock exchange5. Of the listed equity, around 35 per cent is publicly owned, primarily within public administration6, while 65 per cent is owned by the private sector, by financial enterprises, non-financial enterprises7, households, foreign investors and other owners. Of the unlisted equity, 30 per cent is publicly owned. The remaining 70 per cent is privately owned, and is distributed between institutional, industrial and foreign investors, and family companies and households8.
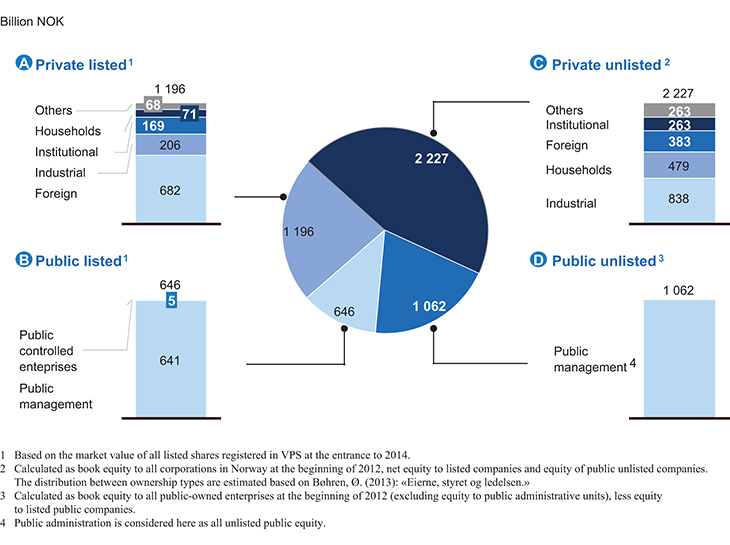
Figure 3.3 The equity market in Norway.
Source VPS, Statistics Norway, Proff and Bøhren.
On average, the stock exchange listed share of the equity market has yielded high returns in the last decade. Between 2003 and 2013, the Oslo Stock Exchange produced an average annual overall return of around 13 per cent, which is higher than the other Nordic stock exchanges. This may reflect which industries are relatively over-represented and under-represented on the Oslo and other stock exchanges. The Oslo Stock Exchange has, however, experienced higher volatility. One reason for this may be that the stock-exchange-listed companies are relatively more exposed to commodity prices, such as the prices of oil and gas. During the financial crisis, the Oslo Stock Exchange had the highest fall in value of the Nordic stock exchanges9 (from September 2008 to March 2009). Part of the fall may be explained by a considerable weakening of the Norwegian krone in the same period.
The above illustrates some of the difficulties the Norwegian capital market faces from being a small market with many foreign investors. When financial turbulence occurs in global markets, foreign owners often move capital back to markets with larger and more stable currencies. This weakens smaller currencies, and was a major contributor to reinforcing the fall in value and increase in volatility on the Oslo Stock Exchange during the financial crisis.
In the stock market, continuous assessments are made of expectations of the market as a whole and of the individual companies’ activities. This happens both in the primary market, i.e. as regards the price of new shares in connection with initial public offerings and capital increases (issues), and in the secondary market, via the ongoing pricing of a company’s share capital. Both the primary and secondary markets may yield indications of activity on the stock market.
Activity in the primary market can be measured by the total volume of issues on the Oslo Stock Exchange. Oslo was clearly the most active stock market in the Nordic region in the period 2005–2013, with twice the issue value and more than three times as many IPOs as the Copenhagen exchange, which was the second most active. In this period, 202 new companies were listed on the stock exchange in Oslo, compared with 74, 56 and 24 IPOs on the stock exchanges in Stockholm, Copenhagen and Helsinki respectively. In 2013, the companies listed on the Oslo Stock Exchange attracted more than three times as much capital as companies on the other Nordic exchanges. This is in spite of the fact that the issue volume in Oslo has fallen considerably in the last two years, and in 2013 was well below the 15-year average. It should however be mentioned that the market for issues on the Oslo Stock Exchange has historically been highly volatile10.
The high level of activity on the primary market is powered by a number of factors, including the keen interest from foreign companies11. This relates in particular to offshore and oil and gas, the maritime industry and the seafood industry. These are three key sectors in Norway, and the companies take a positive view of proximity to an equity market that is knowledgeable about their own sector. The Norwegian capital market is considered to be among the world’s largest as regards these three sectors, especially in terms of analytical expertise.
Activity in the secondary market closely reflects the liquidity in the market. The liquidity of different investments is of great importance for the investors’ investment decisions. A liquid market for a share provides a better profit and risk assessment of projects and undertakings, since more investors implicitly make such assessments through continuous pricing of the shares. Statistics from the World Federation of Exchanges indicate that a number of European markets12 have become less liquid in recent years, following a peak just before the financial crisis. The annual trade in shares on the Oslo Stock Exchange has reduced from around USD 550 billion in 2007 to USD 140 billion in 2013, corresponding to a fall of 74 per cent. In the last two years, this fall has moderated which may indicate that the market has normalised. There has been a corresponding trend in the turnover rate13, in which most European countries have experienced a market decline since 2008. For Norway, in 2008, the average turnover rate was around 155 per cent. This figure reduced to around 50 per cent in 201314. The downward trend was stronger for Norway than for the other countries12, and the turnover rate in the last two years has moved below the level of both the Nordic9 and Swiss exchanges.
One of the reasons for the relatively strong decline in Norway is the introduction of the EU MiFID (Markets in Financial Instruments Directive) in 2007, which allowed for the establishment of MTFs (Multilateral Trading Facilities). MTFs are marketplaces which allow trading in shares that are already listed on other exchanges. In recent years, Oslo Stock Exchange has therefore had competition from other marketplaces in offering trade in Norwegian shares, and the other Nordic exchanges in particular have taken some of the trade which formerly took place on the Oslo exchange. Another reason is the increasing proportion of Norwegian shares traded via so-called «dark pools«15, where the volumes are not recorded on the Oslo exchange16.
3.1.2 The external capital market
External capital is a collective term for debt instruments which companies use for financing. Both turnover and issue activity on the Norwegian bond market have increased substantially in the last decade. This has been driven primarily by two factors: firstly, market evaluations and regulatory requirements have increased the costs of financing through credit institutions. The companies have increasingly also used the stock exchange to acquire loan capital. Secondly, the bond market has become more accessible through the creation of Nordic ABM (formerly Oslo ABM) as an alternative marketplace for listing and trading in bonds and certificates. Nordic ABM was launched in 2005 as a self-regulating marketplace, not subject to the regulations in the Norwegian Stock Exchange Act, which means that the listing process is somewhat simpler and that issuers have a greater flexibility in terms of choice of accounting standards17. Nordic ABM has contributed to a significant increase in issue volume, and in 2013 had a 44 per cent share of the Norwegian volume of bond issues18.
3.1.3 Other characteristics
Beyond the general descriptions above, there are particular features that characterise the Norwegian capital market.
The Norwegian capital market is largely energy driven. As the world’s third largest gas exporter and fifth largest oil exporter, Norway is a leading energy-producing and trading nation. This is also reflected in the capital market. For example, energy sector companies represent more than 40 per cent of the value of the Oslo Stock Exchange. Although this is predominantly driven by a few large companies, notably Statoil, the Oslo Stock Exchange is also large in terms of the number of listed energy-related companies, with the second highest number in Europe. Over the last two decades, oil service has grown to become a key segment of the energy sector. By the number of listed companies, Oslo is currently the world’s second largest exchange for oil service companies19.
The Norwegian capital market is dominated by a small number of sectors. Beyond the energy sector, the maritime industry and the seafood industry in particular are substantial. The Oslo Stock Exchange has grown to become the world’s second largest shipping exchange and the world’s largest seafood exchange, which has made a substantial contribution to the high level of share issues in recent years. Since 2010, more than ten new shipping and seafood oriented companies have been listed on the Oslo Stock Exchange20.
3.2 Asset management and ownership in Norway
3.2.1 Private ownership
Private ownership includes all ownership that is not public, i.e. where the state, county authorities or municipalities are not dominant owners. In Norway, the majority of the capital invested in Norwegian companies is owned by private entities, and according to Statistics Norway is primarily distributed between households, institutional owners, foreign owners and industrial owners. Privately owned companies can be either listed or unlisted.
Unlisted private ownership constitutes the majority, at around 65 per cent of private ownership; see figure 3.35. In contrast to listed companies, unlisted ownership is relatively little analysed, less transparent and may be difficult to find good up-to-date data on. This applies, for example, to family ownership, which represents a substantial proportion of private unlisted ownership.
Private ownership constitutes around 65 per cent of the value of the Oslo Stock Exchange. Of this, the proportion of foreign ownership is high (37 percentage points) in comparison with other countries. The share has gradually increased since 1995 when the EEA Agreement allowed foreign investors to own more than one third of the voting shares in Norwegian companies. Foreign owners are defined here as all investors registered outside of Norway with shareholdings in Norwegian-registered companies. Institutional and industrial owners own roughly the same amount of the value of the Oslo Stock Exchange at 9 and 11 per cent respectively, while households own only 4 per cent. Institutional investors are those whose purpose is to undertake financial investment activity, typically on behalf of clients. Industrial ownership includes all non-financial limited companies and privately-owned enterprises with the exception of households. Households are all private individuals who directly own part of a company registered in Norway. The different groups of owners will be described in more detail below.
Norway has a low proportion of private ownership of shares compared with many other European countries; see figure 3.4. This must be viewed against the fact that the share of public ownership is higher in Norway than in other countries. Like most other countries, Norway has a considerable share of foreign and industrial ownership, but a considerably smaller proportion of institutional owners and a low proportion of owners among households compared with other European countries.
When it comes to unlisted private ownership, the situation is different. Foreign owners own a 17 per cent share, while industrial owners and households own 38 per cent and 22 per cent respectively21.
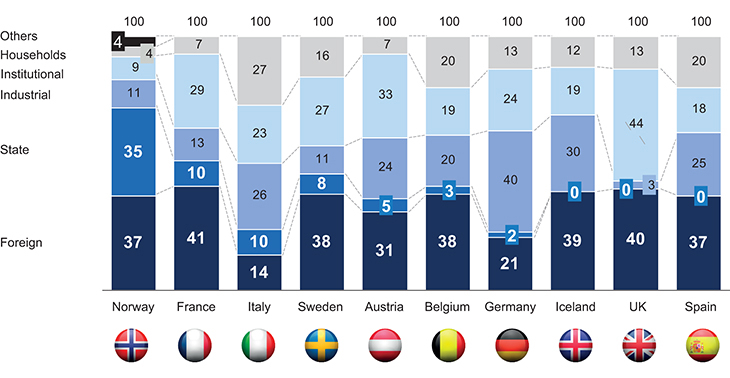
Figure 3.4 Listed shareholdings by type of owner in different countries. Measured by value. Data for Norway from 31.12.2013. All other data from 2007.
Source Federation of European Securities Exchanges 2007, Proff and VPS.
3.2.1.1 Households and family companies.
According to Statistics Norway’s definition, households include individuals or groups of persons who share the same dwelling, combine all or parts of their income and assets, and are consumers and who directly own part of a company registered in Norway (listed or unlisted)22. There are large differences in the households’ shares of the equity market between the listed and unlisted segments.
For the listed segment, households own only around 4 per cent of the value of the Oslo Stock Exchange, which represents low direct ownership compared with other European countries. The low stock exchange holdings of households are due to a number of factors. Firstly, the structure of Norwegian households’ financial assets differs considerably from other countries, in that Norwegians generally have little personal savings, in part because the state is a considerable saver. In addition, the fact that Norwegian households own their own dwellings to a much greater extent than in other countries must be taken into account. The composition of savings must also be viewed in the light of the Norwegian tax system, and that different assets are valued differently.
For unlisted companies, households represent a considerably larger proportion of total ownership with a share of around 22 per cent21. The difference in household ownership between listed and unlisted companies can essentially be explained by the fact that nearly all Norwegian family companies are unlisted. A family company is defined as a company where more than half of the shares are owned by people who are married to, are in-laws of, or are related to each other. Family ownership is widespread in Norway23. In 2011, around 65 per cent of all active Norwegian limited companies were unlisted family companies, i.e. where the family owned at least 50.1 per cent of the shares. By including companies where the families owned at least 33.3 per cent of the shares, the proportion increases to around 80 per cent. Although family companies represent a large share of the total number of limited companies in Norway, the companies are relatively small since, in the same year, they accounted for only 36 per cent of employment, 19 per cent of turnover and 13 per cent of assets24.
One characteristic of family-owned companies is their high concentration of ownership. For example, the largest individual owner’s shareholding is on average higher in family companies (79 per cent) than in companies without family control (52 per cent). By combining the holdings of all the members of one family into one holding, the largest owner has on average a shareholding of 93 per cent in family-owned companies20.
For family companies, the high ownership concentration affects potential agency dilemmas. The high ownership concentration causes high levels of occupancy of inside positions, such as seats on the board, chair of the board and managing director. In 74 per cent of family companies, the largest owner acts as both chair of the board and managing director, compared to only 12 per cent in other companies. In this way, family companies avoid part of the potential agency dilemma of possibly divergent goals between owners and management, even though this presents other challenges, for example relating to the board’s governance function.
Family ownership is considered to be stable and long term. A study by Menon Business Economics from 2009 shows however that a low proportion of change of ownership from persons owning more than 33.4 per cent is to the benefit of children or other relatives of the original owners25. The study also points to surveys performed by Statistics Norway in 1997 and 2003, which show that 27 per cent of family companies in 1997 did not have this ownership status in 2003. Studies from other countries show a similar pattern26.
3.2.1.2 Innovation and entrepreneurship
Entrepreneurs are part of the industrial ownership landscape. There are many definitions of what an entrepreneur is27. Here it is defined as a person who establishes an enterprise, usually involving a considerable degree of risk.
One possible indicator of entrepreneurial activity is the number of start-ups as a proportion of the total number of companies. This business start-up rate in Norway is relatively low compared with other countries. For example, Norway has a considerably lower business start-up rate than other European countries such as Sweden, Luxembourg, Belgium and Austria; see figure 3.5. What is key for society and for value creation is however not the number of entrepreneurs and new enterprises, but rather the value they create. In many cases, poor labour market opportunities can lead many people to create their own companies, and it is therefore not obvious what a country’s business start-up rate should be.
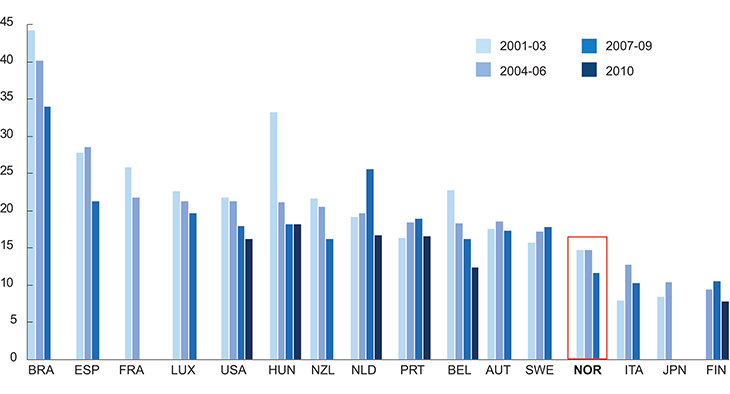
Figure 3.5 The business start-up rate in Norway. Business start-ups as a percentage of total number of companies in OECD countries.
Source OECD (2014): «Economic Surveys: Norway.»
In 2011, Menon Business Economics investigated the most important sources of capital for start-ups28. In the very earliest stages, the entrepreneurs’ self-financing is the most important source of capital. This may be in the form of unwaged work or a direct capital injection, from savings or a private loan. Capital from the entrepreneur’s circle of acquaintances may also be important in the earliest phase. Loans can be an important additional source of capital for many start-ups. Of the potential high-growth enterprises in Menon’s survey, 60 per cent received loan financing in their second year of operations. Other sources of capital which may be important for a smaller selection of companies with high growth potential may include business angels and venture capital.
There are few sources of reliable and comparable international statistics on capital access for start-ups. Sources for data on venture capital investments are mainly based on national and regional venture capital associations, sometimes in cooperation with commercial entities. This can lead to differing answers to apparently simple questions, depending on the data source used. International comparisons are difficult and even the harmonised data from the OECD must be interpreted with caution29.
According to the OECD’s figures, Israel, the USA and to some degree Canada stand out from other countries in terms of venture capital investments, both relative to population size and GDP. In 2012, Norway was the country with the world’s fifth highest venture capital investments relative to population size, behind the three above-mentioned, along with Sweden, Luxembourg, Switzerland and Ireland. The venture capital investments constitute around 0.3 per cent of GDP in Norway, which is about the average of the OECD countries included in the survey. How the investments are divided into the different phases in Norway, as defined by the OECD, are also roughly the same as the average of the other countries.
In a review of the Norwegian economy, the OECD points out that the business start-up rate and the number of self-employed people in Norway is low despite the low barriers to entry. Among possible explanations, they indicate low unemployment, good welfare schemes and relatively high taxes. Since this is a result of deliberate policies aimed to some extent to achieving other positive political objectives, the OECD suggests minor policy adjustments rather than major changes. The proposals the OECD highlights for a Norwegian entrepreneurship policy are to maintain the commitment to education in science, technology, engineering and mathematics, to assess whether a reduction in wealth tax might boost entrepreneurship, to enhance technology transfer offices (TTO) at Norwegian universities, to continue targeting broad competitive arenas for innovation measures, to improve impact evaluations of public subsidies and to evaluate whether competition policy should exclusively emphasise the consumers’ interests30.
3.2.1.3 Institutional ownership
Institutional owners consist primarily of banks, financing companies, insurance companies, mutual funds, pension funds, private equity funds, and other investment companies31. Even though the proportion of institutional investors in Norway is relatively small, measured by the value of ownership, institutional owners are still an important source of capital.
Figures from VPS show that in 2012 institutional owners owned 9 per cent of listed company value in Norway32. For comparison, in 2007 private institutional owners owned 27 per cent of the value of the Swedish Stock Exchange, and 44 per cent of the value of the London Stock Exchange. In addition, relative to GDP, Norway has limited institutional ownership compared with other countries. In 2011, the value of the shareholdings of Norwegian traditional institutional owners33 was measured at around 70 per cent of GDP, less than one third of the equivalent figure for the UK, and one quarter compared with Denmark34.
One reason for the limited proportion of institutional owners is that Norwegian households save relatively little as securities, and that savings are mainly made through investment in their own private houses. In particular, Norwegians have low pensions savings since these are largely provided by the state through the National Insurance scheme. Since the population can expect to enjoy beneficial National Insurance schemes in the future, this may limit the present perceived need for independent savings35. This limits the use of institutional investors. In other countries, this type of saving may well be done through institutions, thereby having the effect of boosting the share of institutional investors.
3.2.1.4 Foreign ownership
Increased globalisation and ever-greater flow of goods, services and capital across national borders have helped foreign owners become one of the largest groups of investors in Norway. Foreign ownership is often divided into two types of investment: direct and indirect. Direct foreign investment means foreign companies acquiring ownership-based control of activities in Norway. This often involves creating subsidiaries in Norway. This is distinct from foreign indirect investment, or portfolio investment, which primarily relates to short-term involvement in the capital market36. In the figures below, Statistics Norway’s shareholding limit of 20 per cent has been used to differentiate direct investments from portfolio investments.
Direct foreign investment in Norway has roughly doubled since the early 2000s, and is more than ten times higher than in the early 1990s. Historically, this major growth has occurred primarily in connection with oil and gas activities, and in sectors such as financial services, transport and manufacturing. In the 2000s, a lot of the growth was in other sectors such as buying and selling, and operating real estate; see figure 3.6. Although there has been considerable investment in services relating to oil and gas extraction over a long period, this too has seen strong growth over the last decade. Whereas formerly it was access to Norwegian natural resources that brought about the high growth in foreign investment in the oil and gas industry, growth in recent years has been driven extensively by resources in the form of competence and technology, especially among Norwegian oil service companies.
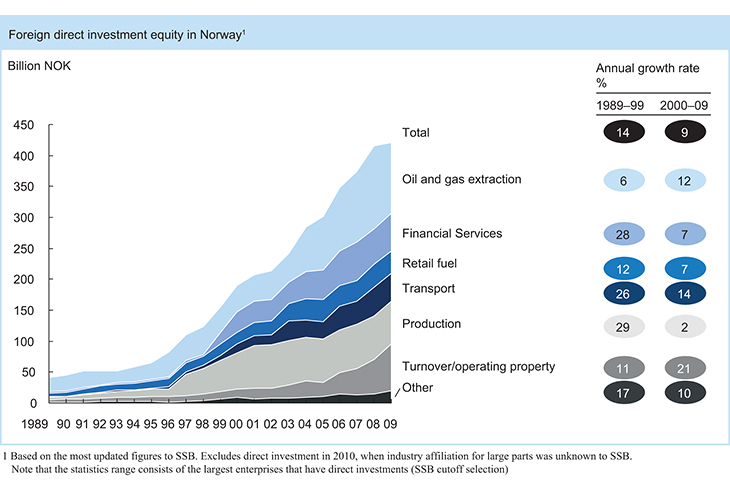
Figure 3.6 Foreign direct investments in Norway.
Source Statistics Norway.
By value, Sweden has the largest proportion of direct foreign investment in Norway at 23 per cent. This is followed by the Netherlands (14 per cent), France (8 per cent), USA (7 per cent), UK (7 per cent), and Denmark (7 per cent). As a percentage of total returns on all foreign investments in Norway, Sweden accounts for only 15 per cent, while the Netherlands (30 per cent), USA (16 per cent) and France (12 per cent) have had relatively high returns on their investments. This is probably because different countries invest in different sectors. Whereas Swedish and Danish-owned companies have historically had most employment in retail trade and service industries, the enterprises with investors from the UK, USA, France and the Netherlands have been more exposed to industry and especially the oil and gas industry, where the return has often been higher than in retail trade and other service industries37.
The extent of indirect foreign ownership can be more difficult to measure. One indicator may be how active foreign investors are on the Oslo Stock Exchange. Although foreign investors own around 37 per cent of the market value of the stock exchange, they account for a full 89 per cent of turnover38. The largest share of the foreign indirect investors are international funds, which to a large extent view the Norwegian stock exchange as an attractive opportunity for diversifying their portfolios across countries39 and for achieving specific company and sectoral exposure. In contrast to more active owners, which largely exercise control by expressing their opinions on the companies’ results at general meetings, such foreign investors exercise their control through frequent buying and selling of shares.
Foreign owners and their capital have played a major role in Norway for a long time. From as far back as Norwegian industrialisation in the early 1900s, foreign owners have been involved in developing business and industry in Norway, often in the form of relatively large and capital intensive enterprises linked to the export industry. Examples of such companies are Orkla, Norsk Hydro, Findus, Lilleborg Fabrikker and Hafslund. Today too, foreign ownership accounts for an important and increasing share of both the Norwegian capital market and Norwegian business and industry. From 2000 to 2014, foreign investors’ stock exchange holdings rose from 34 per cent to 37 per cent. The number of foreign-controlled enterprises in Norway has increased by 38 per cent, from 3,608 in 2000 to 4,979 in 2007. The number of Norwegian-controlled enterprises increased by only 20 per cent in the same period37. Within Norwegian industry, the number of companies owned by foreign entities rose by 90 per cent, from 2003 to 201040.
There are indications that foreign ownership has positive effects. In a doctoral thesis at the Norwegian School of Economics in 200641, Ragnhild Balsvik analysed the effect of foreign acquisitions in Norway in the years 1979 to 2000. The study indicates that industrial companies with foreign owners are more productive on average than Norwegian industrial companies, and that enterprises that are acquired by foreign owners on average increase both productivity and employment following acquisition. Other studies also indicate positive effects. For example, research by Menon Business Economics shows that foreign-owned companies in Norwegian industry perform relatively well in terms of value creation and employment40.
3.2.2 Public ownership
The public sector has extensive ownership which includes both direct ownership in Norwegian companies and indirect ownership in foreign and Norwegian companies. The latter refers essentially to the Government Pension Fund Global and the Government Pension Fund Norway which are administered by the Norwegian Central Bank and the National Insurance scheme. In contrast to direct ownership, these investments are administered on the basis of a financial portfolio perspective, and not based on a strategic ownership perspective in the individual companies. The value of the Government Pension Fund Global and Government Pension Fund Norway were respectively NOK 5,110 billion and NOK 172 billion at 31 March 2014.
In the following, only domestic public ownership is discussed. This comprises primarily the government’s, the municipalities’ and the county authorities’ ownership. The ownership varies between different sectors and different types of businesses.
According to Statistics Norway, public ownership concerns all unlisted and listed, financial and non-financial companies where the state, municipalities and county authorities directly or indirectly own more than 50 per cent of the paid-up share capital, capital contributions or partnership contributions and government and municipal business operations. Public sector enterprises which are defined as administrative units are excluded. This means that independent, commercial companies where the state directly or indirectly has a large holding are considered to be under public ownership. These are however independent legal entities which are not part of the public sector and which also, to some extent, have significant input from other owners.
The public sector owns a considerable proportion of the country’s economic activity. In total, around one third of all equity in Norway is owned by the public sector, see figure 3.3, which is considerable compared with other OECD countries. In recent years, many of these countries have been undergoing extensive privatisation processes. Outside the OECD, the proportion of public ownership is often higher. For example, Brazil, India, Russia and China have substantial private ownership, in the case of the last two around 30 per cent of the country’s total share capital42.
The publicly-owned Norwegian equity is distributed between listed capital at around NOK 646 billion and unlisted capital at around NOK 1,062 billion. The listed part is owned primarily through the ministries and the Government Pension Fund Norway. The unlisted part of public equity constitutes a relatively large proportion of the total unlisted equity market (32 per cent43). The equity owned by public administration is distributed among governmental, county and municipal enterprises (where more than 50 per cent of paid-up share capital are owned), and other governmental and municipal business operations.
Compared with other countries in the Nordic region, Norway has a larger public ownership. There are nonetheless greater similarities between the Nordic countries than with elsewhere in Europe. For example in 2013, Sweden had 42 companies fully-owned by the state and 9 where the state was co-owner. The value44 of the Swedish state’s direct ownership is around NOK 540 billion45. Finland also has considerable direct state ownership with 24 wholly-owned companies and 36 companies where the state is a co-owner. The value of the Finnish state’s direct shareholdings in the listed companies came to around NOK 140 billion at the end of March 201446.
The public sector has ownership interests in companies operating in different industries. In terms of turnover, mining and resource extraction dominate, including the extraction of crude oil and natural gas, with Statoil and the state through the State’s Direct Financial Interest (SDFI) as the clearly largest entities. Companies which have a predominance of public ownership are also particularly active in power supply, transport and information and communications services.
Municipalities and county authorities are significant owners in the Norwegian context, both in the form of county and municipal administration but also as owners of limited companies. Municipalities and county authorities have a large degree of freedom to organise their services, whether as part of administrative activities or through the establishment of independent enterprises. Since the early 2000s, there has been an increase in the establishment of municipal and county-level enterprises. From 2005 to 2010, for example, the number of municipal enterprises increased by 10 per cent47. Although the start-up rate has decreased in the last three years, this type of enterprise has become a larger part of the public ownership spectrum. The control of these companies has increasingly switched from administrative management to corporate governance. According to KS (the Norwegian Association of Local and Regional Authorities)48, this is an undertaking that the municipalities have been less than successful with. According to KS, many municipalities lack control of their enterprises, in addition to lacking concrete ownership strategies.
4 Private ownership as a main rule
4.1 Why should private ownership be the main rule?
Private ownership is the main rule in Norwegian business and industry. According to Statistics Norway, at 1 January 2014 there were 526,703 business enterprises in Norway. The predominant share of these are owned by private entities.
The government believes that there are sound reasons why private ownership should be the main rule in Norwegian business and industry, and why state ownership should require special justification. In the government’s view, there are a number of sound reasons why the state should exercise ownership of different companies. These will vary from company to company, from an initial premise that state ownership may help provide economic and social safeguards. Accordingly, for the foreseeable future Norway will have considerable state ownership. An account of the justifications for this is given in chapter 6.1.
Private ownership is a diverse concept covering different types of holdings, for example family ownership, employee ownership, institutional ownership and ownership by private individuals. Owners have different expectations and can contribute to the companies’ value creation in different ways, and the extent of owner involvement varies from highly active owners, taking an operational role in the companies’ businesses, to passive financial owners with small shareholdings.
Although there is great variation between private owners, in the government’s opinion, private ownership is characterised by certain fundamental factors that make it essentially well-suited to contributing to value creation and improving Norwegian competitiveness.
Private property is fundamental to a well-functioning society. This should also create a basic premise for the ownership of companies and enterprises.
It is mainly private entities that initiate and support the foundation, ownership and operation of companies in Norwegian business and industry. In commercial enterprises in well-functioning competitive markets, private owners will often be best placed to be good owners.
Private owners can often more directly look after their own preferences and property, and exercise more direct personal ownership than the state, which performs its role as an owner on behalf of the community. In the case of a personal owner, there will normally be fewer decision-making steps between owners and management than if ownership is administered by institutions, for example by being involved in the board of directors or in the management. This indicates that personal (private) owners may have stronger incentives for safeguarding their own interests. This can produce better corporate governance, higher profit expectations and more appropriate risk management in line with the owners’ interests.
Private owners can often be closer to the markets and be better informed about the markets’ needs and demands. This applies both to active private owners who are involved in the companies they own, for example on the board, and to passive, more financial, owners who follow the companies’ developments closely on the basis of thorough financial and industrial analyses.
Private owners are likely to have stronger incentives for efficient operation and high returns49. Private owners’ strong incentives in terms of both cost reductions and innovation are a fundamental argument for why private ownership is more appropriate. This has been underpinned by a number of empirical studies showing that, as a rule, privatisation leads to lower costs and higher quality50.
Deficient and unevenly distributed information between companies and their owners, and differing incentives between management and owners may also indicate that private ownership is fundamentally preferable. Those who set up and administer companies often have more information about expected profitability and risk than external capital providers (asymmetric information). There are reasons to expect that the challenges of asymmetric information will be greater for the state as an owner than they will be for private owners. This has to do with the fact that private owners may, for example, be closer to the management (they themselves may sit on the board) or even part of management, and because they may have stronger incentives since they are investing their own assets.
4.2 The challenges of state ownership
In the government’s assessment, the governance of direct state ownership is handled in a professional and responsible way. Through transparency concerning corporate governance principles, acceptance of the division of roles and responsibilities in corporate legislation, governance through general meetings and an emphasis on choosing competent and independent boards of directors, the exercise of Norwegian state ownership can be seen as advanced, including in an international context.
However, there are particular challenges associated with state ownership which tend to limit the extent of direct state ownership in commercial companies in functioning competitive markets, especially in areas where it is easy to distinguish between the state’s use of regulatory instruments and the producing enterprise.
Beyond the arguments in favour of private ownership referred to in chapter 4.1, the government would like to draw attention to three particular challenges associated with state ownership:
Conflicts between ownership of companies and the state’s other roles.
The risk of a concentration of powers which weakens the private sector.
Limitations in industrial expertise.
4.2.1 The state’s different roles
There are potential conflicts between the exercise of the role of owner of a commercial activity and exercise of the state’s other roles. This may give rise to adverse perceptions of the state’s roles and actions as an owner. When the state simultaneously occupies the role of owner, purchaser and/or regulator, this may potentially weaken perceptions of the state’s legitimacy and effectiveness in its undertakings. In exercising state ownership in Norway, the owning ministries responsible try to manage their different roles in an open, orderly and deliberate manner. In exercising governmental and supervisory functions, the state will normally not take account of its own ownership interests. This is particularly the case where companies under state ownership operate in competition with private market participants. Even if the state is able to adopt sound mechanisms for dealing with this issue, this is not necessarily sufficient for ensuring the state’s legitimacy and creating trust that competition takes place on fair terms. In order to avoid conflicts between roles, in areas where there are political objectives, it will be appropriate to try to achieve these objectives to the greatest possible extent through the use of instruments other than state ownership. Where there are private market participants and well-functioning markets, the primary task of the state in respect of business and industry will be to facilitate high levels of value creation in the economy through stable, well-designed framework conditions, rather than managing or owning business activities on its own account.
When the state owns companies, it needs to organise itself in a way that creates confidence that the markets’ requirement for equal treatment of companies is respected. The roles can be refined in such a way that the ownership function is lodged with separate entities that do not have other responsibilities which may conflict with the ownership role. In order to help increase legitimacy, supervisory activities are often delegated to directorates and are thereby fundamentally separated from central administration. A second factor which promotes legitimacy is the EEA Agreement. Through the option of complaining to EFTA’s surveillance authority, the markets have a tool which can be used in cases of doubt as to whether the state is favouring companies under state ownership. This helps both to protect third-party interests (for example competitors of state-owned companies) and to establish a process for dealing with cases where claims of favouritism of state-owned companies are made.
Historically, when the state has engaged in commercial activity, conflicts have also arisen between distribution policy concerns and corporate profitability. In recent years, this has been counteracted by the state having clearly communicated that its ownership will be exercised in a professional and predictable manner in accordance with generally accepted principles for corporate governance and company management, and through clear legislative delimitation of how the state as an owner may act on the basis of competitive interests.
As long as the state has ownership interests, it is however effectively impossible for the state to be organised and to act in such a way as to prevent or discourage doubt being raised about its neutrality in exercising authority. It is therefore necessary to continuously evaluate the justification and the scope of state ownership in commercial companies.
4.2.2 Concentration of power
In a democratic society, private initiative and willingness to invest are the driving force for economic development. The government believes that this is a particular challenge in a small country such as Norway, where the state owns a large proportion of the financial capital. The extent of the state’s direct ownership is considerable. The state owns around one third of the value of the Oslo Stock Exchange through large holdings in some of the biggest companies. At the same time, through its other roles as policy maker, administrative authority etc., the state exercises potentially great power over citizens. Significant state ownership will therefore tend to increase the concentration of power held by the public administration at the cost of citizens. The government believes that this is a factor that should be highly emphasised and that there should be a trend over time towards the state reducing its ownership.
4.2.3 Limited industrial expertise
The state owns businesses in many sectors and industries where the market conditions undergo rapid change. Strong involvement of the owners in board and management positions is often important in such cases. This requires considerable industrial and market-related expertise.
Based on its different roles and in order to avoid political responsibility for commercial decisions, the state has chosen to refrain from participating on boards. Although, as a major owner, the state has considerable influence on the election of board members and sets out clear expectations of the companies, it can be difficult, solely on the basis of an ownership position, especially considering the sectoral diversification of companies under state ownership, to meet the need for active owner participation in such companies. This, too, is an indication that direct state ownership should be limited.
4.3 The government’s policy for strengthening private ownership
A diversified, competent ownership can help boost value creation; see chapter 2. With this in mind, the government has an objective of strengthening private ownership in Norway and organising policies to make it more profitable to establish businesses, work, save and invest. Over time, more new private enterprises and more private owners will contribute to the government’s objective. The government also aspires to reduce direct state ownership over time, which may help boost private ownership. The government will make it possible for everyone to save and invest and, through their ownership, participate directly in and reap the rewards of value creation that takes place in Norway. The objective is increased value creation and more secure and productive jobs.
The government seeks to conduct a forward-looking policy that facilitates value creation and employment in the Norwegian economy. It is the employees’, the companies’ and the owners’ ability to restructure and innovate that has made the companies competitive. The government will facilitate the continuation of this trend through predictable and advantageous framework conditions. This will help business and industry to achieve good competitiveness and the potential for more value creation.
It must also be attractive for foreign investors to invest in Norway. Foreign owners contribute to competent, diversified ownership and a value-creating interaction between companies and owners. They may also boost knowledge transfer and expertise among Norwegian companies and private owners. It is therefore beneficial that foreign companies and investors want to invest in Norway, which is reflected, for example, in the high level of shareholdings of foreign investors on the Oslo Stock Exchange, at around 37 per cent. This shows that Norwegian employees, owners and industries are competitive.
For the foreseeable future, Norway will retain considerable direct state ownership. How the state conducts itself as an owner is important for the public’s and investors’ confidence in Norwegian companies and in the Norwegian capital market. The government will therefore conduct its state ownership policy in a responsible manner that provides space for and contributes to both diversity of ownership and value creation. Professionalism and transparency in state ownership are factors that may help strengthen confidence in the Norwegian capital market and improve the preconditions for private ownership.
4.3.1 Framework conditions
Sound and predictable framework conditions are crucial for business and industry and economic value creation. Company start-ups and investments are often risk-prone and long term in nature. Sound, predictable framework conditions can reduce the risk of such decisions in general and reduce capital costs in particular, and thereby increase access to capital. Good framework conditions make Norway an attractive country for business investments among both Norwegian and foreign private owners.
The government’s business policy is to be forward-looking and contribute to the greatest possible overall value creation in the Norwegian economy. The policy shall facilitate both restructuring and innovation. Over time, the ability to restructure and innovate will contribute to efficient resource utilisation. This means that resources such as labour and capital are employed where they are expected to yield high returns. This in turn will provide a sound economic basis for greater welfare.
The government is working in many policy areas in order to create a framework which, as a whole, enhances the ability to restructure and innovate, and hence improve competitiveness in the Norwegian economy. Key to this work are the economic policy, the Norwegian model which offers people security, including in the event of restructuring, and efforts to maintain well-functioning markets.
In its policies, the government will emphasise that what is most important for ensuring healthy economic growth in Norwegian business and industry is for the general economic policy to contribute to sound, stable and predictable framework conditions. The policy must therefore be structured so as to promote predictable and healthy trends in prices, wages, interest, exchange rates and tax levels. This will also reduce uncertainty in the economy. General framework conditions benefit all entrepreneurs, companies, employees and owners; they facilitate desired restructuring and innovation, more effective markets, including the capital market, well-functioning competition, strengthened private ownership and more value creation.
The key to competitiveness is the overall framework and its effect on the ability to restructure, innovate and create value. This should therefore be viewed in context. The key framework comprises a predictable and effective tax system, effective infrastructure, opportunities for research and innovation, facilities for entrepreneurship, access to skilled labour and access to capital.
The policy should be designed to make the costs of restructuring as low as possible. Public policy instruments should facilitate changes in corporate structure and production that yield better profitability. If business subsidies, protection from international competition, use of market power or protective regulations prevent continued and profitable restructuring and innovation, the restructuring processes may subsequently be far more costly to society.
From a business policy standpoint, it is desirable above all to reduce those taxes that most inhibit value creation. However, account should be taken of what the tax revenues are used for. Some of the tax revenues are employed on growth-promoting measures which also benefit business and industry and the establishment of new enterprises. Examples of this are the education system which creates skilled labour; research initiatives which provide access to new knowledge in Norway and from abroad; investment in entrepreneurship which contributes to the realisation of ideas as new goods and services; investments in transport which provide access to markets; and the welfare state which provides security for people and looks after those who bear the costs of restructuring.
4.3.2 Tax
The tax system is a crucial economic framework condition of great significance for Norwegian business and industry and for private ownership. The government seeks to use the tax and duties system to finance public goods, facilitate social mobility, achieve more efficient utilisation of resources, create better conditions for Norwegian business and industry and strengthen private ownership. It must be profitable to work, save, invest, and start up, operate and develop companies.
In order to achieve this, the tax system must be structured efficiently, and unnecessarily complicated rules which entail extra costs for tax payers and the Norwegian Tax Administration should be avoided. A broad tax base of low tax rates offers more effective use of resources and lower costs to society through taxation than higher rates on a smaller tax base. Special schemes in the tax system aimed at specific types of investments, sectors or industries reduce the tax base and hence tax revenues, and may come at the cost of general growth-promoting tax reductions. This will reduce the overall return on capital and labour. Broad-based and diversified business and industry benefit from wide-ranging tax breaks. The tax system thereby helps strengthen the basis for private ownership and, through this, higher overall value creation in the Norwegian economy.
The government took the first step in growth-promoting tax reductions in the national budget for 2014. Total tax reductions in the adopted budget came to in excess of NOK 7 billion. The general tax rate for individuals and companies was reduced to 27 per cent, the wealth tax rate was reduced to 1 per cent, while the minimum allowance was increased to NOK 1 million, and inheritance tax was abolished.
Lower taxes on ordinary income for individuals and companies help make the economy more expansive because they increase the return on working, saving, investing and setting up, running and developing companies.
A lower wealth tax rate reduces the importance of the low taxable value for housing and other real estate. This allows for a greater proportion of savings to be channelled into investment in business and industry. The return on overall savings increases, and private Norwegian ownership is strengthened. A lower wealth tax may also reduce any liquidity difficulties among private Norwegian owners caused by taking out dividends from a company in order to finance the wealth tax. In addition, in the long term, some of the loss of revenue in income and wealth taxes will be replenished due to more efficient use of resources.
The inheritance tax was a challenge at generational changes in family companies. The removal of this tax has therefore been long-awaited in this segment of Norwegian business and industry in particular. It facilitates the change of ownership in family companies. The abolition of inheritance tax from 2014 onwards will ease the liquidity burden in the case of generational changes, simplify taxpayers’ obligations and reduce the Norwegian Tax Administration’s administrative costs. The change may strengthen private ownership due to more capital remaining in the hands of private individuals and family companies.
Through the Skattefunn scheme, business and industry receive an extra tax allowance for research and development (R&D) costs. R&D can bring new knowledge and provide access to knowledge generated abroad, and thereby contribute new insights and ideas to entrepreneurship and innovation in new and established businesses. This can generate economic growth through new and improved goods, services and processes. The government aspires to stimulate an increase in R&D in business and industry, and in the 2014 national budget substantially reinforced the Skattefunn scheme. The changes as of 2014 entail increased options for tax allowances for businesses using the scheme. This should stimulate increased R&D investment by reducing companies’ R&D costs. Increased R&D investments may help strengthen private ownership by allowing innovation to spur the growth of new activities in new or existing companies.
The corporate tax rate is a significant part of a company’s financial framework conditions, and may be significant for where companies are located. In an increasingly more globalised economy, companies are more likely to move between countries than they were previously. The corporate tax rate in Norway should therefore not be significantly higher over long periods than the rates in our neighbouring countries. In recent years, several of our neighbours have reduced, or decided to reduce, their corporate tax rate; see figure 4.1. A high corporate tax rate in Norway compared with other countries will make it less attractive to invest in Norwegian business and industry, and increase the risk of Norway losing some of its tax base due to tax planning.

Figure 4.1 Corporate tax rates in selected countries. Per cent
Source Ministry of Finance and International Bureau of Fiscal Documentation.
The reduction of the corporate tax rate to 27 per cent was a first step in the necessary adaptation of corporate tax to international developments. There may be a need for further tax reductions in order to strengthen the general framework conditions for business and industry in Norway, and make the Norwegian tax base more robust. The Scheel Committee has been asked to assess this in more detail. The Committee will submit its proposal for changes in the autumn of 2014. Because the government wishes to reduce the tax and duty level, the Ministry of Finance has asked the Committee to also assess alternatives that produce net tax reductions. A reduction in the corporate tax rate will make it more attractive to invest in business, and thereby help to strengthen private ownership in Norwegian business and industry.
The government will use the national budget in the years ahead to implement further tax changes to stimulate saving, business activity, private ownership, investment and entrepreneurship. The government will work for a simpler, more growth-promoting tax system and will continue to prioritise tax cuts that enhance Norwegian competitiveness, private ownership, and secure productive and value-creating Norwegian jobs. The government will also assess other measures to strengthen private ownership, including measures to increase private savers’ ownership of Norwegian companies and measures to stimulate employee ownership.
4.3.3 Other measures
The work on simplifications for business and industry and private individuals is a key area for the government. This may help businesses and owners spend fewer resources on reporting and purchasing of administrative services. This will make it easier to start up and run a business in Norway. The government aims to reduce the annual cost to business and industry of complying with statutes and regulations by NOK 15 billion by the end of 2017, compared with the cost level in 2011, which represents a reduction of 25 per cent. Such measures will help reduce companies’ capital requirements and benefit new and small enterprises in particular. This may spur increased investment and strengthen private ownership.
The government will work for increased entrepreneurship, which will also help new knowledge to be employed in new goods, services and processes in existing and new enterprises. Through the public funding agencies, the state can provide advice and financing, and facilitate the use of knowledge, expertise and networks for new ideas, innovations, new business and internationalisation. By reducing the risk for private investors, in some cases, public capital can make it easier for start-ups and other companies to obtain further private capital and thereby stimulate private ownership.
Public measures must often be financed through increased tax revenues, which may represent a loss of efficiency. It is also important that public funding does not displace private capital, reduce diversity of ownership, create adverse incentives, tie up resources in unprofitable activity or reduce the expected return on investments. One consequence of excessive public schemes may be that companies do not gain access to the expertise that may accompany private investment. It is therefore crucial for the state, as for private investors, to be aware of where the input provides the greatest value creation and how public funding can be used to stimulate private ownership. The government will review the funding instruments and work towards an accurate and comprehensive public funding system. The goal is a more effective use of resources and better impact from the business-targeted funding.