2 The Norwegian Shelf in change
The petroleum sector is Norway’s largest industry, measured in value creation, revenues to the State and export value. The industry currently contributes about one-fifth of the total value creation and one-fourth of the State’s revenues. Half of Norway’s export value consists of oil and gas. The petroleum industry currently employs about 43 000 people, while more than 200 000 jobs are directly or indirectly linked to the activities on the shelf.
Since the beginning almost 50 years ago, the oil and gas industry has created values totalling around NOK 9000 billion, expressed in current worth. No other Norwegian industry or sector can compare with the petroleum activities when it comes to value creation, revenues to the State or export value. Value creation in the oil and gas industry is 2.5 times that of land-based industry, and about 15 times the total value creation in the primary industries, cf. Figure 2.1. A large part of the value creation in the petroleum industry is linked to economic rent from the petroleum deposits.
Oil and gas are non-renewable resources. After 40 years of production, the Norwegian Shelf still has a significant resource potential. The remaining resources form the basis for vigorous activity on the Norwegian Shelf for decades to come.
The petroleum resources are owned by the State, which means that a large portion of the revenues from the activities must go to the greater community. The State’s net cash flow from the petroleum activities is transferred to the Government Pension Fund – Global. At the end of 2010, the market value of the fund was about NOK 3000 billion.
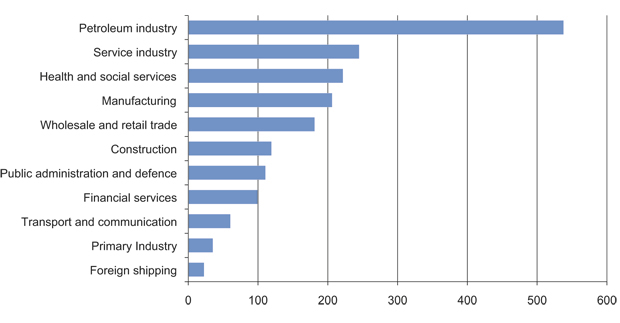
Figur 2.1 Value creation for selected sectors in 2010, in billion NOK. The value creation in the petroleum sector is very high because the resources that are proven and produced are of high value, also called economic rent.
Kilde: National accounts, Statistics Norway.
Some projects in the oil and gas industry are of formidable size, with Snøhvit, Ormen Lange and Langeled being some recent examples. The scope of investments in the further development of the Ekofisk area alone, approved by the Storting (Parliament) in the spring of 2011, is NOK 65 billion. This type of project receives great attention and somewhat overshadows the many smaller projects on the Norwegian Shelf. Even these smaller and less well-known development projects on the shelf are large in a Norwegian industrial context. Very few industrial projects on the mainland can compare to the offshore projects as regards value creation, State revenues or export value. Marulk and Gaupe are examples of such smaller developments.
Today, the oil and gas activities are in a different phase than was the case ten years ago. During the last ten years, exploration activity has increased, the opened areas on the shelf have matured and producing fields have become older. Both cost levels and oil prices have shown significant increases. The player scenario is much broader.
Parts of the shelf constitute well-established petroleum provinces, including large parts of the North Sea, parts of the Norwegian Sea as well as the area near Snøhvit in the Barents Sea. We have several fields in the North Sea and parts of the Norwegian Sea that have produced for quite some time, and they still have considerable remaining resources. Substantial undiscovered resources are also expected in the areas near these fields. Proper cost control and greater focus on new drilling methods, new drilling technology and new production solutions can allow recovery of a larger percentage of the resource base, thus curbing the decline in oil production from the old fields and extending their lifetime.
It terms of petroleum deposits, other parts of the shelf are less-explored, or not explored at all. Recent years’ exploration in less mature areas has not lived up to our expectations. The discovery of Skrugard in the Barents Sea is a recent exception. New exploration areas are needed in order to contribute to maintaining production and value creation on the Norwegian Shelf after 2020. The Ministry has initiated an opening process for the waters around the island of Jan Mayen, and will also initiate an opening process for the southern part of the previously disputed area west of the delimitation line in the Barents Sea. This will lay the foundation for access to new exploration areas. The Ministry will also conduct acquisition of knowledge in the northeastern Norwegian Sea.
The potential on the Norwegian Shelf is still significant, particularly if we are able to extract more of the resources in place by implementing measures that can yield improved recovery from existing fields, develop discoveries and prove more of the undiscovered resources.
2.1 The resource base
There is no way to accurately predict exactly how much oil and gas can be produced from the Norwegian Continental Shelf. Considerable uncertainty is associated with factors such as geology, reservoir conditions, technology and knowledge development, costs and commodity prices.
The Norwegian Petroleum Directorate’s resource accounts provide an overview of the expected total recoverable petroleum resources, including undiscovered resources. The resource accounts are based on data reported by the operating companies, as well as the Directorate’s own data.
The resource accounts include all areas on the Norwegian Continental Shelf, with the exception of areas where the available data is not good enough. This applies to that part of the previously disputed area that lies west of the delimitation line with Russia and the continental shelf around Jan Mayen. Other areas that are not currently open for petroleum activities are included in the resource accounts.
The resource base and the assessments of the resource base change over time. Resources are matured through several phases, finally ending in production. New knowledge about geology and reservoir conditions changes the assessment of the resource base. The current picture of the resource base is considerable different than the picture we had just ten years ago, cf. Figure 2.2. The estimate for undiscovered resources, particularly gas, was reduced in 2011.
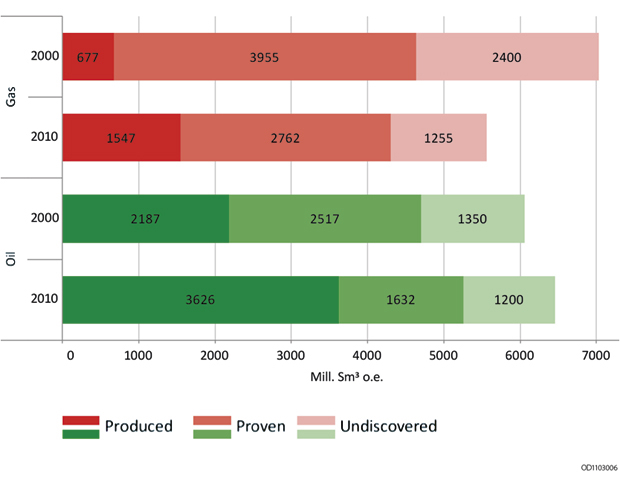
Figur 2.2 Development of the statistical expected value of recoverable resources, status as of 31 December 2000 and 31 December 2010. Oil does not include condensate and NGL.
Kilde: Norwegian Petroleum Directorate.
At the end of 2010, the total recoverable resources are estimated at between 10 and 16 billion scm of oil equivalents (o.e.)1, with 13 billion scm o.e. as the expected value. A total of 5.5 billion scm o.e. has been produced, which means that about 40 per cent of the expected recoverable resources have been produced to date.
There is great uncertainty associated with these estimates. If we use the figures in the lower or upper parts of this range of uncertainty, we have so far produced about 50 and 30 per cent respectively, of the total recoverable resources. This does not take into account the resources in that part of the previously disputed area that lies to the west of the delimitation line with Russia, or in the waters around Jan Mayen.
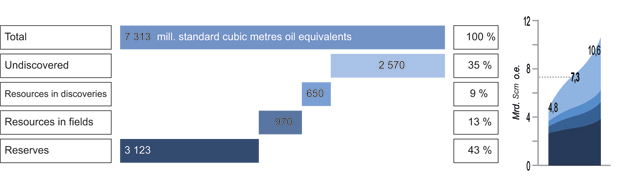
Figur 2.3 Total remaining petroleum resources (liquid and gas) distributed by resource categories (left). The figure on the right shows the uncertainty associated with remaining volumes.
Kilde: Norwegian Petroleum Directorate.
The basis for future activity lies in fields, discoveries and undiscovered resources. The Norwegian Petroleum Directorate’s estimates show that proven resources so far are almost as large as what has already been produced. Most of the proven resources are found in existing fields, but some are also linked to discoveries that have not yet been developed.
Of the expected remaining recoverable resources, about 55 per cent are in existing fields, 35 per cent have not yet been proven, and 10 per cent are in discoveries that have not been developed, cf. Figure 2.3.
Today’s approved plans indicate that more than half of the original oil on the Norwegian Shelf will be left in the ground after fields are shut down. The potential entailed by additional recovery from current fields is thus quite large. This is linked both to extracting resources planned in existing projects (reserves) as well as new measures on the fields (resources in fields). At the same time, achieving annual production ambitions is proving challenging on a number of fields. How to realise the potential in these fields is an important topic in this White Paper.
At the beginning of 2011, there were 100 undeveloped discoveries on the Norwegian Shelf. These discoveries are quite diverse in size, from very small discoveries to larger discoveries containing up to 40 million scm o.e. Analyses show that even it takes time, profitable discoveries are being developed. Important reasons for this include uncertain profitability (particularly related to the resource base and costs), technical challenges and insufficient marketing opportunities for gas. More than half of the resources in these discoveries are gas.
About a third of the expected remaining recoverable resources are not yet proven. The estimates for undiscovered resources are based on analysis of play models. These models are defined on the basis of geological knowledge. The estimates are associated with great uncertainty, particularly in areas where there is limited knowledge about the subsurface. Exploration drilling is necessary in order to clarify both the potential for petroleum deposits in an area, and in order to make new discoveries.
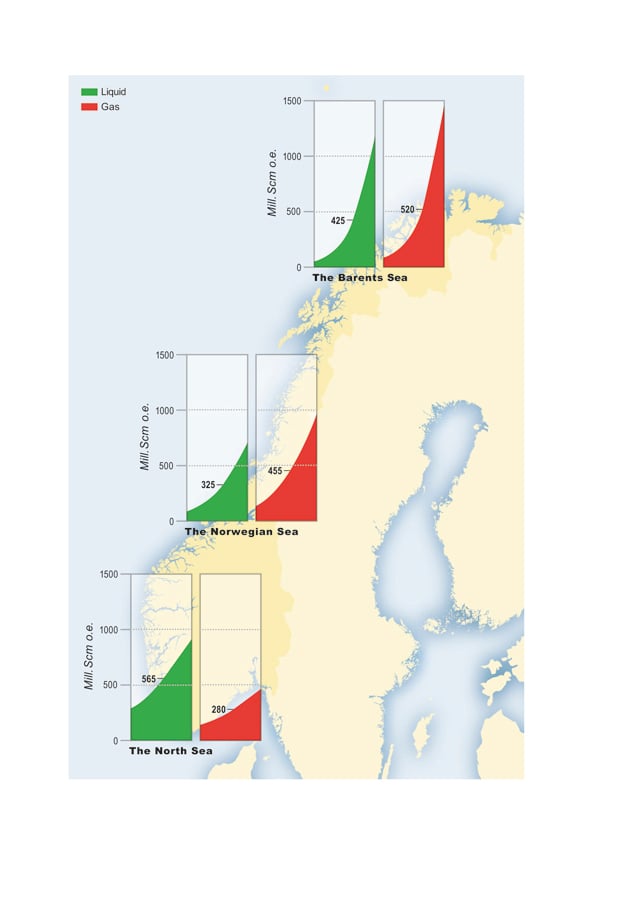
Figur 2.4 Undiscovered resources distributed by area. The number in each column shows the expected recoverable volume, while the uncertainty in the estimate is shown by the diagonal line.
Kilde: Norwegian Petroleum Directorate.
The Barents Sea contains large areas with little data and no exploration wells, thus making the uncertainly particularly high. Based on current knowledge, it is estimated with 90 per cent certainty that there are between 175 and 2460 million scm o.e. of undiscovered recoverable oil equivalents in the Barents Sea.
The knowledge base in the Norwegian Sea varies from good to limited. Resource estimates for the Norwegian Sea indicate with 90 per cent certainty that the area contains between 260 and 1580 million scm o.e. of undiscovered recoverable oil equivalents.
The best knowledge base on the Norwegian Shelf is in the North Sea, where many wells have been drilled and the geology well-known. Therefore, less uncertainty is linked to the estimates of undiscovered resources in the North Sea. Even though the area is well-explored and many major discoveries have been made, the North Sea still has considerable potential. The resource estimates for the North Sea indicate with 90 per cent certainty that between 470 and 1305 million o.e. of undiscovered recoverable oil equivalents is still present.
Boks 2.1 Consultation
In its declaration, the Norwegian Government stated its intention to review petroleum policy in a dedicated white paper. On 30 November 2009, then Minister of Petroleum and Energy Terje Riis-Johansen signalled the start of the work on the white paper at a consultation council meeting in Stavanger and a visit to Bergen Group Rosenberg.
The council in Stavanger was the first in a series of twelve such meetings held throughout the country; in Stavanger, Kristiansund, Grenland, Arendal, Sandnessjøen, Harstad, Kongsberg, Sogn og Fjordane, Bergen, Hammerfest, Trondheim and Oslo. The purpose of the councils was to obtain input for the white paper. At these events, the cabinet minister, other political leaders and government officials met with representatives of the supply industry, oil companies, employees in the oil industry, local and regional politicians and organisations. Important topics raised at the councils included future prospects for the Barents Sea, the need for new solutions on the Norwegian Shelf, improved recovery, the importance of research and development, spin-off effects and development of petroleum clusters. An attempt has been made to include the input from these events in this White Paper.
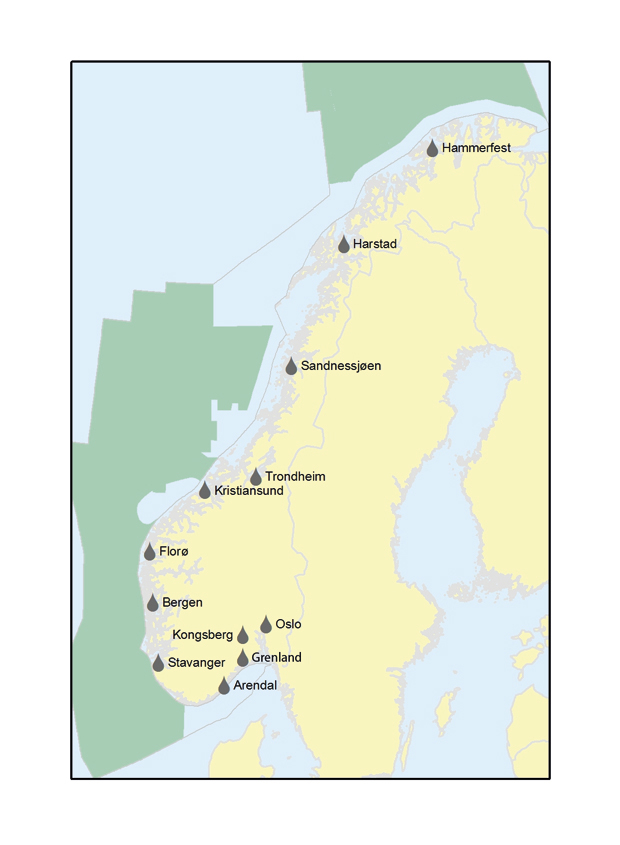
Figur 2.5 Consultations.
Kilde: Ministry of Petroleum and Energy.
2.2 Activity level
2.2.1 Production
Since the petroleum activities in Norway started nearly 50 years ago, the industry has experienced economic fluctuations and shifting oil prices. While there have been downward business cycles, the sector has largely been characterised by growth and increasing production.
The first acquisition of seismic data started in 1962 and the first exploration well was drilled in 1966. The discovery of Ekofisk in 1969 proved the existence of very significant oil deposits on the Norwegian Shelf. A number of large, commercial discoveries were made through the 1970s, thus establishing the foundation for the Norwegian petroleum industry. Many large discoveries were also made in the 1980s, while a number of discoveries made in the 1970s were developed. Production more than doubled during this period. The last part of the 1990s was characterised by flattening oil production, along with sharp growth in gas exports. Oil production peaked in 2001, while total production was at its highest level in 2004, cf. Figure 2.6.
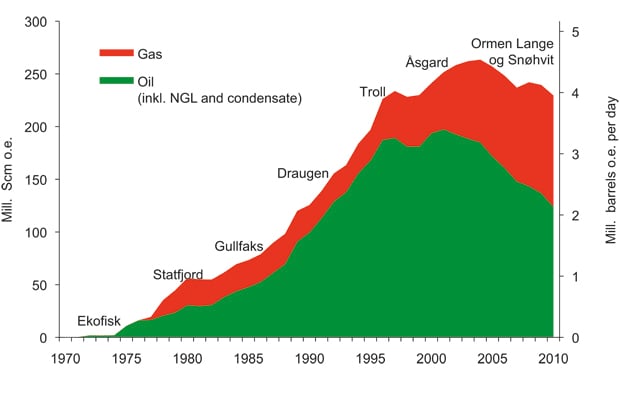
Figur 2.6 Production development on the Norwegian Shelf.
Kilde: Norwegian Petroleum Directorate.
Oil production has declined since 2001 and the gradual drop in oil production is expected to continue, cf. Figure 2.7. By increasing our commitment to more production from existing fields and development of existing and new discoveries, we can limit this decline in the short and intermediate perspective. In a long-term perspective, the number and size of new discoveries is crucial for the production level.
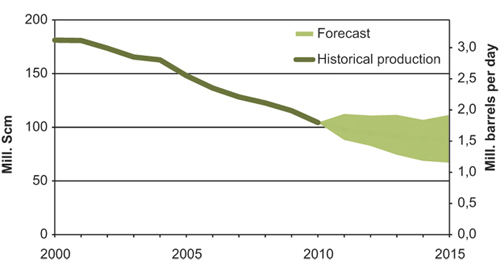
Figur 2.7 Oil production from the Norwegian Shelf.
Kilde: Ministry of Petroleum and Energy and Norwegian Petroleum Directorate.
Gas production is expected to peak around 2020, cf. Figure 2.8. At that time, annual gas production is estimated at between 105 and 130 billion scm o.e. The production level after 2020 will largely be determined by the new discoveries made in the years to come.
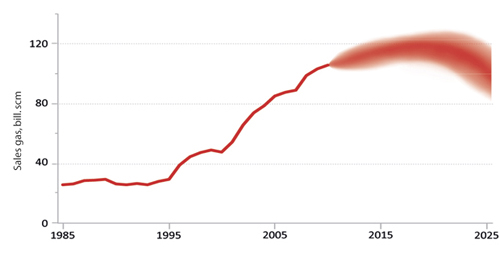
Figur 2.8 Gas production from the Norwegian Shelf.
Kilde: Ministry of Petroleum and Energy and Norwegian Petroleum Directorate.
2.2.2 Exploration activity
A number of large discoveries were made on the Norwegian Shelf up to the mid-1980s. Ormen Lange, discovered in 1997, is the last major discovery made. This is reflected in resource growth over time, cf. Figure 2.9. As it is common for the companies to first explore the areas that are expected to be most prospective, the largest discoveries are usually proven in the early stages after an area is opened. Rapid development followed by levelling off is a normal development trend for resource growth in petroleum provinces.
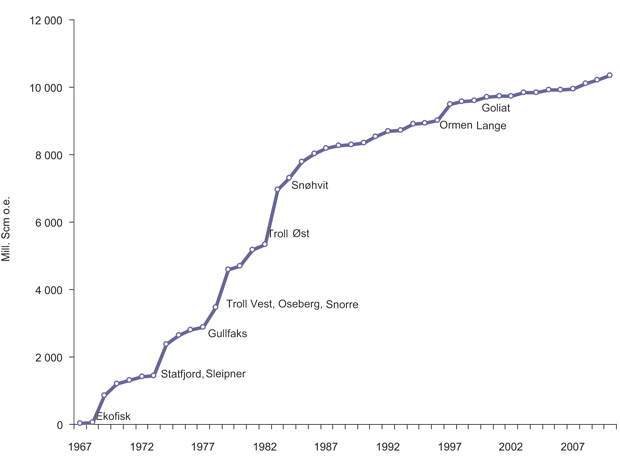
Figur 2.9 Resource growth over time.
Kilde: Norwegian Petroleum Directorate.
The numbered licensing rounds are designed with a view towards areas where there is limited geological knowledge, and where stepwise exploration is expedient. The first licensing round was carried out in 1965. Area has been awarded through 21 numbered licensing rounds, with licenses awarded in the 21st round in the spring of 2011.
Exploration of less mature areas in the Norwegian Sea in recent years has not lived up to expectations. However, the Skrugard discovery has created new optimism in frontier areas in the Barents Sea. The discovery opens up a new oil province that could provide additional resource growth. The Norwegian Petroleum Directorate’s analyses show that there are good chances of making discoveries in frontier areas both in the Norwegian Sea and in the Barents Sea. There has been a broad interest in recent licensing rounds.
For mature areas, where the level of knowledge is more extensive, stepwise exploration is less important. Therefore, changes were made in Norwegian exploration policy to facilitate increased exploration activity in mature areas. These changes were made along three main lines: increasing access to acreage in mature areas, facilitating more efficient exploration of areas in part through stricter work commitments, as well as bringing in new companies.
The system for awards of licenses in pre-defined areas (APA) was an important measure introduced in 2003. The APA system is based on experience gained through the numbered licensing rounds. The main difference is that fixed, pre-defined exploration areas were established in mature parts of the shelf. These areas are subjected to an annual licensing round, thus laying the foundation for improved predictability and profitability in mature areas. In 2005, adjustments were made in the tax system which secured companies in and outside tax position equal tax treatment with regards to exploration costs. This has contributed to ease financing of exploration activity for new companies.
The measures that were implemented have yielded results. Interest in mature acreage has been high, and there has been a substantial increase in the number of production licenses awarded. The number of exploration wells has risen sharply and a number of discoveries have been made. The activity has been profitable and the net present value of proven resources in the period 2000–2010 is estimated at around NOK 700 billion. This illustrates that the changes made in exploration policy in the 2000s were successful, even though resource growth has been relatively low in a historical perspective, cf. Figure 2.9.
No new area has been opened on the Norwegian Shelf since 1994. There is a need to open new areas soon to contribute to maintaining production on the Norwegian Shelf after 2020. Therefore, the Government has decided to initiate an opening process for the waters around Jan Mayen and the part of the previously disputed area to the west of the delimitation line in the Barents Sea South.
2.2.3 Investment and employment
There has been a sharp increase in the investment level on the Norwegian Shelf in recent years, cf. Figure 2.10. The petroleum sector is responsible for about one-fourth of the total investments in Norway. The growth in investments can be attributed both to the high activity level as well as to significant cost growth. Investments linked to modifications and maintenance on fields in operation account for an increasing percentage of the total investments.
Cost growth slowed in 2009, with the global financial crisis, declining commodity prices and thus postponement of projects, all being important factors. Today, we again see signs of a rising cost level. This is cause for concern. Cost growth in the petroleum industry can have consequences for resource utilisation both from today’s fields and discoveries, as well as for proving resources that have not yet been discovered.
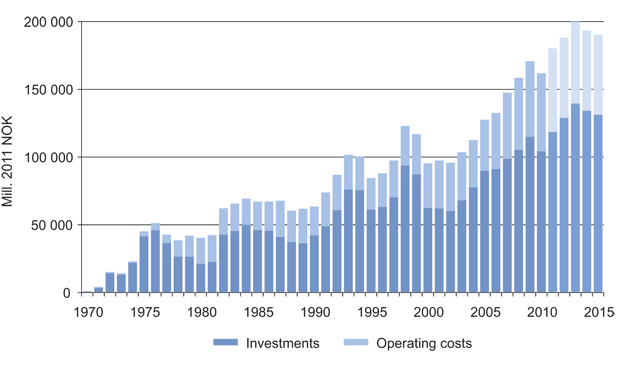
Figur 2.10 Historical investments and operating costs from 1971 to 2010 and forecast to 2015.
Kilde: Ministry of Petroleum and Energy and Norwegian Petroleum Directorate.
The petroleum activities create jobs throughout the country through oil companies, the supply industry, research and education institutions and other related activity. Employment in companies whose production mainly targets goods and services for the petroleum industry is around 43,0002. According to a report issued by Statistics Norway3, around 8 per cent of Norwegian employment, or more than 200,000 jobs, are directly or indirectly linked to demand from the petroleum industry.
Today, employment in the petroleum sector is spread throughout the country, but the main part of the activity is found in south-western Norway. The activity on land has largely followed the offshore activity. The activity level on the continental shelf is crucial to ensuring employment in the petroleum industry in the years to come. Through a broad commitment to exploiting the entire resource base, including measures to improve recovery rates on fields and facilitating new discoveries through effective exploration and licensing policies, we can achieve a high level of employment for decades to come. New regions of the country, such as Northern Norway, can experience renewed growth stimulus as a result of such a broad commitment.
Many employees in the petroleum activities work in the supply industry. This industry started growing along with the many deliveries of goods and services to the shelf activities. Today, the sector is composed of a great number of specialised companies with great variation as regards geographical location, company size and type of deliveries. The oil and gas sector has always relied on a competent and innovative supply industry. Tomorrow’s development solutions and technology will be different than what we have today. One notable development trend is that many of the smaller discoveries made today require less cost-intensive and more standardised solutions in order to achieve profitability. Furthermore, new solutions are needed in order to ensure that more of the resources in existing fields are profitable. The supply industry plays an important role in achieving this.
2.2.4 Revenues to the State
Revenues from the petroleum sector account for about one-fourth of the State’s total income. The cash flow from the petroleum activities is transferred in its entirety to the Government Pension Fund - Global. According to the fiscal policy guideline, the use of oil revenues over time shall be equivalent to the real return on the Government Pension Fund – Global. The guideline thus entails a gradual increase in use of oil revenues up to a level that can be sustained over a long-term perspective. The Government Pension Fund – Global is invested in financial assets outside Norway. The guideline and the management of the Government Pension Fund – Global is discussed in more detail in the annual national budgets and in reports to the Storting (Parliament) about the Government Pension Fund. Figure 2.11 shows the use of oil revenues and the market value of the Government Pension Fund - Global.
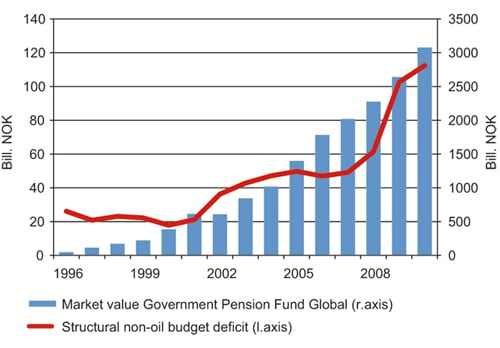
Figur 2.11 Structural, non-oil budget deficit1 and market value of the Government Pension Fund – Global over time.
1 Structural, non-oil budget deficit is a measure for oil revenues spent on the state budget. The State’s revenues are divided between ordinary tax, special tax, production fees, area fees and environmental fees, cash flow from the State’s Direct Financial Interest and dividend from Statoil.
Kilde: Ministry of Finance.
The basis of income from petroleum production is undergoing significant change. Since 2001, oil production on the Norwegian Shelf has been gradually reduced, while gas production has increased. The year 2010 marked the first time that more gas was sold than oil.
Prices achieved for oil have historically been higher than for gas, cf. Figure 2.12. The combination of reduced oil production, increased gas production and lower relative sales value for gas will impact cash flow from the petroleum activity. Income from the sector will fall more sharply than total production would indicate. Increased oil production will lessen this effect over the short and medium-term, while exploration and discoveries in new areas on the shelf can help maintain significant revenues, also over the long term.
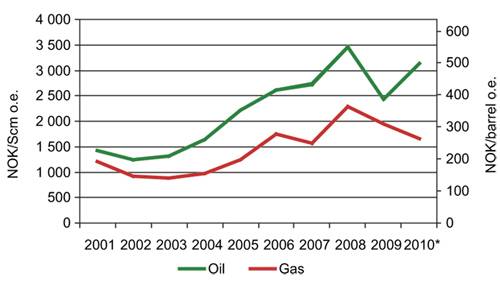
Figur 2.12 Average sales prices for oil and gas produced on the Norwegian Shelf. In current NOK.
Kilde: Statistics Norway.
2.3 Discharges to sea and emissions to air
The Norwegian petroleum sector is among the best in the world when it comes to environmentally friendly petroleum production. Norway’s leading position can among other be attributed to strong government regulation over many years.
Waste products are generated in connection with the petroleum activity, such as drilled rock mass (cuttings) and formation water (produced water). These discharges are subject to permits from the authorities. In 19974 a zero discharge target was established for the petroleum activities. The main rule is that no environmentally harmful substances may be released, neither added chemicals nor naturally occurring chemical substances that could harm the environment. In 2009, radioactive substances were also included in the zero discharge targets. The zero discharge targets is considered to be achieved for environmentally hazardous chemical additives5.
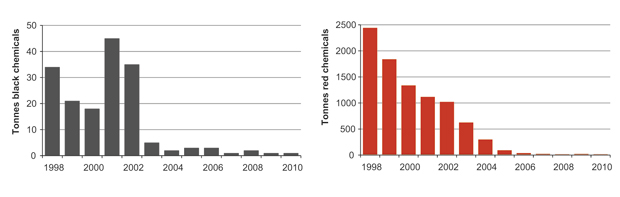
Figur 2.13 Development in discharges of black and red chemicals1.
1 Added production chemicals are divided into categories (yellow, green, red and black) depending on the potential hazard they pose to the environment. Chemicals in the green category are naturally occurring substances and do not entail damage or disadvantages for the marine environment. Chemicals in the yellow category are normally not defined as environmentally hazardous, while chemicals in the red and black categories may have serious environmental impacts.
Kilde: Norwegian Petroleum Directorate.
Production and transport of oil and gas are energy-intensive activities. Natural gas covers most of the sector’s energy needs, while an estimated 5 TWh per year is met through electricity from land to terminals and fields. Emissions to air from the petroleum sector largely consist of exhaust gas from the combustion of gas in turbines, burning gas via flares and diesel consumption.
Disposal solutions are required for associated gas on the Norwegian Shelf. Flaring is only allowed for safety reasons. The petroleum sector is subject to strict regulations as regards emissions to air. The sector was subjected to CO2 regulations at an early stage through introduction of the CO2 tax in 1991. Since 2008, the sector has also been part of the emission quota system for greenhouse gases, in addition to paying the CO2 tax. Rigorous policy instruments have triggered both inexpensive and relatively costly measures which have contributed to significant emission reductions. These regulations are one of the main reasons that the Norwegian Shelf is regarded as one of the world’s cleanest petroleum provinces. Cost-effective policy instruments are important to ensure a sensible balance between resource utilisation, value creation and consideration for the environment.
CO2 emissions from the Norwegian Shelf have increased from 10.8 to 12.6 million tonnes from 2000 to 2010, cf. Figure 2.14. As overall production is lower in 2010 than in 2000, CO2 emissions per produced unit have increased. This is due to a number of factors. Firstly, petroleum production is declining on late-phase fields while the energy need on these fields remains fairly stabile. Secondly, Norwegian petroleum production has become more gas-intensive and gas transport over long distances is energy-intensive.
Emissions of NOx have been reduced from 52,300 to 49,900 tonnes from 2000 to 2010. This has been achieved in part through the use of so-called low-NOx burners on certain fields. Emissions of nmVOC have been reduced from 222,000 to 37,000 tonnes in the same period. This has been achieved by developing and applying recovery technology in connection with loading and storing oil.
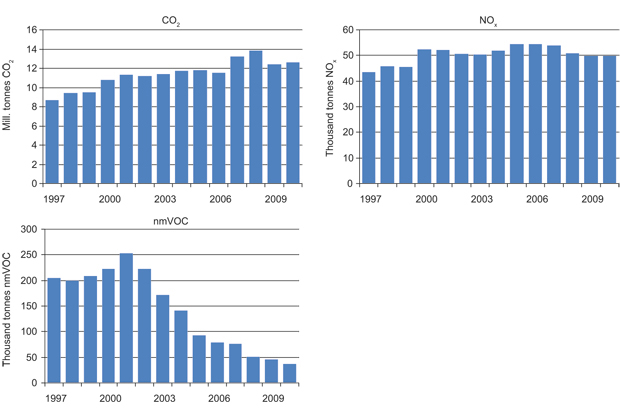
Figur 2.14 Development in emissions of CO2, NOx and nmVOC.
Kilde: Norwegian Petroleum Directorate.
2.4 Cost level and profitability
The petroleum industry has experienced significant growth in costs over the last decade. This growth has been even greater in Norway than in other comparable countries. High oil prices accompanied by all-time high investments and capacity utilisation in the supply chain have been key drivers of this development.
The International Energy Agency (IEA) has recorded a doubling of the international cost level during the period 2000–2008, cf. Figure 2.15. Accelerated cost growth was particularly evident after 2004, with an annual growth approaching 15 per cent. Analyses conducted by the consultant agency IHS CERA show a doubling of development costs in the period from 2004–2008. The price of factor inputs such as rigs, steel, labour and equipment are important explanatory variables. IHS CERA also points to a marked increase in operating costs in the 2004–2008 period, as a consequence of higher prices of factor inputs such as labour, energy and various consumables.
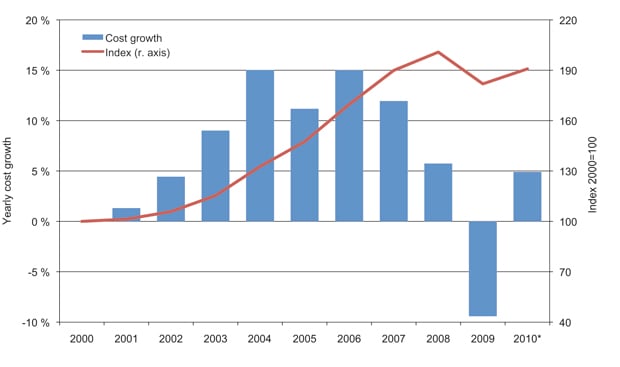
Figur 2.15 Global development in capital costs associated with exploration and development 2000–2010.
Kilde: IEA/WEO2010.
Costs are an important component when the companies assess whether new projects are profitable and can be carried out. Therefore, the long-term development of oil and gas prices necessary to make new developments profitable (the breakeven price) may be used as a measure for cost development. The breakeven prices in submitted plans for development and operation (PDOs) show a clear trend of higher development costs on the Norwegian Shelf since 2005, cf. Figure 2.16. While the breakeven price for new field developments in 2004 was around NOK 100 per barrel o.e., comparable prices in 2009 were more than NOK 300 per barrel o.e.. This represents a tripling of costs over a five-year period. There was a weak positive trend in the breakeven price for submitted development plans from 2009 to 2010.
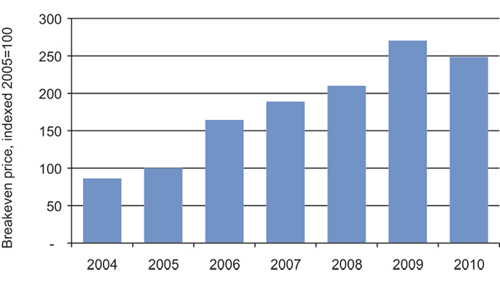
Figur 2.16 Volume-weighted breakeven prices for submitted plans for development and operation in the period 2004–2010.
Kilde: Ministry of Petroleum and Energy / Norwegian Petroleum Directorate.
The consultant firm Econ Pöyry has established a cost index for field development projects on the Norwegian Shelf which confirms this picture. Estimates for the period 2004–2008 show an average increase of 15 per cent per year. This trend continued through 2009, wherein the cost of completing a selected group of projects was 12.5 per cent higher than the previous year. Econ Pöyry points to the rig rates as an important driver in this cost development, with a near tripling of rig rates in the period 2004–20086. It is presumed that this trend was largely caused by factors in the rig market.
On assignment from the Ministry, the consultant firm Wood Mackenzie compared costs on the Norwegian Shelf with other relevant petroleum provinces for the exploration, field development and operations. The study confirms a higher cost level in Norway than in comparable countries. When comparing the Norwegian and the UK shelves, Wood Mackenzie found that both development costs and operating costs are more than 20 per cent higher in Norway than in the United Kingdom, cf. Figure 2.17. The difference is in part due to activity associated with production drilling, including the cost of hiring rigs and drilling equipment. Higher prices for subsea services and process facilities also contribute to more expensive developments on the Norwegian Shelf. Taxes (CO2 and NOx) also contribute to higher operating costs. Costs associated with transport of oil and gas have not been part of the study.
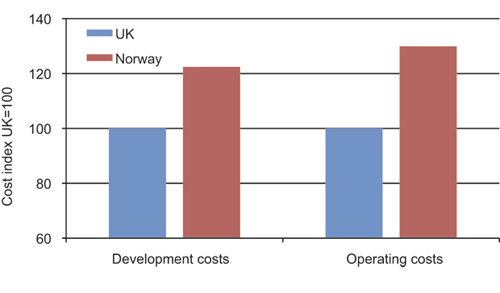
Figur 2.17 Development costs and operating costs for fixed platforms and FPSOs in Norway and the United Kingdom1. Includes projects under development or fields that started production after 2000.
1 Two fields in the selection were developed using semi-submersible production facilities. FPSO (Floating production, storage and offloading) is a type of multi-purpose facility.
Kilde: Wood Mackenzie.
Norway also emerges as a high-cost country when it comes to exploration activity, cf. Figure 2.18. The cost of drilling exploration wells on the Norwegian Shelf in waters shallower than 400 metres are about 85 percent higher than on the UK Shelf and 35 per cent higher than on the Brazilian Shelf. Hiring of rigs and associated personnel, field evaluation and other administration are the most important explanations for the cost differences.

Figur 2.18 Exploration cost per well in water depths less than 400 metres. 2000–2009.
Kilde: Wood Mackenzie.
According to the IEA, the financial crisis and sharp drop in oil prices caused global investments in the petroleum industry to fall by 15 per cent in 2009. Upstream costs declined by 9 per cent over the course of the year. The situation in the first half of 2011 is different. Estimates provided by consultant firms, oil companies and the authorities all indicate that the industry is facing another period of record-breaking investments and activity level. Given the current cost level on the Norwegian Shelf, it is important that the players in the industry work together to achieve cost savings. Cost control is essential if we are to exploit the potential on the Norwegian Shelf. Marginal projects and late-phase projects on fields are threatened by high costs. The industry has implemented many good initiatives to keep cost development under control. However, stronger measures are needed if we are to realise the significant remaining resource potential on the Norwegian Shelf. Smarter and more efficient organisation, while also complying with the current regulatory framework, can yield considerable cost savings within all types of petroleum activities, and thereby create significant added value both for the Norwegian society and for the players themselves. The authorities must also contribute to cost control and the Government is implementing several measures. See Chapter 4 for a review of these measures.
2.5 Diversity of players
The paramount goal of the petroleum activity is to facilitate profitable exploitation of the oil and gas resources. A diversity of players and appropriate competition in all aspects are important contributions towards achieving this goal, and the Government will facilitate this.
Up until 2000, the player scenario on the Norwegian Continental Shelf was dominated by Statoil, Norsk Hydro and the major international oil companies. This player scenario also reflected the technically and financially demanding tasks the industry faced in Norway in the first decades. This picture has undergone substantial change over the last 10–15 years. Towards the end of the 1990s, the price of oil was around USD 10 per barrel and the sector was characterised by consolidation. There were major mergers on the international stage, including companies such as Conoco and Phillips; BP, Amoco and Arco; Total, Fina and ELF; Chevron and Texaco; Exxon and Mobil. In Norway, the mergers included Hydro and Saga, while Shell took over Enterprise.
This consolidation had a direct impact on the player scenario on the continental shelf. The international companies became fewer in number and even larger in size. This happened at the same time that the Norwegian Shelf, particularly the North Sea, had become a well-established petroleum province with different opportunities and challenges than previously. These were business opportunities that many of the existing players on the continental shelf were not necessarily interested in pursuing.
The Norwegian authorities therefore implemented a number of measures to enhance value creation from mature areas. A key measure was to allow other companies to become licensees. Small and medium-sized oil and gas companies, along with foreign downstream companies, was established on the continental shelf, as did a number of new Norwegian companies, cf. Figure 2.19.
The fact that the player scenario changes along with the development on the shelf is positive. The Ministry wants to ensure that the player scenario reflects the challenges faced by the sector on the Norwegian Shelf, both in mature and less mature areas.
The presence of all the major international oil companies is unique to the Norwegian Shelf. These companies have extensive petroleum experience and unique expertise. They do business around the globe, and their main focus is often on exploring for and developing major projects, along with further developing their key fields and discoveries. Access to new areas on the Norwegian Shelf with the opportunity of making major discoveries will be important in ensuring that it remains attractive for these companies to participate on the Norwegian Shelf over time.
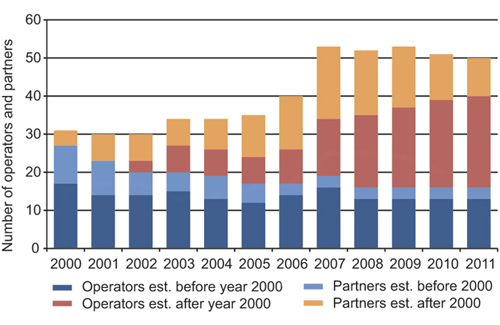
Figur 2.19 Number of operating companies and licensees divided between companies established before and after 2000.
Kilde: Norwegian Petroleum Directorate.
Competition and cooperation between companies with different expertise, different experience and different assessments of exploration, development and operation are important if we are to realise the greatest possible values from the oil and gas resources. This is why the activity on the continental shelf is organised under production licenses where several licensees work together. The licensees who are not the operator have a statutory responsibility to ensure that the operator plans and carries out the activity in a prudent manner, and to contribute to choosing the best solutions throughout the entire lifetime of the field. They must help the operator to do a good job by challenging all key choices made in the production license.
The operator is subject to stricter requirements than the other licensees. An operator must be capable of safeguarding all phases of the petroleum activity. It may take longer to mature operating companies than other licensees. The addition of more competent companies with operator ambitions is a desired development.
The development of player diversity on the Norwegian Shelf varies in the different phases of the activity. Licensee groups are put together when new licenses are awarded. The current ownership reflects historical awards as well as any subsequent transactions involving ownership interests.
2.5.1 The exploration phase
It is particularly important to have diversity in the exploration phase, in order to secure sufficient variation in geological assessments. There have been several examples where companies have made discoveries in relinquished area. This tells us that while one company may not believe a particular area is interesting, another company may see a business opportunity there. A diverse supply of geological assessments is necessary in order to prove as much of the resources on the shelf as possible. Diversity is particularly important in mature areas where phase-in of additional resources and small discoveries can be time-critical.
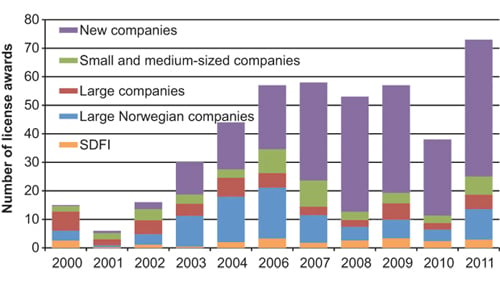
Figur 2.20 Award of ownership interests in production licenses, number distributed by company type 2000–20111, 2.
1 No award in 2005.
2 New companies since 2000 (4Sea Energy, Aker Exploration, Bayerngas Norge, BG Norge, Bridge Energy, Centrica, Concedo, Dana, Det Norske, Discover, DONG, Edison, Endeavour, Faroe, GDF SUEZ, Genesis, Lotos, Lundin, Mærsk, Marathon, Nexen, Noreco, North Energy, PGNIG, Premier, Repsol, Rocksource, E.ON Ruhrgas, Sagex, Skagen 44, Skeie, Spring, Talisman, VNG, Wintershall, Agora Oil & Gas). Small and medium-sized companies (AEDC, Hess Norge, Idemitsu, OMV, Petro-Canada, RWE-DEA, Svenska Petroleum), Large, international companies (BP, Chevron, ConocoPhillips, Eni, ExxonMobil, Shell, Total), Large, Norwegian companies (Petoro, Statoil).
Kilde: Norwegian Petroleum Directorate.
Since the new millennium, a number of new companies have been awarded production licenses on the Norwegian Continental Shelf. The new companies have been active applicants and have received many licenses, cf. Figure 2.20. These companies have been particularly active in the awards of mature areas on the shelf. Through license awards and transactions, these new players currently possess more than 55 per cent of the available license area, cf. Figure 2.21. These companies have received many licenses in the mature areas of the shelf.
Figur 2.21 Licensed area as of 1 May 2011, awarded after 2000.
Kilde: Norwegian Petroleum Directorate.
The large companies still play a key role in the numbered licensing rounds. The major established companies are important when it comes to exploring for and developing new discoveries in mature areas and in deep water. If we are to ensure that these highly skilled companies maintain an active presence over time, we must have an active exploration policy in areas where there is a potential of making major discoveries. Opening of new exploration areas is important in this respect.
The development in the player scenario shows that different types of companies emphasise different areas, and that the companies complement each other in a manner which allows us to ensure exploration of both mature and frontier areas.
2.5.2 The development phase
The oil and gas industry has long lead times. For a company that relies on organic growth, it can take years from award of an area until commercial discoveries are made and production starts. This situation is the same for both operating companies and partners. An alternative strategy for companies that want to build a portfolio faster, including possible operatorship, is to take over ownership interests in existing discoveries or fields. Substantial – and different – resources are required to develop a discovery into a producing field than are required for merely being active in exploration. It may take quite a long time before a newly-established company can take the step forward to the production phase. The strategy of many of the new companies is to sell their ownership interest in production licenses when discoveries are made to companies that possess greater expertise in development and operation, and have greater financial strength. These are among the main reasons why the Norwegian Shelf currently has fewer companies in the development phase than in the exploration phase.
The trend in the development phase is towards more companies and greater diversity. We are now seeing the results of the restructuring of exploration policy carried out around the new millennium. Today we have a great diversity of companies with projects undergoing development or in the late planning stages, cf. Figure 2.22. Operatorship of new, independent developments is divided among eight different operating companies. The largest development projects often demand the most from the operating company. Statoil operates the most satellite developments, which is a natural result of the fact that Statoil is the operator of many of the major fields currently in operation. There are also gains to be extracted in the development and operations phases by operating both satellite and host field. Five of the operators of fields under development or in the planning phase are newly established companies on the shelf since 2000. Six of the 14 companies that have projects under development or in the late planning stages are currently field operators today, while eight are new field operators in Norway.
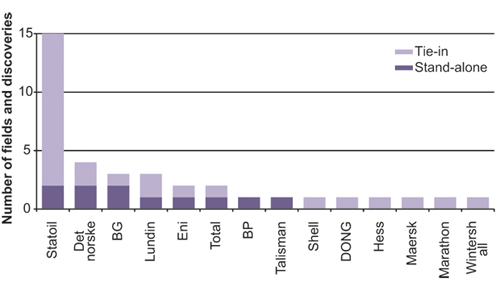
Figur 2.22 Operatorship of discoveries under development or in the late planning stages as of 2010.
Kilde: Norwegian Petroleum Directorate.
2.5.3 The operations phase
The operator has a special responsibility for developing the individual field. At the same time, the other licensees have a special duty, e.g. under the statutory supervisory duty, to follow up the operator and contribute their expertise to ensure optimal development and production of the fields, and to ensure that the activities are carried out in a prudent manner. The fact that the partners actively contribute in the licensee groups is an important part of the contract they have entered into through the production license.
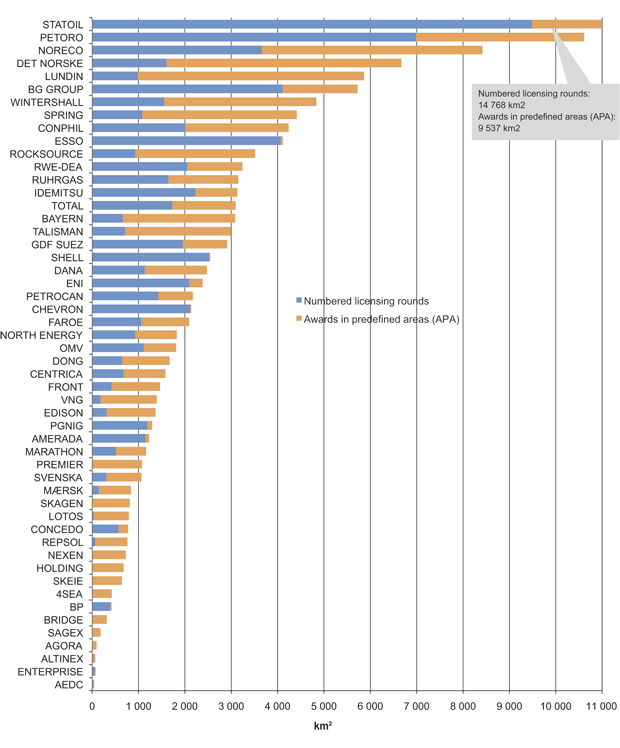
Ownership of the reserves on the shelf is distributed across a broad range of companies, cf. Figure 2.23. As regards oil, Statoil and SDFI account for about one-half of the ownership, with 30 per cent and 21 per cent, respectively. They are followed by the major international oil companies Total, ExxonMobil, ConocoPhillips, Eni and BP, each of which own somewhere between four and ten per cent. Overall, this group owns more than a third of the oil reserves. The last group comprises about 30 different companies which together hold 13 per cent of the oil reserves.
Ownership of the gas reserves is somewhat more concentrated, but follows the same general pattern as for the oil resources. SDFI represents 40 per cent of the ownership of gas reserves, while Statoil owns 35 per cent. A group of major international oil companies comprising Shell, Total, ExxonMobil, ConocoPhillips, GDF Suez and Eni each own more than one per cent, and together they own 20 per cent of the gas reserves. The remaining gas reserves are owned by a group comprising more than 20 companies which together own a total of five per cent.
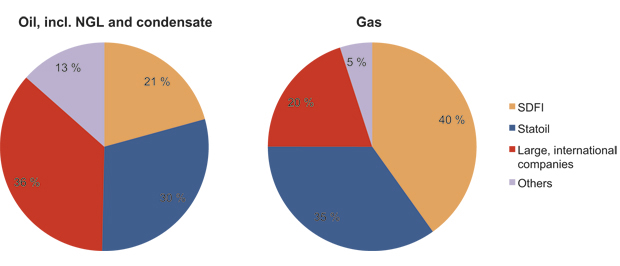
Figur 2.23 Ownership of the petroleum reserves divided by liquid and gas as of 31 December 2010.
Kilde: Norwegian Petroleum Directorate.
Statoil is currently the largest operator of producing fields on the Norwegian Shelf, cf. Figure 2.24. This is a consequence of the fact that the company was awarded a number of operatorships in the early years of the petroleum activity, including many of the major fields on the shelf. At the same time, Statoil has worked diligently to explore adjacent areas and to mature resources. This has contributed to many new field developments in recent years, particularly as regards satellite fields.
Statoil is a key player in the operations phase, although the number of operatorships alone does not provide the complete picture. There is a substantial difference between operating a small subsea tie-in and, e.g. a large field with many facilities, such as Ekofisk. Relatively speaking, ConocoPhillips has few field operatorships, but is the leading company when it comes to developing the southern part of the North Sea through its role in the Ekofisk area. Various operating companies have key tasks in different areas of the shelf. As mentioned, ConocoPhillips is the leading company in the south, while BP and Talisman also hold operatorships in the area. Marathon, Statoil and ExxonMobil operate fields in the central part of the North Sea, while Statoil plays a dominant role in the northern part of the North Sea. Shell has important operatorships on Ormen Lange and Draugen in the Norwegian Sea. Statoil operates many fields in the Norwegian Sea, while Eni and BP also operate fields in the area. In the Barents Sea, Statoil is the operator for Snøhvit, while Eni is the operator for Goliat.
The Norwegian Shelf depends on ensuring that large, competent companies also see attractive business opportunities within the petroleum activities here. These companies have the financial strength to explore relatively unknown areas, to develop new technology and to initiate and implement large and demanding developments. This is necessary if we are to realise the potential on the Norwegian Shelf.
Companies with strong operator and ownership interests in field clusters are responsible for, and benefit from, triggering economies of scale. Cost-efficient operation and development is a precondition for realising the potential in mature parts of the Norwegian Shelf. Most of the projects in mature areas are small and must be tied in to existing infrastructure. Rapid project progress and standardised development solutions will often be needed to ensure profitability in such projects.
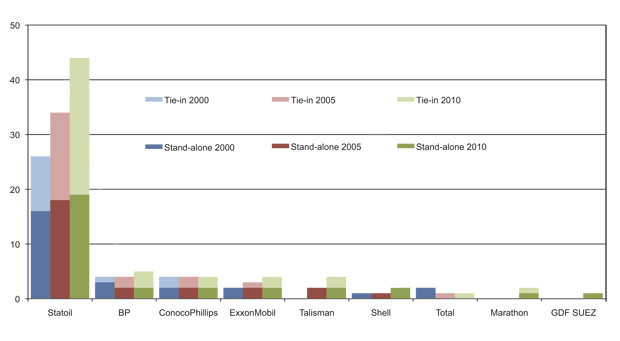
Figur 2.24 Operatorship of fields in operation as of 1 January 2000, 2005 and 2010. Mergers have been taken into account, e.g. the fields operated by Hydro in 2000 and 2005 are shown in the figure as Statoil.
Kilde: Norwegian Petroleum Directorate.
A joint operator of multiple fields facing the same challenges can make it easier to realise projects that require cooperation across several production licenses. A large operator also streamlines transfer of experience between fields. Such a structure is also a good way to make sure that lessons learned on one field also benefit other fields.
A large operator is well-served by maintaining competitive supply communities, which helps ensure good, reasonable and secure deliveries over the longer term. The supply industry also benefits from competition. Today, the Norwegian supply industry is among the best in the world. It has developed this position in part by succeeding in tough competition both in Norway and internationally.
The merger of Statoil and Hydro’s petroleum division meant that two strong groups were gathered in a single company. In its work on the report “Structural changes in the petroleum activities” in 2009, the Ministry laid the foundation for monitoring the consequences of the merger on the structure of the Norwegian petroleum industry, including how it would affect diversity among oil companies, suppliers and research communities.
Conducting this type of analysis is methodically demanding; and particularly demanding for an industry and a sector that has undergone major changes that are not related to the event one wishes to measure the effect of. To be relevant, such an analysis must be able to isolate the effects of factors such as the financial crisis, structural changes in the industry and fluctuations in oil and gas prices. The Ministry will consider whether it would be appropriate to conduct a new review of the effects of the merger.
The Ministry has no basis for saying that a consolidation of operatorships, such as the merger between Statoil and Hydro, has contributed to undermining performance of the operator’s role on the affected fields. However, these two companies both possessed unique depth, scope and expertise concerning the Norwegian Shelf, which both companies actively used to challenge each other. These two groups are now joined in a single company. Therefore, in certain partnerships, the merger has created a gap which the other licensees must fill. There is great diversity among the licensees on the shelf. The fact that different companies make independent assessments and challenge the operator in the respective production license is positive for resource exploitation. Ownership in fields reflects the companies’ financial exposure, and through the partnership, all licensees must contribute to good resource management, including good field operations. The Ministry has a clear expectation that licensees must make active contributions in their respective licenses, and intends to reinforce its efforts to ensure that this role is fulfilled.
Today’s structure for operating fields, with a number of licensees who are to contribute to challenge and drive the operator forward, combined with areas that have the same operator for several key fields, has many good qualities. This applies both to generating and implementing good ideas, as well as to extracting the benefits of cooperation and economies of scale between different fields.
2.5.4 The supply industry
From its modest beginning about 40 years ago, Norway has succeeded in developing a competitive petroleum-related supply industry. Today, this is a huge industry. Companies deliver advanced technological products and services to domestic and international markets. The industry consists of a significant number of large, medium-sized and small companies located in all of the nation’s counties. The supply industry is very dynamic. The individual companies position themselves through internal reorganisations, mergers and acquisitions. The supply industry has always had a substantial element of foreign ownership.
The oil and gas value chain can be roughly divided between exploration, development, operations/modifications and removal. There are market segments in each of these categories where the Norwegian supply industry occupies good positions. For example, exploration includes seismic surveys and drilling, which is a huge market for shipowners and companies that acquire and interpret geological data. Field development includes engineering, construction of platforms and facilities, as well as installation work. Operations include activities such as drilling and well services as well as operations and maintenance tasks, and sometimes also major modifications.
A consolidation has taken place in the supply industry within field development. Several competing environments in Norway are important to ensure that companies located in Norway can succeed in the competition for such assignments. With the acquisition of Kværner, Aker Solutions ASA became the largest Norwegian main contractor for turnkey field development contracts. It has been decided that large parts of Aker Solutions ASA’s field development activity shall be split off as a separate listed company, Kværner ASA, from the summer of 2011. Aibel can also carry out relatively large development projects, and has a well-developed supply chain for implementing such development projects. There are also other suppliers with the capacity to be main contractors, but these companies normally pursue smaller or medium-sized projects, or enter into an alliance with others. Examples of such field development suppliers include Bergen Group, Grenland Group, Apply Group, Reinertsen, Fabricom and Nymo.
The operations and maintenance market is central in the production phase. Here the oil companies need a wide variety of deliveries, and here too, the main contractors are important players. With a growing number of fields in production and many fields in a mature phase with declining production, this has become a large market. Several suppliers have achieved a direct customer relationship with the oil companies through smaller and more specialised framework agreements. The operations and maintenance segment has the most supplier companies, as well as the highest rate of new establishments.
The level under the main contractors is often referred to as the system suppliers. These companies deliver major components that require engineering and integration of various components. Examples of system suppliers include FMC Technologies, Aker Subsea Production Systems and GE Oil&Gas, which are world leaders in delivery of subsea production systems. Other system suppliers include Kongsberg Maritime (control systems), Bjørge (system solutions for valves) and Dresser Rand (generator and compressor packages). These companies often purchase individual components from subcontractors and assemble the components in “product packages” or systems. These deliveries include more than a physical product; they also often include multiple service components, such as training in the use of equipment, installation and testing.
The major suppliers benefit from internal sub-deliveries, but also make use of tailor-made deliveries from external sub-suppliers. Several hundred companies can be part of a supply chain. For example, FMC Kongsberg and National Oil Well Varco have more than 1000 sub-suppliers.
A prominent feature of the supply industry is that the supply chains have become more international. In many cases, both fabrication and engineering are performed outside Norway in order to exploit the individual companies’ special expertise, increase own capacity and reduce costs. This places new demands on project management and handling of commercial risk.
2.6 Opportunities in the various parts of the continental shelf
The overall picture of the Norwegian Shelf is more complex than ever. Opportunities and challenges vary between the areas on the continental shelf. This Chapter provides a review of some development trends, challenges and opportunities for the various parts of the Norwegian Shelf.
2.6.1 The southern part of the North Sea
Current production and future opportunities in the southern part of the North Sea are linked to the chalk reservoirs in the area. A common feature here is that it takes a long time to produce the oil and gas. Ekofisk came on stream in 1971 as the first field on the Norwegian Continental Shelf, and still has a long remaining lifetime. The area is a mature petroleum province with limited undiscovered resources. There is little likelihood of making major discoveries that could trigger new infrastructure in the area.
The majority of today’s production comes from the Ekofisk, Eldfisk, Tor, Valhall and Hod chalk fields. Together, these fields will contain very significant remaining oil volumes after production ceases, according to current plans. There are a number of shut down chalk fields in the area with low recovery rates. There are also discoveries that have not yet been developed. This means that there are substantial remaining proven resources in the area which constitute a potential for continued production and value creation for decades to come. Investments are being made in new facilities both on Valhall and Ekofisk. This will enable operation and production from the area for the next 40 years. Plans for extensive further development of Eldfisk and Ekofisk Sør have recently been approved, which will lead to major investments in the area in the next few years.
Realising all these possibilities will take time. One of the restrictions for development of the area is gas treatment capacity. For some of these projects, it is most expedient to defer development until capacity becomes available in the existing infrastructure, rather than investing in new capacity. Ekofisk is a hub for the petroleum activity in the area, and many fields are tied in to the infrastructure on Ekofisk for further transport in the Norpipe system.
Valhall receives its power supply from land. The cable to the field from Lista has limited capacity other than the needs on Valhall and Hod. Further electrification of the area has been studied on a number of occasions, most recently in Climate Cure 2020 and in connection with the further development of Ekofisk and Eldfisk.
The large chalk fields are currently produced with water injection, in order to maintain pressure and force the oil out. There is a limit to how much of the oil can be extracted using this method. Therefore, implementation of other methods is being considered in the later phases of the fields’ lifetimes. Use of these methods on one or more of the large chalk fields could lead to extended operation, and thus more value creation and employment in the area. CO2 injection is one method that could be relevant over the longer term. However, there are reservoir-related, technical, regulatory and cost challenges associated with these methods. An additional problem as regards CO2 injection is obtaining enough of the gas out on the field.
There has been a strong focus on the Ula field on improving recovery using alternating water and gas injection (WAG). This has proven successful. Several satellite fields have been tied in to Ula, bringing gas to the field for injection. The field needs even more gas to realise its potential for improved recovery. Such injection is also being considered on the Gyda field. As a consequence, the field will need access to more gas than it currently has.
The overall potential for improved oil recovery in the southern part of the North Sea is substantial. While the greatest potential is found in the large fields, there are also interesting volumes in smaller fields, with Yme being one such example. Yme was shut down in 2001 after producing for six years, due to low oil prices and production problems. There was still recoverable oil left in the field, which in 2006 led the new field owners to decide to redevelop the field. Yme will be the first shut down field on the Norwegian Shelf that is re-opened.

Figur 2.25 Fields and discoveries in the southern part of the North Sea. The size of the circle indicates the total remaining resource volume.
Kilde: Norwegian Petroleum Directorate.
2.6.2 The central part of the North Sea
The central part of the North Sea (between 58 and 60 degrees latitude) has a long history of petroleum activity. Balder, which was proven in 1967, was the first oil discovery on the Norwegian Continental Shelf, although it took 30 years before the field was developed. The first development in the area was the Frigg gas field which produced for nearly 30 years before it was shut down in 2004.
Alvheim and Grane are among the largest oil producers on the Norwegian Shelf, and they are expected to continue to produce for many years. Alvheim is produced using water injection. The fields are also potential tie-in hubs for new discoveries in the area. Vilje and Volund, which produce to Alvheim, are examples.
In spite of declining production, Sleipner can maintain good capacity utilisation and achieve extended lifetime as a consequence of discoveries in the area being tied in to the field. This will also help achieve better exploitation of the Kårstø facilities. Development of fields and discoveries such as Gudrun, Sigrun and Dagny are good examples of this. Sleipner is also an important hub for the Norwegian gas transport system, as both the UK market and the Continental market can be reached from here. Sleipner also has facilities designed to reduce the CO2 content of the gas. For nearly 15 years, the CO2 extracted from the Sleipner wellstream has been stored under the seabed, yielding important experience and knowledge about such subsurface storage.
Several discoveries have been made in the Heimdal area, although they are too small to release independent developments. The gas in the discoveries must either be tied in to an oil development in the area, or as a subsea solution to Heimdal or to fields on the UK shelf for further processing. The costs associated with maintaining process activity on Heimdal are relatively high. Gassco is considering solutions for the facility that can result in lower operating costs.
The area is characterised by varied geology, with discoveries in many different types of petroleum reservoirs. The Utsira High is another interesting area in the central part of the North Sea, with mainly oil being discovered here. Exploration activity has taken place since 1967 and the geology is well-known. Like the southern part of the North Sea, the likelihood of making very large new discoveries in the Central North Sea is considered to be small. Although the Utsira High is considered to be a mature area, new types of reservoirs have been discovered here in the last five years. A total of 32 exploration and appraisal wells have been drilled in the area, where exploration activity remains at a high level. Plans are in place to drill about 20 exploration and appraisal wells over the next four years. Interesting discoveries have been made, including Luno, Draupne and Avaldsnes.
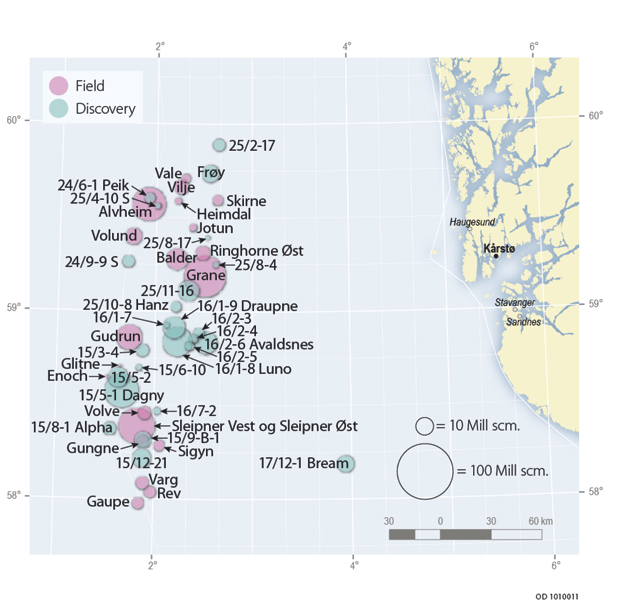
Figur 2.26 Fields and discoveries in the central part of the North Sea. The size of the circle indicates the total remaining resource volume.
Kilde: Norwegian Petroleum Directorate.
2.6.3 The northern part of the North Sea
Oil and gas have been produced in the northern part of the North Sea (between 60 – 62 degrees latitude) since the late 1970s. There are significant remaining reserves and resources in the area, both in fields and discoveries. Many late-phase fields combined with aging infrastructure, highlight the importance of making decisions early enough to extract the considerable resource potential in the area. At the same time, it is important that the preconditions of prudent operations and safe lifetime extension form the basis for such activity.
The northern part of the North Sea consists of two main areas: Tampen and Oseberg/Troll. Oil and gas from the fields in the northern North Sea are transported in part by ship and in part through pipelines to land facilities in Norway and the United Kingdom. Statfjord is now a late-phase field with production of remaining gas being exported to the UK. Troll has a very important function for gas supply from the Norwegian Continental Shelf, and will remain the main source of Norwegian gas exports in the future. Oil production is falling in the Oseberg area, although the fields here will continue to produce for many years. The last development, Gjøa with its satellites, will help maintain production in the area.
Maintaining sufficient flexibility is important in order to safeguard maximum value creation in new discoveries. By considering multiple fields and areas together, one can coordinate solutions so that costs per produced unit are as low as possible. Coordination across fields and production licenses can yield considerable rewards. There is a need to renew and streamline the extensive infrastructure to facilitate resource utilisation and value creation in a long-term perspective. The work being done on the «Snorre 2040» project is important for further development of the Tampen area. Use of existing/new facilities, future oil export solutions, flexible gas export/import solutions, efficient energy solutions and safe lifetime extension are important topics in this work.
A challenge faced by several fields in the area is the ratio between gas extraction and oil production. This is particularly important in the Troll-Oseberg area where more wells are needed. To achieve this, the area’s general challenges related to depressurisation in the reservoir must be resolved in a sound manner, and good solutions must be developed to handle the overpressure in the Shetland formation, which complicates the completion of new wells on the Gullfaks field. Ongoing and planned drilling rig upgrade projects, including on Snorre, Gullfaks and Oseberg, are necessary measures. Another issue in the area is injection of gas to recover more oil. This is already applied on several fields and studies indicate that gas injection could be a good solution for even more fields, including fields that do not have their own gas.
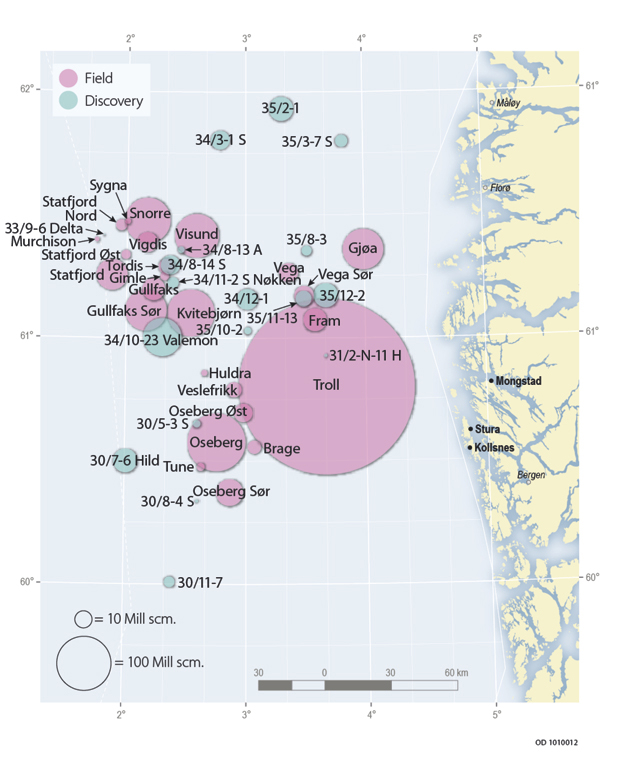
Figur 2.27 Fields and discoveries in the northern part of the North Sea. The size of the circle indicates the total remaining resource volume.
Kilde: Norwegian Petroleum Directorate.
2.6.4 The Norwegian Sea
The Norwegian Sea was opened for exploration activity in 1980. The first field to commence production in the area was Draugen in 1993. Draugen is the only facility resting on the seabed in the area. A number of floating installations have since been established, including Åsgard and Norne. Several smaller fields around existing infrastructure have been put into production in recent years.
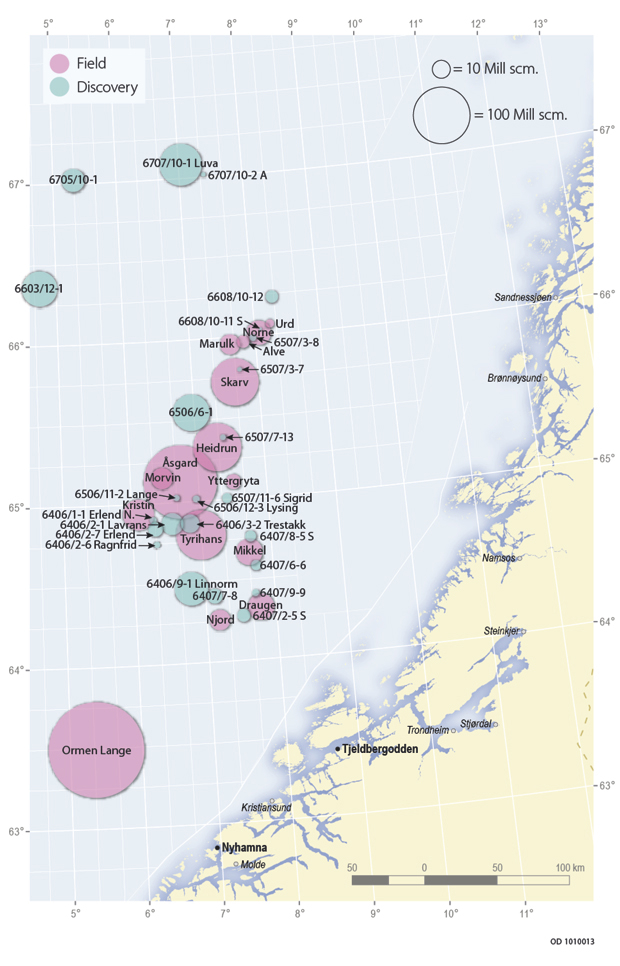
Figur 2.28 Fields and discoveries in the Norwegian Sea. The size of the circle indicates total remaining resource volume.
Kilde: Norwegian Petroleum Directorate.
Today, Haltenbanken and Ormen Lange are mature areas with considerable oil and gas production, along with well-developed infrastructure. There are also areas in the Norwegian Sea that have not yet been developed or even opened up for exploration activity. Oil production from the major fields in the area is declining. The gas export capacity from Haltenbanken, through the Åsgard transport system (ÅTS), is fully utilised for several decades into the future. This could affect the timing for phase-in of new discoveries on Haltenbanken. The timing for production of gas that up to now has been used as pressure support for oil production will affect how long the current capacity is fully utilised. Gas injection has been used for the Åsgard fields, and will continue to be a key factor in maintaining reservoir pressure and oil production.
It has been proven that the Norwegian Sea contains a lot of gas. Produced gas from the fields is transported in the ÅTS pipeline to Kårstø in Rogaland, and in Haltenpipe to Tjeldbergodden in Møre og Romsdal. The gas from Ormen Lange runs in a pipeline to Nyhamna, and from there on to the United Kingdom. The CO2 content of the gas produced from several of these fields is relatively high, which is also the case for several of the discoveries in the area. Gas from these fields is therefore blended with other gas with lower CO2 content to achieve compliance with gas quality requirements. This blending takes place from fields both in the Norwegian Sea and from fields located further south. This creates interdependence between the fields in the Norwegian Sea, and affects how the individual fields are produced.
Two fields are being developed: Marulk, which will be tied in to Norne, and Skarv, which is being developed with its own process facility. Work is underway on a further development of Ormen Lange. The Vøring area in the Norwegian Sea is currently an area without infrastructure. Several gas discoveries have been made in the area. The planned development of Luva could create a foundation for further exploration activity and new developments in the area. The operator’s plan calls for gas from the discoveries to be transported to Nyhamna where the gas from Ormen Lange is already processed.
2.6.5 The Barents Sea
The Barents Sea is currently the least explored part of the Norwegian Continental Shelf. Together with the deep-water areas in the Norwegian Sea, the Barents Sea is considered to be the area with the greatest probability of making large new discoveries. Eleven exploration wells are planned in the Barents Sea in 2011.
The first exploration well in the Norwegian sector of the Barents Sea was drilled in 1980, and Askeladd, the first gas discovery, was made the following year. Snøhvit started production in 2007 and is produced via the LNG facility at Melkøya. This development includes the Snøhvit, Albatross and Askeladd gas discoveries.
The Goliat oil field was proven in 2000 and development and operation was approved by the authorities in 2009. The plan calls for reinjecting the gas from Goliat, but gas export solutions are also being studied. Based on Goliat’s gas evacuation needs, Gassco has initiated an area study with the objective of mapping future needs and gas transport alternatives from the area. The study will cover both gas export by pipeline and ship, as well as domestic use of gas from the area.
In the spring of 2011, Statoil made a significant oil discovery on the Skrugard prospect in the Barents Sea. This discovery is a breakthrough in this unexplored area, and an important exploration event for the Norwegian Shelf and the Barents Sea. The discovery is located about 100 kilometres north of the Snøhvit field, and the resource estimate is so positive that it could release a new independent development. This discovery opens up new opportunities for further activity in the Barents Sea.
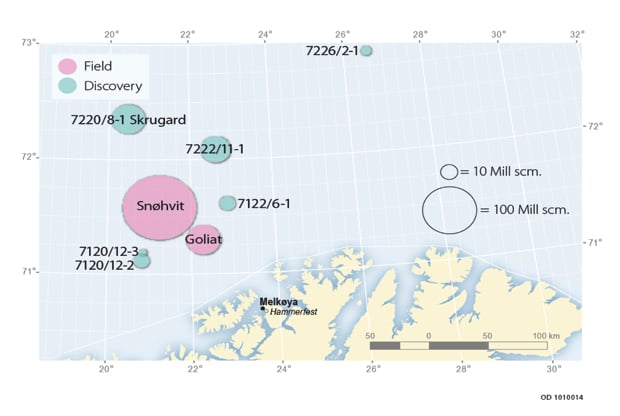
Figur 2.29 Fields and discoveries in the Barents Sea. The size of the circle indicates the total remaining resource volume.
Kilde: Norwegian Petroleum Directorate.
Boks 2.2 The land facilities
Kårstø – larger gas volumes are needed by 2020
The gas processing facility at Kårstø is a central facility for processing gas volumes from the North Sea and the Norwegian Sea. Estimates for the gas processing plant at Kårstø show a significantly reduced supply of gas feed from 2020. These forecasts are based on the gas producers’ reported capacity needs at the facility.
The Kårstø facility is densely integrated, with dependencies that entail that any reduction of capacity will force the newest parts of the facility to close first. This means that maintenance and other work to ensure the robustness of the oldest parts of the plant will still be needed when the plant’s capacity is adjusted downward. As the petrochemical industry in the Grenland area uses ethane from Kårstø as one of its most important raw materials, the future of this industry will be linked to the future feed situation at Kårstø.
Kollsnes – will maintain two-thirds capacity utilisation until 2030
Natural gas from the Troll, Kvitebjørn, Visund and Fram fields will be delivered to the gas processing facility at Kollsnes. Nearly 40 per cent of all Norwegian gas exports run through this facility, which has a total capacity of 143 million Sm³ dry gas to Europe per day. Gas from Kollsnes is also an important blending gas due to its low CO2 content. The feed gas supply to Kollsnes will be reduced as we move towards 2020. Capacity utilisation of about two-thirds can be maintained until 2030, even if new discoveries are not tied in to the gas processing plant.
The Kollsnes facility has been constructed with six independent gas processing lines which enable stepwise downscaling when it becomes necessary to reduce the processing capacity at the facility.
Nyhamna – needs new access to natural gas from the Norwegian Sea
The Ormen Lange field delivers natural gas to Nyhamna, and about 70 million Sm³ of dry gas is processed per day. This gas is mainly exported to the UK. With failing decisions to develop ongoing maturing fields in the Norwegian Sea (such as Luva and Linnorm) with tie-in to Nyhamna, capacity exploitation will experience a significant drop around 2020. The gas processing facility was built for the Ormen Lange field, and will be forced to close if new fields are not tied in to Nyhamna during the field’s lifetime.
Tjeldbergodden – Heidrun’s gas injection needs are important
Tjeldbergodden receives gas from the Heidrun field via Haltenpipe. The gas volumes in Haltenpipe go exclusively to industrial use at Tjeldbergodden. Today, Tjeldbergodden utilises less than one-third of the available gas capacity in Haltenpipe, but there are several other fields that could potentially deliver gas via this pipeline, given reasonable facilitation. Heidrun can deliver gas to Tjeldbergodden for quite a long time, but the need for gas injection on the field could limit gas extraction, and thus also potential gas transport to Tjeldbergodden.
Footnotes
Storting White Paper No. 58 (1996–1997), Environmental policy for sustainable development.
Storting White Paper No. 26 (2006–2007), The Government’s environmental policy and the environmental state of the realm.