3 A holistic approach to financial markets policy
3.1 Introduction
Banking and financial services are a key component of society’s infrastructure. A healthy financial industry is crucial for financial stability, and promotes economic growth, value creation, productivity growth and restructuring. An unhealthy financial industry may foster structural challenges, financial instability and major economic challenges.
During its consideration of the National Budget 2015, the Storting asked the Government to “put forward a proposal for a holistic policy for the financial industry as part of the Financial Markets Report”. In chapter 3 of the Financial Markets Report 2014, the Government identified important features of Norwegian financial market policy and pointed out that other policy areas also have a significant impact on the conditions for Norway’s financial industry. The report also discussed some of the instruments the authorities use to ensure proper risk management and strong customer protection in the financial market, how the financial sector supports effective resource use in the economy and the conditions for the production of financial services in Norway. In section 3.6 of the report, the Ministry listed a number of topics to be examined in future reports.
This chapter discusses certain topics by way of follow-up of last year’s Financial Markets Report, including the structure of and competition in Norway’s financial markets and Norwegian businesses’ access to capital from financial undertakings and the securities markets.
3.2 The objectives of Norwegian financial markets policy
The financial markets and the financial system are important in all modern economies. The financial sector channels capital from savers to investors, and from sellers to buyers. The financial system reallocates risk between different sectors of the economy. Successful use of the capital distributed by the financial sector encourages saving and reinforces economic growth capacity. History shows that serious miscalculations and problems in the financial sector can trigger severe, prolonged economic downturns. Accordingly, a successful financial market policy is an important element in a holistic economic policy.
The Government wants the financial sector to promote the greatest possible value creation in the Norwegian economy over time. The financial industry’s contribution to total value added in the Norwegian economy has two main components:
Direct value creation: the financial sector pays wages to employees, dividends to owners, interest to creditors and taxes to the Treasury.
Indirect value creation: financial services such as credit, insurance and payment services provide a foundation for value creation in the rest of the economy.
Around 50,000 persons are employed in the Norwegian financial sector. The sector accounts for just over 5 percent of mainland Norway GDP and has in recent years generated between around 15 percent and 30 percent of total corporation tax revenues (excluding petroleum, etc.). The contribution of the financial sector to valued added in other sectors is difficult to quantify. The complicated underlying structure of a modern economy demands a comprehensive range of financial services. High-quality financial services can help to ensure the correct allocation of capital and high value creation in non-financial sectors. Quick, cheap and secure payment solutions improve trading conditions, among other things. The quality of relatively simple financial services, such as payments services, can be measured. Payment services in Norway perform well in international comparisons; see further discussion in section 3.4.3 of the Financial Markets Report 2014. The quality of other financial services – such as investment advice, savings products and loans – is closely linked with the quality of assessments of potential returns and risk. Accurate return and risk assessments can help reduce the number of bad investments and promote good risk diversification. Satisfied customers, low prices, strong competition and high innovation in financial service provision may indicate that such services are of high quality. However, it can take many years for the full economic consequences to emerge after products are developed, marketed and sold. Even then, it may be difficult to determine the connection between the outcome and the quality of the services provided. An illustrative international example is the development of the sub-prime market in the US and subsequent financial crisis.
Financial marketplace quality can be assessed by reference to opening times, regularity, liquidity and number of regulatory breaches, etc., as well as whether the prices achieved by buyers and sellers are correct. The so-called efficient markets hypothesis is well-known in the field of financial economics, and states that a market is efficient if securities prices reflect all available information. Public regulation may thus aim to facilitate marketplace efficiency, among other things. The closer to efficiency the marketplace comes, the simpler it becomes to compose strong investment products, give good investment advice and evaluate returns and risk for investors. However, it is difficult to evaluate whether, and to what extent, securities markets are efficient. If it is assumed that securities markets are inefficient, it becomes more difficult to assess the quality of financial services and advice. Providers of financial services may have a vested interest in stating that markets are inefficient and that they have knowledge which is not already reflected in market prices.
One of the primary advantages of a well-functioning, well-regulated financial sector with regard to value creation in the rest of the economy is a reduced likelihood of financial crises. This can have substantial economic benefits. Experience from Norway and other countries strongly indicates that the sharp reduction in the range of available financial services which often follows a financial crisis can have a very severe and long-lasting negative impact on value creation in other sectors. The discipline of economics has made a major contribution in terms of systematising and researching lessons in this area, and the effects of financial crises are therefore far better known and mapped than previously. Nonetheless, this field of research is also in constant development.
The Government wishes to reduce the threat to the Norwegian economy’s growth capacity presented by disruptions to the financial system. First and foremost, this entails ensuring good solvency among financial undertakings to prevent losses or weaker earnings from causing or intensifying economic downturns. This policy contrasts with the policy pursued in some countries in the years preceding the international financial crisis, under which risk levels were inflated by a combination of weak solvency requirements and rapid growth in the financial sector. When losses arose, financial undertakings were too weak to absorb these while still providing their services to the rest of the economy. It is important that solvency requirements, etc. are not eased to promote short-term growth in the financial sector. In Norway, there has long been broad political agreement on the importance of strong financial sector solvency, and both experiences and research have underlined the importance of robust regulation. The financial services produced by the Norwegian financial sector could have been imported from abroad. However, the existence of an independent domestic financial sector has several advantages, and generates added value beyond the individual services and direct value creation. It is also generally desirable to have a diversified business sector which includes the production of financial services.
The acceptable levels of stability and quality in the provision of financial services may vary from country to country, based on factors such as adopted priorities and risk tolerance. Views may also differ on how best to achieve a given level of stability and quality in service provision. Norwegian financial market policy is designed to secure a high level of stability and quality through requirements relating to solvency and the conduct of financial undertakings which are frequently stricter than international minimum requirements. Norwegian policy emphasises confidence, security and long-term growth. The supply side as a whole should be able to resist external disruptions without encouraging the development of imbalances or other risks capable of triggering problems. The supply side should be diversified, but identical risks should be regulated identically, irrespective of factors such as type of entity. Regulatory provisions should be tailored to structural circumstances and special risks in the Norwegian economy, like industry structure, household debt level, vulnerability to changes in the prices of oil and other commodities, etc. Cyclical factors should also be taken into account when developing requirements for financial undertakings. Finally, it is important that consumer interests are properly safeguarded.
Regulation of financial institutions’ solvency is necessary in the interests of financial stability. Regulatory provisions should help give households and businesses continuous access to a reliable range of savings and loan products. When formulating financial markets policy, a balance should be sought between different considerations. For example, it is not an objective to skew the granting of credit towards or away from different aims, groups or risk categories, or to influence the intertemporal saving and investment decisions of businesses and households. Accordingly, if capital requirements skew, increase or reduce access to capital for businesses or households beyond such stabilisation, this is in principle undesirable.
Further, the interests of producers of financial services must be balanced with factors such as the need for financial and economy stability, customer security and cheap services produced through competition as free as possible. Regulation and other aspects of financial market policy also help to safeguard the interests of financial service producers, in various ways. For example, solvency requirements, liquidity requirements and insurance schemes improve the stability of the financial sector. This in turn may increase the long-term value of relevant undertakings. When the authorities introduce and enforce requirements, this raises confidence among customers, investors and other counterparties that financial undertakings will meet their obligations. This is important, especially during periods of financial market turbulence.
The Norwegian economy faces challenges in the years ahead, and the importance of having a financial sector capable of supporting necessary restructuring to address weaker economic development has seldom been as high. Banks and other parts of the Norwegian financial sector have improved their solvency in recent years, on the back of very high banking sector profitability. Future developments may increase losses and reduce solvency at the same time as demand for capital-intensive loans remains high in the economy. Unless Norway’s financial sector is robust, businesses, households and authorities may find it difficult to deal with the shift in the Norwegian economy. The Government will therefore continue to give priority to satisfactory financial sector solvency in its financial market policy. This is also the best way of ensuring the long-term strength and competitiveness of the financial sector.
3.3 Structure and competition in the Norwegian financial market
3.3.1 Actors
In Norway, the financial sector comprises a smaller part of the economy than in many other countries. One reason for this is that the operations of Norwegian financial undertakings focus primarily on service provision in the domestic financial markets. Through the EEA Agreement, Norway is part of the EU/EEA common market, and financial undertakings from across the EU/EEA are thus free to offer their services in the Norwegian markets. Foreign entities have gradually increased their presence in Norway in recent years, through both acquisitions and organic growth. While this trend has boosted diversity and competition among financial service providers, it has also impacted the influence Norwegian authorities can exercise over the management of risk in the financial markets, since foreign financial undertakings are in principle subject to supervision and regulation in their home state.
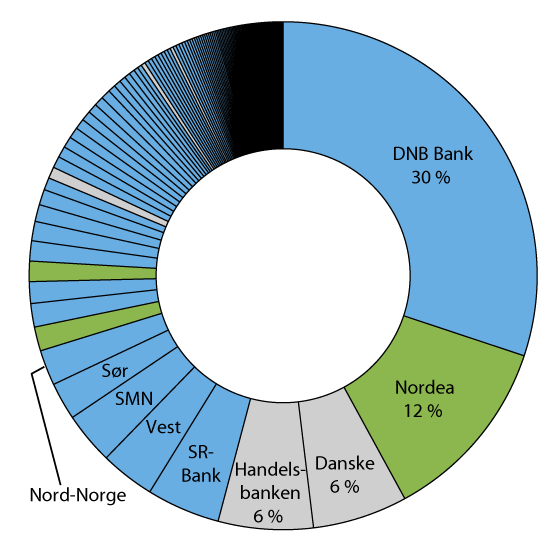
Figure 3.1 Lending to customers in Norway by all banks, mortgage companies and branches at the end of 2015. Norwegian institutions, subsidiaries and branches of foreign institutions are marked in blue, green and grey, respectively.
Source Finanstilsynet
Banks and mortgage companies make up a substantial proportion of the supply side of the Norwegian credit market. DNB is the largest actor with its market share of around 30 percent; see Figure 3.1. It is followed by Nordea (a subsidiary of a foreign bank), two medium-sized branches of Danish and Swedish banks, and a handful of medium-sized Norwegian savings banks. The rest of the market comprises various smaller Norwegian savings and commercial banks, as well as some subsidiary banks and branches of foreign banks. The foreign branches had a total market share of approximately 13.5 percent in 2015, and have in recent years recorded higher lending growth than other actors in both the residential mortgage market – in which foreign branches generally have to follow “Norwegian“ capital requirements – and the commercial lending market, in which branches are subject to the capital requirements of their home states; see Figure 3.2.
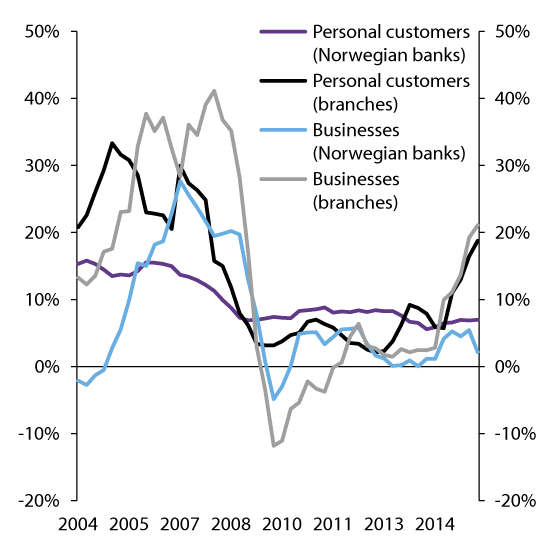
Figure 3.2 Lending growth among Norwegian banks and branches of foreign banks
Source Finanstilsynet
When the Norwegian banking crisis occurred in the early 1990s, there were few foreign actors in the Norwegian credit market who could compensate for the loss of credit supply from affected Norwegian banks. Branches of foreign banks can help diversify the supply side of the Norwegian credit market, and help ensure that not all institutions are equally vulnerable to fluctuations with a particular impact on the Norwegian economy. Accordingly, foreign branches can have a stabilising effect on credit supply in Norway during a downturn in the Norwegian economy. The effects may differ in the event of a broad international crisis or a crisis in a branch’s home state.
As Figure 3.2 shows, branches of foreign banks recorded higher growth in lending to businesses and personal customers than Norwegian banks in the years preceding the international financial crisis, although the growth rate slowed materially once the crisis hit. Although this trend does not necessarily mean that the foreign banks were less solvent (since the observed developments may also be explained by other factors), the approach taken is the one less solvent banks can be expected to adopt in such situations. Foreign banks may also wish to prioritise their home markets during periods of turbulence or weak international growth. The design of the EU common market for financial services does not take into account that banks may tend to give priority to activities in their home states rather than host states in times of economic unrest.
The Norwegian financial market benefits when the supply side is structurally diverse. Local savings banks, regional savings banks, Norwegian commercial banks and foreign banks play different roles, and compete with one another.
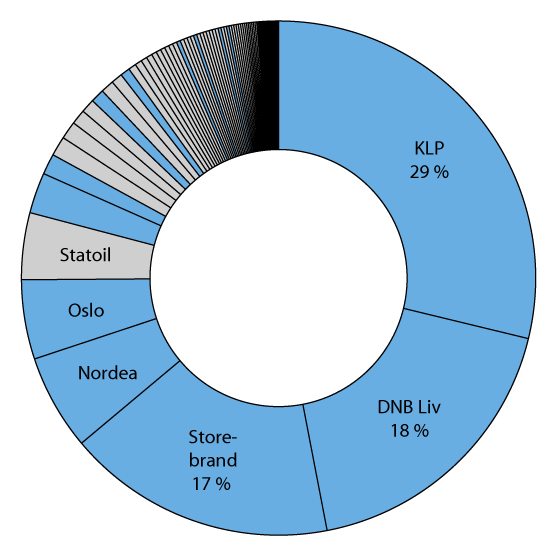
Figure 3.3 Capital under management of life insurance companies (blue) and pension funds (grey) at the end of 2015
Source Finanstilsynet
The Norwegian life insurance and pensions market is among the most concentrated in Europe, and is primarily served by a small number of life insurance companies and various pension funds; see Figure 3.3. The three largest life insurance companies hold around 64 percent of the total capital under management in the market. The industry currently faces challenges, particularly linked to higher life expectancy and low interest rates. These factors are impacting, for example, earnings, competition and customers’ switching opportunities.
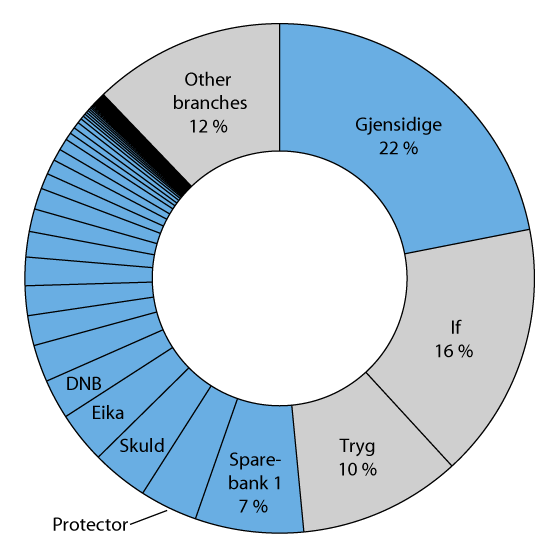
Figure 3.4 Gross premiums payable to non-life insurers in 2015. Norwegian undertakings (blue) and branches of foreign undertakings (grey)
Source Finanstilsynet
The structure of the non-life insurance market is more similar to that of the credit market, with one large actor, two large branches of foreign undertakings and several smaller Norwegian and foreign actors; see Figure 3.4. There is considerable competition between the undertakings in the Norwegian non-life insurance market, and a low threshold for new actors to enter the market.
Although market concentration can be measured in different ways, the Herfindahl-Hirschmann Index (HHI) is a commonly used method when concentration is to be used to shed light on competition conditions. HHI is the total of the squared market shares of suppliers in a given market, and falls into the range 0 to 1, where a value close to 0 indicates low market concentration and a value close to 1 signifies that there is only one supplier, i.e. a monopoly. The higher the HHI figure, the higher the market concentration. Figure 3.5 shows developments in HHI since 1998 based on market shares in the Norwegian markets for residential mortgages (banks), life insurance (life insurance companies) and non-life insurance (non-life insurers). The figures indicate that market concentration has fallen somewhat in all three markets in recent years, and that concentration is generally higher in the life insurance market than in the other markets.1
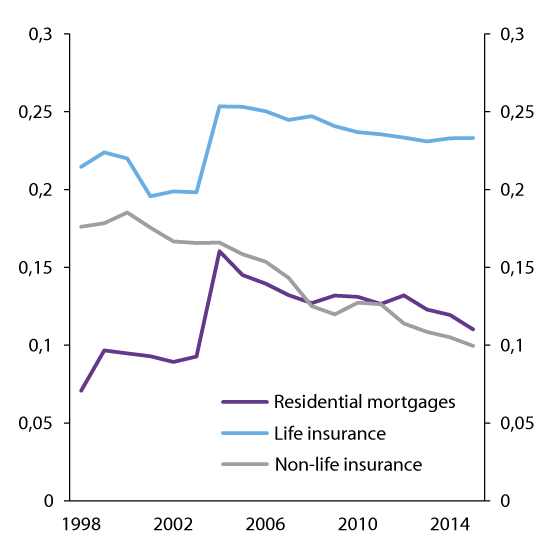
Figure 3.5 Herfindahl-Hirschmann Index for three Norwegian financial markets
Source Finanstilsynet
3.3.2 Innovation in financial services
The Norwegian financial industry is an international leader in the use of cost-effective electronic solutions throughout the value chain. The financial industry has long been an example for other Norwegian business sectors in relation to restructuring and the ability to develop and use new technology. Technology development, digitisation and regulatory changes facilitate increased efficiency and value creation.
The emergence of new actors who are using technology to provide financial services in new ways is observable both internationally and in Norway. The rise of financial technology, or FinTech, as a separate industry may also imply changes in the supply side interfacing with customers in Norwegian markets. For example, in the payment services and financing segments, new actors are entering the market and offering financial services outside the established financial system, at the same time as financial undertakings are developing competing services within the system. This trend has similarities with the emergence of the so-called sharing economy in other areas, where service provision largely entails arranging for private persons to trade services directly with one another.
Developments in the area of financial technology primarily offer opportunities for the Norwegian financial industry, which has a tradition of innovation and productive technology exploitation. New business models can provide new revenue opportunities for the industry. However, these developments also come with challenges, which must be handled appropriately.
When financial services are provided in new ways and outside the established systems, questions arise in relation to matters such as regulatory adjustments, data and consumer protection and financial stability consequences. The financial industry, new actors, customers and the authorities have to address changes in risk and vulnerability. An important task for the authorities is to ensure that innovation in the context of financial service provision does not undermine customer confidence through weaker solvency and security requirements for actors, irrespective of whether services are provided within or outside the established, regulated financial system.
3.3.3 Solvency requirements set at the national level
The regulations applicable to financial undertakings are growing in scope and complexity, and are increasingly based on international rules. International cooperation is particularly close in the EU/EEA, where the aim is to develop a single rule book for the common market. International cooperation and binding commitments can help improve regulatory systems and supervision in countries in which national standards have been weak, reduce protectionism and favourable treatment of domestic financial industry, improve comparability and transparency, and intensify supervisory collaboration.
The quality of the EU financial markets legislation has improved in recent years, but much work remains to be done. The need for national rules in addition to minimum requirements has therefore declined. Nonetheless, financial markets regulation should be deliberate and knowledge-based, and national authorities should always assess whether the desired result is being achieved, even when minimum requirements have been introduced.
International committees and other cooperation bodies cannot be expected to investigate and consider the specific consequences in individual countries of the regulations they recommend or adopt. In any event, national authorities will usually be in the best position to assess the consequences of such regulations for their markets. National authorities may also have fiscal motivations to introduce stricter requirements in order to reduce the risk of financial crises and downturns in the national economy, not least to protect their taxpayers. For example, problems in the banking sector may develop quickly, forcing the authorities to implement costly measures to protect the rest of the economy. The costs associated with problems in the financial sector are primarily borne by the country in which the problems arise.
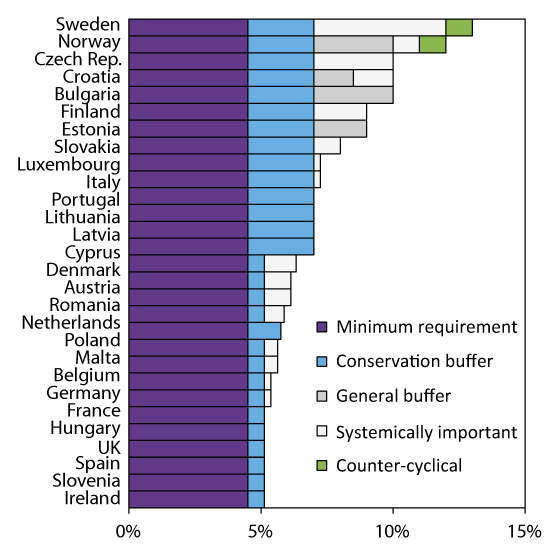
Figure 3.6 CET1 capital adequacy requirements (risk-weighted) in the EU and Norway as at 1 January 2016
Source ESRB
Textbox 3.1 Risk-weighting, capital requirements and floor rules
The solvency requirements applicable to banks and other credit institutions in Norway are based on the EU capital requirements regulations (the CRR/CRD IV framework), which in turn reflect recommendations made by the Basel Committee on Banking Supervision. Simply put, the requirements are formulated as minimum requirements for bank equity as a percentage of bank assets. According to the rules, assets must be risk-weighted based on assumed loss risk. Previously, regulations specified the risk weights to be used for different types of assets. For example, a typical residential mortgage was to be weighted at 50 percent of its value. Since 2007, banks operating internationally and in the EU/EEA have been permitted to use their own models to calculate risk weights (the IRB approach). To prevent such modelling from producing excessively low risk weights, the Basel Committee recommended a floor, i.e. a minimum permitted total value of the risk-weighted assets (RWAs). This value was not allowed to be lower than 80 percent of what it would have been under the old rules (the Basel I rules), which had fixed weights for different asset types. This is the so-called Basel I floor.
The percentage capital requirement for banks – expressed as a minimum of 8 percent of RWAs – was not amended in 2007. Accordingly, it was insignificant for the actual floor requirement whether it was formulated as (1) a floor for risk-weighted assets or (2) a floor for the nominal capital requirement. Both these variants of the Basel I floor required banks to have at least 80 percent of the capital they would have had to have under the old Basel I rules. However, the different variants of the floor rule affect banks’ capital adequacy figures. When the floor relates to risk-weighted assets, capital adequacy may fall because the same capital is divided by a higher number. In the EU rules, the floor rule was implemented in a way that gave individual countries scope to choose which variant they wished to use. The Norwegian authorities chose to use the Basel I floor for risk-weighted assets.
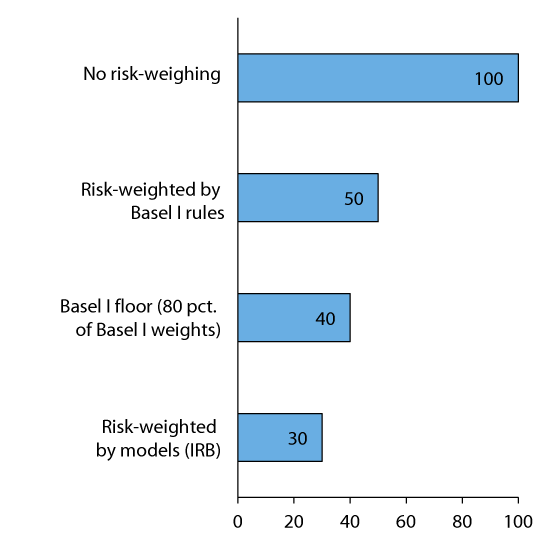
Figure 3.7 Example of risk-weighting of bank assets. NOK billion
The percentage capital requirement applicable to banks in the EU/EEA was raised after the financial crisis, and is now around 11–18 percent, depending on the capital buffer requirements adopted by different countries. Therefore, it is now significant whether the floor relates to risk-weighted assets or the nominal capital requirement. For many banks, a floor for the capital requirement will have no effect, even if a bank uses very low risk weights, since the percentage capital requirement has increased.
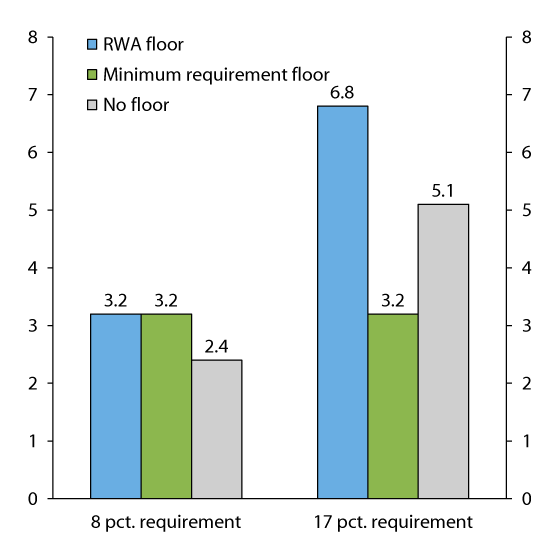
Figure 3.8 Capital requirement for an example bank, with and without different variants of the Basel I floor. NOK billion
Figures 3.7 and 3.8 illustrate the difference in the case of an example bank with NOK 100 billion in assets. In the example, risk-weighting in accordance with the Basel I rules results in NOK 50 billion in RWAs, while the bank’s internal models produce NOK 30 billion in RWAs. If the capital requirement is 8 percent, the bank’s capital requirement will thus be NOK 3.2 billion irrespective of which floor variant applies, because both floor rules provide that the requirement must total at least 80 percent of the capital requirement calculated under the Basel I rules. In the absence of any floor rule, the capital requirement would be 8 percent of the RWAs calculated using the bank’s internal models, i.e. NOK 2.4 billion. If, instead, the capital requirement is 17 percent,1 the two variants of the Basel I floor will produce different results. The more lenient variant (based on the nominal capital requirement) produces the same result as before, namely 80 percent of the capital requirement calculated in accordance with the Basel I rules, i.e. NOK 3.2 billion. The second variant of the floor is based on 80 percent of the RWAs calculated under the Basel I rules, and sets the requirement at 17 percent of this amount, i.e. NOK 6.8 billion. The more lenient variant of the floor has no effect in this example, since it results in a lower capital requirement than 17 percent of the RWAs produced by the bank’s internal models, i.e. NOK 5.1 billion.
As stated, Norway applies the Basel I floor for RWAs, and the level of the capital requirement is set on the basis that risk weights should not be too low. This application of the floor rule is closest to the variant adopted by the Basel Committee in the Basel II recommendations from 2005.2 Sweden and Denmark are among the countries which use the other variant of the Basel I floor, and banks in those countries are therefore able to report relatively high capital adequacy figures based on low risk weights. Since the rules on risk-weighting of assets differ, it is important to highlight actual bank solvency; see section 3.3.5.
The Basel Committee is currently working on new floor rules to be implemented in the EU/EEA in a few years’ time; see e.g. the discussion in Box 3.5 in the Financial Markets Report 2014. New floor rules may stimulate more uniform practice across countries and more accurate minimum requirements. In addition, the EU is working on a non-risk-weighted capital requirement (leverage ratio), which is intended to function as an additional floor for risk-weighted requirements and promote transparency and comparability.
1 Since 1 July 2016, the total capital adequacy requirement for systemically important banks in Norway has been 17 percent, including a counter-cyclical capital buffer requirement of 1.5 percent.
2 See the Basel Committee on Banking Supervision (2005), “International Convergence of Capital Measurement and Capital Standards – A Revised Framework”. The floor rule is described in several stages in paragraphs 46 to 49 of the document. According to the Basel Committee’s description, banks were first to calculate the capital requirement of 8 percent under the old (Basel I) and new (Basel II) rules. If 80 percent of the old capital requirement (Basel I) was higher than 100 percent of the new capital requirement (Basel II), the difference between the two amounts was to be multiplied by 12.5 and added to the bank’s risk-weighted assets. This entailed increasing the RWAs to 80 percent of the Basel I level if it exceeded 100 percent of the Basel II level. Multiplication by a factor of 12.5 – the inverse of 8 percent (such that 12.5 x 8 = 100) – is a technical solution which “translates” the capital requirement of 8 percent of the RWAs into the RWAs as a whole.
The new EU capital requirements for banks, the CRR/CRD IV framework, offer significant scope for national authorities to increase solvency requirements above the minimum requirements, including through the use of different permanent and temporary capital buffer requirements. There are considerable differences in how the EU/EEA member states have utilised this scope; see Figure 3.6, which shows CET 1 capital adequacy requirements (risk-weighted) as at 1 January 2016. Most EU member states are phasing in stricter requirements over several years, and some countries have only just begun.2 One difficulty inherent in risk-weighted capital requirements is that risk-weighting can vary between banks and between countries without necessarily reflecting underlying risk factors; see Box 3.1.
Norway is among the countries which have chosen to adopt solvency requirements which are stricter than international minimum requirements, and economic developments in Norway have allowed quicker introduction of new requirements in Norway than provided for in the EU’s phasing-in plans. The Norwegian authorities have long emphasised that the requirements are to support economic stability and growth over time, and that regulations which promote bank solvency and financial stability offer substantial economic gains. As discussed in section 3.3.4, however, it may be difficult to achieve this if Norwegian and foreign banks are subject to materially different requirements.
Several studies have estimated the net economic benefits from increased bank solvency. The results show that banks should generally have considerably more capital than the levels prescribed by Basel Committee standards and EU rules; see further discussion in e.g. Box 2.9 of the Financial Markets Report 2011.
EU/EEA law makes a fundamental distinction between domestic financial undertakings and branches of financial undertakings from other EU/EEA countries. In principle, foreign branches are subject to the regulatory and supervisory jurisdiction of their home states, although some non-mandatory components of the EU capital requirements regulations are applicable to all actors operating in the country which sets the requirements. An example is the counter-cyclical capital buffer requirement, which is intended to strengthen banks during periods when imbalances may develop. National authorities also have less influence over banks which are members of groups based in other EU/EEA countries, particularly as regards supervisory follow-up of internal risk models and systems. As in the case of branches of foreign banks, the supervisory authority of the home state has the final say on the approval of e.g. internal models for calculating capital requirements for such subsidiaries, even if the host country’s supervisory authority participates in the evaluation.
Supervisory follow-up of internal models and systems has become a more important aspect of solvency regulation post-2007, as many banks have begun using internal models to calculate capital requirements. The methods and assumptions banks are permitted to adopt in their calculations have a considerable effect on the risk-weighting of assets, and thus also on the actual level of the capital requirements; see Box 3.1. The impact of supervisory follow-up of such matters can be illustrated by new requirements introduced by Finanstilsynet in 2014 relating to banks’ calculation of residential mortgage risk. The new requirements imply that banks’ models may not produce risk weights for residential mortgages below approx. 20–25 percent. Previously, risk weights could be as low as 10 percent. In principle, doubling the risk weight also means doubling the capital requirement (ignoring the effect of floor rules, etc.)
3.3.4 Identical requirements for sub-markets
Identical risk should be regulated identically, irrespective of what type of financial undertaking assumes the risk. The aim is to prevent risk from accumulating where it is the least regulated. For example, two identical residential mortgages issued in the same market should trigger identical capital requirements for the lenders. If the capital requirements are sufficiently high, this will promote robust solvency and competition among providers in the market. If there are differences in the regulation of the same risk in a market, less regulated actors will win market share and thus undermine the solvency of the financial system in question. In some areas, inconsistencies have developed between the different parts of the EU regulatory framework; see below.
Following the introduction of the Solvency II framework in January 2016, risk management in European insurance markets has become far more uniform than before. The new insurance framework strongly emphasises harmonisation, although it also permits the use of internal models for capital requirement purposes, much like the EU banking rules. It is too early to conclude on how the opportunity to use internal models in the insurance sector will impact actual solvency requirements in national insurance markets.
As stated, solvency regulations in the banking sector vary widely due to differing levels of capital requirements and differing national requirements relating to modelled risk weights. The Government is focused on ensuring that actual solvency requirements applicable to banking operations in Norway are as identical as possible for Norwegian and foreign actors and reflect risk factors in the Norwegian market. If different groups of actors in the Norwegian market are subject to different solvency requirements, this may have a negative impact on competition, advantage the most weakly regulated actors and create challenges for Norwegian financial undertakings. As stated, this in turn may undermine the solvency of the financial system as a whole and increase the risk of financial instability.
Developments in this area are going in the right direction. For example, the counter-cyclical capital buffer requirement under the EU rules is to be set by the respective national authorities, and will apply to all banks operating in a given country, including branches of banks resident in other EU/EEA member states. The EU is discussing whether this principle should apply more generally to bank solvency requirements, so that the requirements of the country in which a bank operates more often take precedence over the requirements of the country in which the bank has its head office. The European Commission recently released for consultation a document on the effects and need for improvement of EU financial markets regulations. Among other things, it identified “inconsistencies and gaps“ in the regulations applicable to financial undertakings, including differing regulation of different types of financial undertakings, such as banks and insurance companies. The Ministry of Finance has submitted comments,3 not least emphasising the importance of sufficiently strict requirements and that each individual country should in relevant cases be permitted to set stricter requirements for all actors in its market:
“In recent years, much of the new or revised EU/EEA legislation on financial services has prescribed a greater deal of harmonisation of rules in the internal market, and generally stricter prudential requirements. In some areas, however, the EU/EEA legislation may open for practises that may be deemed too lax for some countries seeking to ensure strong and robust financial institutions. The result may be uneven playing fields, and market pressure to lower prudential requirements down to the EU/EEA minima. We hope that the Commission will continue its efforts to promote better and more harmonised rules, both at the national and EU/EEA level. If harmonisation of appropriately prudent requirements is not feasible at the EU/EEA level, the legislation should allow for stronger rules at the national level, as well as a greater degree of harmonisation between some countries, making host-country-determined rules applicable for both domestic and foreign institutions’ operations in the country in question.”
Most foreign actors in the Norwegian banking market are based in other Nordic countries. The authorities in the Nordic region cooperate effectively in the area of financial markets supervision. Among other things, this has facilitated agreement among the Scandinavian supervisory authorities that Finanstilsynet’s stricter requirements relating to internal models for residential mortgages should also apply to the operations of Swedish and Danish banks in Norway. This is an important contribution to uniform solvency requirements and robust, equal competition in the Norwegian residential mortgage market.
As stated in Box 3.1, work is also ongoing internationally to define new “floors“ for bank solvency based on simpler and more transparent rules than those applicable under general solvency regulations. Such floor rules may mean significantly stricter requirements for banks which are currently permitted to apply low risk weights to different types of loans.
The Government will continue to promote effective competition between banks and financial undertakings. As the international financial crisis has demonstrated, requirements which facilitate effective competition within a framework of financial stability are policies which support economic growth capacity. The Government has discussed competition in the Norwegian financial markets on previous occasions, including in section 2.8 of the Financial Markets Report 2013 and section 3.4.2 of the Financial Markets Report 2014.
3.3.5 Visible solvency
The solvency requirements applied to banks vary from country to country, both in formal terms and in practice. Differences may be due to differing national practice regarding the types of internal models banks are permitted to use to calculate risk and capital requirements. In some countries, the supervisory authorities permit banks to rely primarily on their own data and experience when performing such calculations, while other supervisory authorities require banks to allow for more frequent and larger losses, for example on loans.4 Moreover, differing application of floor rules may produce different capital adequacy figures for a given undertaking; see Box 3.1 above. Such differences in rules and practice make the use of official figures to compare actual solvency across banks challenging. In addition, changes in rules and practice may make it difficult to evaluate solvency developments over time.
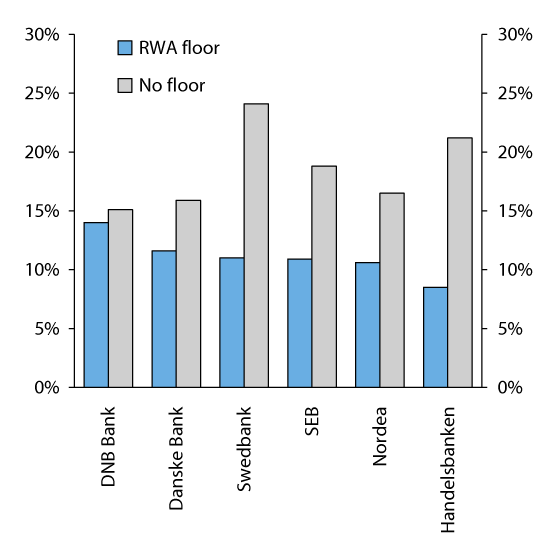
Figure 3.9 CET1 capital adequacy (CET1 capital as a percentage of risk-weighted assets) among the largest Nordic banks at the end of 2015. With and without application of the Basel I floor on risk-weighted assets
Source Finanstilsynet
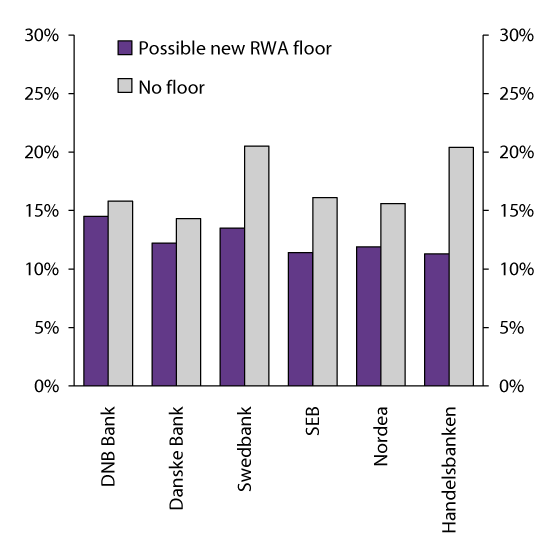
Figure 3.10 Estimated CET1 capital adequacy of the largest Nordic banks at the end of 2015. With and without application of a potential new Basel Committee floor rule to the calculation basis (risk-weighted assets)
Source Deutsche Bank
The solvency of banks impacts their funding costs.5 Investors in the capital markets accept lower rates of interest on loans to more solvent banks than on loans to less solvent banks. If there is uncertainty about the true solvency of a bank, that bank’s borrowings may be incorrectly priced. Such pricing errors may be favourable or unfavourable to individual banks.6 To promote correct pricing of banks’ funding, it may therefore be important to make properly visible banks’ true solvency.
Norway is one of the countries with somewhat higher bank solvency requirements than implied by international minimum standards, both in formal terms and in practice. Among other things, Norwegian banks which use internal models to calculate risk and capital requirements must apply slightly more conservative assumptions than banks in certain other countries. In addition, Norway’s implementation of the Basel I floor means that the value of risk-weighted assets cannot fall below a certain level under any circumstances; see Box 3.1. In some cases, the result is that a Norwegian bank may need more capital to achieve a given capital adequacy ratio than a similar bank in another country.
The Ministry of Finance is focused on the visibility of the true solvency of Norwegian banks. This is important to maintain strong international confidence in the Norwegian financial system, and may also promote correct pricing of Norwegian banks’ borrowings in the capital markets. The Ministry of Finance has discussed the realities behind bank capital adequacy figures in various contexts over many years, including in white papers and in its dialogue with foreign authorities and market participants.7 The Ministry has also urged the Norwegian financial industry to highlight and compare actual bank solvency in banks’ reports and presentations to market participants and the general public.
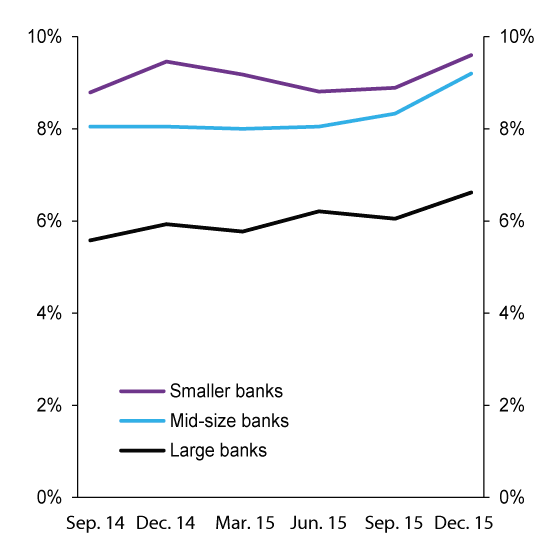
Figure 3.11 Leverage ratios of Norwegian banks
Source Finanstilsynet
The Ministry of Finance and Finanstilsynet have pointed out what the CET1 capital adequacy ratios of the largest Nordic banks would be with and without Norway’s implementation of the Basel I floor (i.e. a floor for the value of risk-weighted assets). Figure 3.9 shows the situation at the end of 2015. At that time, the Norwegian bank DNB had a CET1 capital adequacy ratio of 14 percent. If the other major Nordic banks had been subject to the same Norwegian Basel I floor as DNB, none of them would have had a CET1 capital adequacy ratio higher than 11.6 percent. However, since Swedish and Danish banks are not subject to such a floor rule, they may in some cases report CET1 capital adequacy ratios more than twice as high as the Norwegian rules would permit.
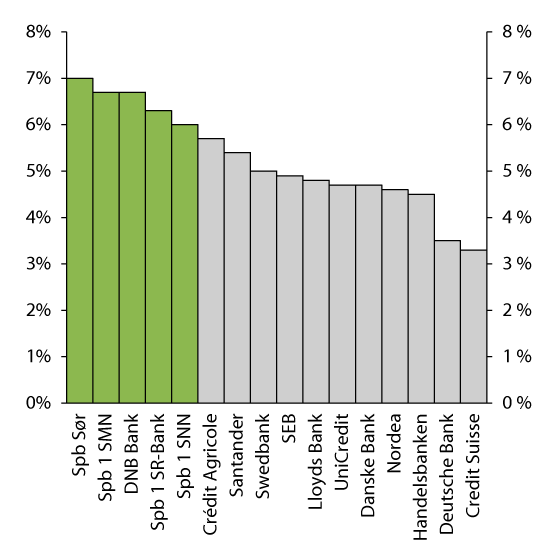
Figure 3.12 Leverage ratios of selected European banks at the end of 20151
1 The leverage ratios are taken from the banks’ annual reports. Some banks may have applied slightly different definitions of this indicator.
Source Finanstilsynet
A new floor rule may contribute to more uniform practice across countries, and more accurate minimum requirements. In last year’s financial markets report, the Ministry of Finance discussed the Basel Committee’s work on a new floor rule to replace the current – varyingly applied – Basel I floor; see Box 3.5 of the Financial Markets Report 2014. In the box, the Ministry referred to the fact that Deutsche Bank had calculated the effects of a new floor rule based on one potential variant of the rule (the Basel Committee had not formulated the rule in detail in its consultation document). Figure 3.10 reproduces the results for the major Nordic banks, and again shows that the Norwegian bank has the highest solvency when a floor is set for the value of the risk-weighted assets.
The EU is planning to introduce a non-risk-weighted capital requirement, referred to as the leverage ratio requirement. This requirement is likely to be defined as a bank’s tier 1 capital8 as a percentage of a non-risk-weighted exposure measure comprising total assets and certain non-balance sheet items. The leverage ratio provides a simple and easily comprehensible picture of a bank’s capacity to absorb losses, but provides little information on risk. Nonetheless, studies have shown that it may be a better indicator of bank performance during financial crises than risk-weighted measures of solvency.9
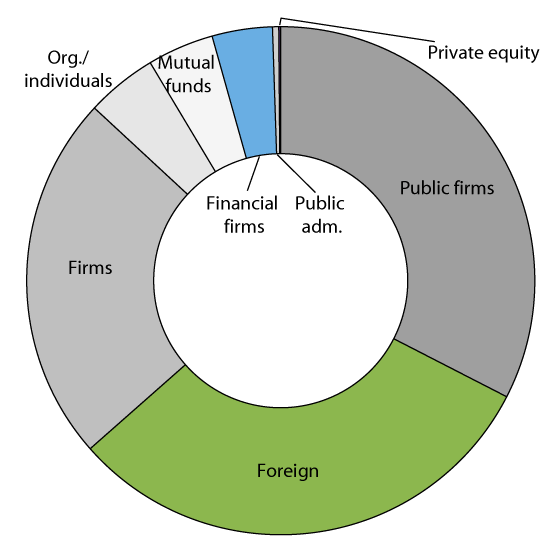
Figure 3.13 Owners of shares issued by non- financial undertakings registered in VPS at the end of 2015
Source SSB
According to EU plans, a leverage ratio requirement may be introduced effective as of 1 January 2018, as a supplement to the risk-weighted requirements. The Ministry of Finance has circulated for comments a draft version of a Norwegian leverage ratio requirement of 6 percent for banks (and 3 percent for mortgage companies). It will be permissible to use the same tier 1 capital to meet both this requirement and the risk-weighted capital requirement, and generally only one of the requirements may constitute the effective minimum tier 1 capital requirement for a given bank. In principle, a leverage ratio requirement of around 6 percent will not require Norwegian banks to hold more tier 1 capital; see Figure 3.11. In setting the leverage ratio requirement, the Ministry will seek to find a level which in principle does not increase capital requirements faced by Norwegian banks. Figure 3.12 shows that Norwegian banks have high leverage ratios compared to selected banks in other European countries.
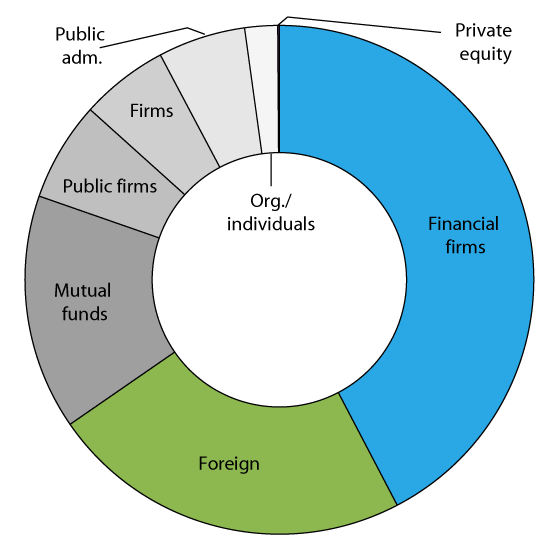
Figure 3.14 Owners of bonds and certificates issued by non-financial undertakings registered in VPS at the end of 2015
Source SSB
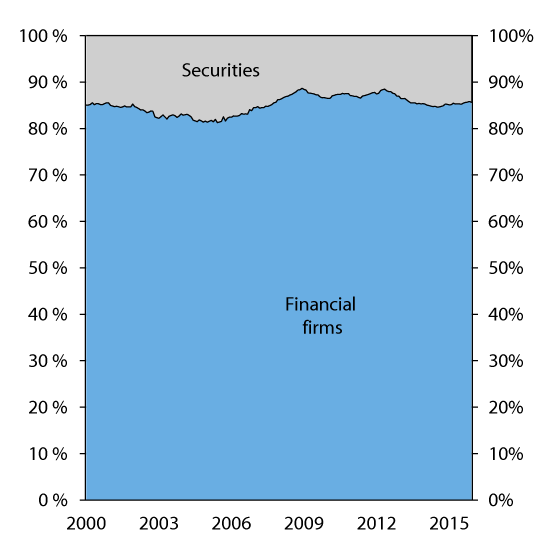
Figure 3.15 Gross domestic debt of non-financial undertakings – main sources
Source SSB
Under the current CRR/CRD IV framework, banks in the EU/EEA are required to report on and publish their leverage ratios together with information on their compliance with the risk-weighted capital requirements.10 This makes it easier for market participants and other parties to compare the solvency ratios of different banks. Norwegian banks perform well in such comparisons. However, market participants also emphasise official requirements, and strict requirements in real terms promote market confidence in the banking sector’s solvency.
A leverage ratio requirement which is materially higher than the requirements currently being discussed in the EU will clearly signal that Norwegian banks hold substantial amounts of high-quality capital.
The Ministry of Finance will continue its efforts to make visible the solvency of Norwegian banks vis-à-vis customers, market participants, analysts and others. This work is made easier by the fact that studies and comparisons of the true solvency of European banks consistently show that Norwegian banks are among the most solvent in Europe, particularly when more conservative and robust solvency indictors, in which banks’ own assumptions play a lesser role, are applied.
3.4 Access to capital for Norwegian businesses
3.4.1 Source of capital
Equity accounts for approximately 40 percent of the financing of the companies listed on the Oslo Stock Exchange. The remainder comprises various forms of debt. Figure 3.13 shows VPS-registered owners of capital in the form of shares at the end of 2015. The public administration and foreign nationals owned some 30 percent each, while other Norwegian undertakings owned approximately one-quarter. Norwegian securities funds and financial undertakings accounted for around 4 percent each, while investment companies and private equity funds owned 0.13 percent. Although their ownership share is very small, investment companies and private equity funds can play an important role in the financing of, for example, start-ups, and can support restructuring in the business sector.
About 4 percent of the shares listed on the Oslo Stock Exchange are held by Norwegian private individuals. The Government is of the view that private Norwegian ownership should be boosted as part of improving the competitiveness of the Norwegian business sector.11 It should be more profitable to start businesses, work, save and invest, and the Government is working to strengthen private ownership through a broad set of measures. These include changes to the tax system, simplification of requirements and regulations, investment in research and the facilitation of increased entrepreneurship. The Government is also following up on the Storting’s petition resolutions relating to employee co-ownership and accounts for long-term share investment (KLAS),12 and working on a new white paper on industrial policy.
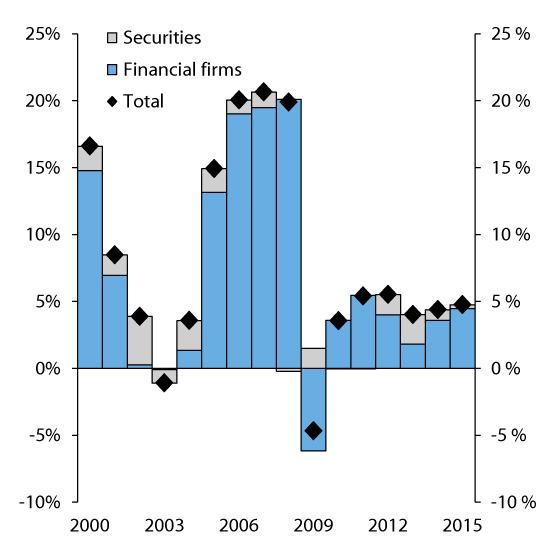
Figure 3.16 Growth in gross domestic debt of non-financial undertakings
Source SSB
Figure 3.14 shows the owners of debt instruments (bonds and certificates) issued by non-financial undertakings as at the end of 2015. The holdings of Norwegian financial undertakings and securities funds are larger in this context – 42 percent and 23 percent, respectively. As in many other European countries, however, bank loans are the most important source of credit for businesses in Norway. More than 80 percent of non-financial undertakings’ domestic debt is held by banks and other financial undertakings; see Figures 3.15 and 3.16. This proportion has been relatively stable over time. The bond and certificate markets are discussed further in chapter 2.3.6.
Textbox 3.2 Innovation Norway, Export Credit Norway and the Norwegian Export Credit Guarantee Agency (GIEK)
Innovation Norway is owned by the Ministry of Trade, Industry and Fisheries and county authorities, and has a broad mandate. Its core task is to promote value creation by stimulating commercially and socially profitable business development all over Norway. Innovation Norway provides financing, skills-building, advisory, networking and promotional services. In 2014, Innovation Norway distributed NOK 6.1 billion in loans, grants and similar support measures to businesses, funded by allocations from ministries, county authorities and other public enterprises. This support helped release both substantial investment by businesses themselves and other financing, resulting in the investment of some NOK 15.7 billion in relevant innovation activities in 2014.
Export Credit Norway is owned by the Ministry of Trade, Industry and Fisheries, and provides loans to Norwegian and foreign businesses which purchase goods and services from Norwegian exporters. Export Credit Norway issues so-called Commercial Interest Reference Rate (CIRR) loans and CIRR-qualified market loans on commercial terms. CIRR loans are fixed-rate loans granted in accordance with the OECD Arrangement on Officially Supported Export Credits. All loans provided by Export Credit Norway must either be guaranteed by a state export guarantee institution and/or a financial institution with a good credit rating, or be otherwise secured in accordance with Export Credit Norway’s credit policy. At the end of 2015, Export Credit Norway’s lending balance totalled approximately NOK 76.5 billion.
The Norwegian Export Credit Guarantee Agency (GIEK) is a subordinate body of the Ministry of Trade, Industry and Fisheries, and is mandated to promote Norwegian exports and investments abroad by issuing guarantees on behalf of the Norwegian State. GIEK primarily provides guarantees to undertakings which make loans to purchasers of Norwegian export goods and services, and in doing so assumes the risk of purchaser non-payment. GIEK also issues building loans and energy guarantees, and performs a number of administrative tasks. GIEK’s guarantee schemes, including any primary capital, must break even in the long run, and guarantees are generally issued on terms identical to those offered by banks in the commercial market. At the end of 2015, GIEK’s outstanding guarantee liability under all schemes totalled around NOK 100 billion.
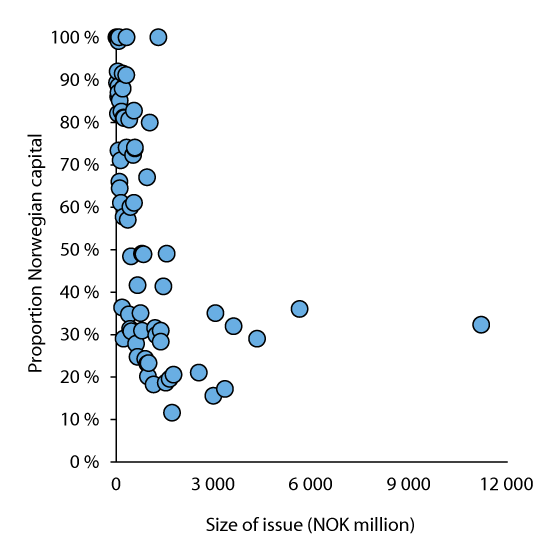
Figure 3.17 Proportion of equity purchased by Norwegian owners in selected equity issues on Oslo Stock Exchange in the period 2011–2015
Source Norwegian Securities Dealers Association
In addition to the ordinary funding markets, various public schemes provide Norwegian businesses with capital. These include Innovation Norway and Export Credit Norway; see Box 3.2.
Surveys show that investors invest more in the equity of companies in their home states than implied by a globally diversified investment portfolio. This phenomenon – i.e. investors preferring to invest in “local” equity – is referred to as “home bias”. Although observable in Norway, surveys suggest that a “home bias” is not particularly strong among Norwegian investors.13
The Norwegian Securities Dealers Association has gathered data on the purchasers of equity instruments in selected (74) equity issues in the period 2011–2015, for companies on Oslo Stock Exchange. The equity portion purchased by foreign investors generally increased with the size of the issue; see Figure 3.17. In smaller issues (less than NOK 200 million), Norwegian owners provided the majority of capital, although there was a wide spread; see Figure 3.18. The figures suggest that equity issues by Norwegian businesses are attractive investment objects for foreign investors, but also that Norwegian private ownership is an important source of capital for Norwegian businesses, particularly those that have relatively modest market funding needs. Most businesses in Norway are significantly smaller than the listed businesses included in the two figures provided by the Norwegian Securities Dealers Association.
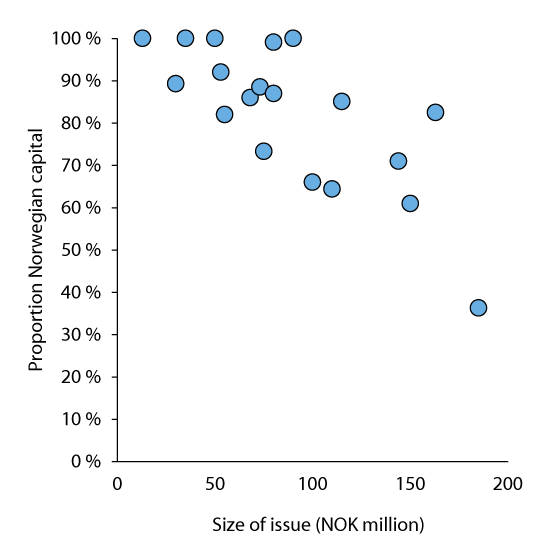
Figure 3.18 Proportion of equity purchased by Norwegian owners in selected smaller equity issues (less than NOK 200 million) on Oslo Stock Exchange in the period 2011–2015
Source Norwegian Securities Dealers Association
3.4.2 Stable and diversified credit supply
Economic growth capacity and value creation depend, among other things, on whether profitable projects and businesses in general have access to capital at prices which reflect the risk levels of individual undertakings. Norwegian businesses have varying access to capital from different sources. The Norwegian securities market is well-functioning, Norwegian financial undertakings are solvent, and Norway has appropriate public schemes for the financing of projects for which it is difficult to secure ordinary wholesale funding. Moreover, larger businesses obtain capital in foreign securities markets and from foreign financial undertakings. Together, the Norwegian supply side and integration with foreign markets give businesses access to a diverse range of financing options. New and smaller businesses may find supply to be more restricted and concentrated around Norwegian and local sources of capital.
The European Commission is seeking to strengthen the role of the securities markets in the financing of European businesses by establishing a so-called capital markets union. This measure is intended to give small and medium-sized businesses easier access to wholesale funding, and to encourage increased integration of European securities markets. The Government has responded positively to the Commission’s aims, including in a consultation statement from the Ministry of Finance.14 In its comments, the Ministry also pointed out that Norway and the other Nordic countries have well-developed bond markets, and that the Norwegian bond market is characterised by an efficient market structure featuring
low costs;
flexible, standardised and simple issuance and listing processes;
transparency in the secondary market; and
appropriate infrastructure and investor support functions, such as trustee services and digital trading platforms.
The Ministry also pointed out the role of the Norwegian high-yield bond market in meeting demand for cost-effective and simple non-bank financing. In January 2016, the Oslo Stock Exchange launched a new marketplace (Merkur Market) designed specifically for trading in shares and equity certificates issued by small and medium-sized businesses. Among other things, the listing requirements are less stringent than for ordinary listings. By the end of Q1 2016, equity instruments valued at approximately NOK 2 billion were listed on Merkur Market.
The securities markets may become a more important source of financing for Norwegian businesses in the years ahead, not least due to measures implemented as part of the EU capital markets union project. As shown above, however, bank financing is the most important source of credit for Norwegian businesses, and banks and other financial undertakings will remain key credit providers going forward. Solvency is a crucial prerequisite for banks to be able to extend credit to businesses and other borrowers. If solvency insufficiently reflects bank risk levels, there is a high risk that banks will have to cut back lending in future. As stated in section 3.3, the Government is focused on ensuring robust solvency throughout the supply side of the Norwegian banking market.
The EU capital requirements for banks (the CRR/CRD IV framework) contain a transitional provision on loans to small and medium-sized enterprises (SMEs) which provides for a reduction of approximately 24 percent in banks’ capital requirement linked to such loans. The provision is often referred to as the “SME discount”, and is to be evaluated by the EU shortly. The provision was included in the EU rules in response to the difficult economic situation in many European countries, and has not been implemented in Norway. Such a reduction in the capital requirement will not alter the actual risks associated with lending activities. Implementation of the provision may give SMEs easier access to bank loans in the short term, but this will not necessarily be the case if banks take the actual risks attaching to such loans into account. This type of reduction in the capital requirement may weaken bank solvency over time.
The most important contributions to good, stable capital access for Norwegian businesses are a solvent financial sector and well-functioning securities markets. It is particularly important that bank solvency is not diminished at times when the Norwegian economy has weaker growth prospects.
As well as being credit providers, banks are important financial advisers to Norwegian businesses. The advice and guidance banks give to customers and potential borrowers should include the suitability of different financing forms for different businesses, and how individual businesses should proceed to secure appropriate financing. Banks therefore often play an important role as a financial adviser, beyond the simple granting of credit.
3.4.3 Private pension savings as a source of investment capital
As at 2015, life insurance companies and pension funds were managing approximately NOK 1,200 billion on behalf of customers. A large proportion of this sum comprises assets intended to fund future pensions and may thus be suitable for long-term, less liquid investment. Infrastructure investments may in some cases be well suited to provide long-term, stable returns for life insurance companies and pension funds.
Insurance companies are generally prohibited from borrowing capital, and their assets therefore correspond to either customer claims or equity. While capital management is largely unregulated, the management of funds corresponding to customer claims is subject to quantitative restrictions – not least to maintain confidence in management – including requirements for investments to be adequately diversified and liquid. Norwegian insurance companies have previously pointed out that liquidity requirements may reduce investment in infrastructure by life insurance companies. In response, the Norwegian authorities facilitated increased investment of customer funds in infrastructure in 2011, among other things by establishing a separate asset class for infrastructure investments and generally reducing the liquidity requirement applicable to customer portfolios.
In 2012, the Ministry of Finance commissioned a survey of the regulation and scale of infrastructure investment by pension providers in Sweden, Finland, Denmark, Germany, the United Kingdom, Italy and France. The survey, which was conducted by Finanstilsynet, showed that these countries lacked a clear definition and overview of insurance company investments in infrastructure. Generally speaking, the scale of such investments appeared limited, and no country other than Norway had a regulatory provision granting especially broad permission to invest in infrastructure.
If entire industries are characterised by companies in which ownership is concentrated, institutional investors may find it difficult to secure a sensible stake in a given industry. Investors seeking control of a limited stake may face particular difficulties. Accordingly, it is entirely possible that the general prohibition which prevents Norwegian insurance companies from owning more than 15 percent of the undertakings in which they invest may impact ownership by insurance companies. Some actors have claimed that it is challenging for insurance companies to achieve sensible ownership interests in the infrastructure sector solely by taking stakes of less than 15 percent.
Following the introduction of Solvency II, quantitative investment restrictions have been replaced by qualitative prudential requirements and capital requirements dependent on investment risk. In connection with the development of an EU capital markets union, the European Commission has given notice of changes in the Solvency II implementation provisions to encourage investment in infrastructure by insurance companies and pension funds. The changes include the establishment of a separate asset class for qualifying infrastructure investments, which will be assigned a lower risk classification than such investments would otherwise be given. This in turn will reduce the capital requirements applicable to such investments.
The Ministry of Finance will consider possible amendments of the regulatory framework to facilitate increased investment of private pension capital in infrastructure. This must be balanced with customer pension security.
Footnotes
The strong jump in HHI for residential mortgages and life insurance between 2002 and 2004 is linked, among other things, to the merger of DNB and Gjensidige NOR.
For example, all countries must have a so-called capital conservation buffer requirement of 2.5 percent in place no later than 1 January 2019. The requirements applicable in Norway are also to be increased beyond what is shown in the figure. The buffer requirement applicable to systemically important banks is to be increased by one percentage point on 1 July 2016. The counter-cyclical capital buffer requirement will increase from 1 to 1.5 percent as of the same date.
Letter of 29 January 2016 from the Ministry of Finance to the European Commission.
The latter means that loans must be assigned higher risk weights when calculating a bank’s capital adequacy and capital requirements. Accordingly, if the supervisory authority has decided that the bank must apply more conservative assumptions in its internal models, capital adequacy may be lower for a given undertaking and a given volume of bank capital.
See for example Box 2.9 in the Financial Markets Report 2011 for a discussion of the benefits and costs of higher bank capital. Note also that the Modigliani-Miller theorem, which states that cost increases due to higher capital are countered by lower required rates of return on capital and lower borrowing rates, may become more applicable as new rules on the treatment of banks in crisis are adopted and implemented. The EU Crisis Management Directive contains, among other things, rules designed to ensure that bank owners and investors bear the majority of losses suffered by banks in crisis.
For example, more solvent banks may have to pay more for their borrowings than indicated by the risk involved, while less solvent banks may get away with paying a lower rate of interest than investors should actually receive in view of the risk they assume.
See for example Box 3.4 and Box 3.5 in the Financial Markets Report 2014, section 3.4.2 of the National Budget 2016 and section 2.4.2 of the Financial Markets Report 2013.
This is a somewhat wider term than CET1 capital.
See Norges Bank’s Financial Stability Report 2015 and e.g. Haldane, Andrew and Vasileios Madouros (Bank of England), “The dog and the frisbee”, prepared for the Federal Reserve’s symposium at Jackson Hole on 31 August 2012.
Currently, the EU regulations do not contain a final definition of the leverage ratio, and the relationship between the reported figures and the final definitions is still somewhat unclear.
See the discussion in the Government’s political platform (the Sundvolden platform) and the white paper Diverse and value-creating ownership (Meld. St. 27 (2013–2014)).
Resolution nos. 398 and 399 (2014–2015) of 5 February 2015. The Government will consider the two questions together and come back to the Storting at a later date.
See for example Figure 4 in Shinagawa, Yoko (2014), “Determinants of Financial Market Spillovers: The Role of Portfolio Diversification, Trade, Home Bias, and Concentration”, IMF Working Paper. The figure shows that investor “home bias” is higher in certain other countries, including Denmark and Sweden, than in Norway.
Letter of 13 May 2015 from the Ministry of Finance to the European Commission.