7 MOOC participants
One important driving force behind the MOOC development has been a concurrent development in available technology and demand for higher education. This has facilitated web-based education for more students. 46 % of US college students who have graduated over the last ten years, participated in web-based education at some time during their study. 39 % of all adults who have participated in web-based education feel that the value of their education is equal to that of traditional campus education. A recent survey shows that 49 % of all Americans and 61 % of everybody in the age group 18–30 years, are of the opinion that the quality of web-based education is commensurable to the quality of campus education.1
At the same time, a survey from 2013 among nearly 110 000 undergraduate students at universities in 47 American states and 14 countries has shown that very few have participated in a MOOC over the last year. The share was three per cent in the US, four per cent in Canada and six per cent among students from the rest of the world. Nearly 75 % of students in the study did not know what a MOOC was.2
7.1 Who are the participants?
MOOCs are still very popular. The number of courses and institutions offering courses have increased significantly. Even if few courses have more than 100 000 participants, as some of the first courses had, there are still several xMOOCs with between 20 000 and 60 000 participants.3
There is a limited amount of data available on participants in MOOCs and their backgrounds. A review of literature that mapped peer-reviewed articles on MOOCs during the 2008–2012 period included 45 articles. Some of these articles concerned the participants’ background and experiences, but they all had a limited data basis. Much of the knowledge we currently have on MOOC participants, originates from the large MOOC providers, and are often published as infographics on the providers’ blogs.
One exception is recently published data from MITx and HarvardX from the courses offered on edX in 2012 and 2013. The data, which originates from a total of nearly 850 000 participants, will be used as a basis for a comprehensive research project carried out jointly by the two institutions. In the initial reports from the project, the data were analysed separately for each course, and one of the researchers’ conclusions is that there are significant variations in the average demography across the courses. This applies to gender, education, age and nationality. The researchers concluded that the most typical MOOC participant was male, 26 years or older, and had a bachelor’s degree. At the same time, this demography represented fewer than one out of three students.4

Figure 7.1 Participants in MOOCs by highest completed education, January 2013. Coursera1
1 Universities UK (2013) Massive Open Online Courses: Higher Educations Digital Moment? Available from: http://www.universitiesuk.ac.uk/highereducation/ Documents/2013/MassiveOpenOnlineCourses.pdf (Retrieved: 11 December 2013).
A report from early 2013 also concluded that MOOC participants are a far more heterogeneous group than those who pursue a traditional degree: some already have a career and want a refill of knowledge, some are researchers who want to use open digital learning resources (OER) in their own teaching, some acquire new knowledge on a hobby basis, some are future students, while others are students in higher education.5 In October 2013, the University of Pennsylvania published the highlights of a survey they had carried out among students participating in the 32 MOOCs offered by the university through Coursera. The data include nearly 35 000 students from more than 200 countries and territories, and show that most course participants were highly educated men who were taking MOOCs to develop their career. The participants generally had a considerably higher level of education than what is the norm in the country or territory they were from. This tendency was particularly strong for participants from Brazil, Russia, India, China and South Africa, where almost 80 % of course participants were from the richest six per cent of the population.6
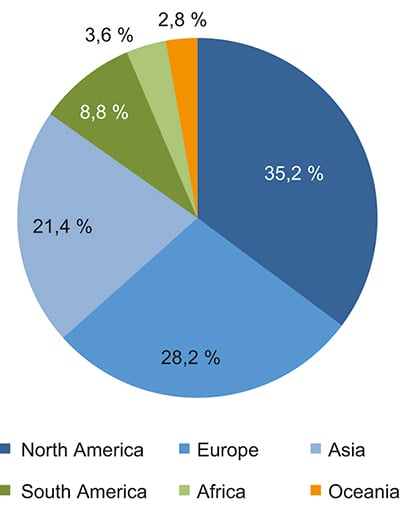
Figure 7.2 Participants in MOOCs by continent, January 2013. Coursera1
1 Universities UK (2013) Massive Open Online Courses: Higher Education’s Digital Moment? Available from: http://www.universitiesuk.ac.uk/highereducation/ Documents/2013/MassiveOpenOnlineCourses.pdf (Retrieved: 11 December 2013).
Coursera and the other major platforms have repeatedly published statistics on the education background of those who participate in their MOOCs.
Data from Coursera shows that course participants come from all over the world, but that the majority are located in North America, Europe and Asia, cf. Figure 7.2. Corresponding data from edX and Canvas largely support this impression.
7.2 Motivation for taking MOOCs
Researchers at Duke University have analysed data from the first MOOCs that were offered by the university. The data show that the MOOC participants’ motivation for enrolling in courses can be grouped into four different categories:7
Life-long learning or a desire to achieve understanding of a subject without any particular expectation of completing or documenting competence
for entertainment, a desire to gain social experience and intellectual stimulation
for practical purposes, often because more traditional education options are limited
to test web-based education.
15 % of the participants used the course to decide whether they wanted to enrol in traditional university programmes, while ten per cent felt that they could not afford the alternative, i.e. traditional education.
Edinburgh University has had the same kind of experience. The main argument for the majority of the participants at the university’s six initial courses was curiosity to find out more about MOOCs and web-based learning, as well as the desire to learn more about a new subject. Career and documentation were less important as motivation. The participants’ motivation was clearly more geared toward exploration than a means to an end.8
7.3 Participants’ involvement in MOOCs
Based on three MOOCs in computer science, Stanford’s Lytics lab has identified four main groups of participants:9
auditing learners: follow the lectures, but are otherwise not active
completing learners: complete most assignments in the course
disengaging learners: complete assignments at the start of the course, but disengage in whole or in part during the course
sampling learners: exploring the course by testing parts of the content.
The courses that formed the basis for the analysis were at three different levels: upper secondary (high school), undergraduate studies and graduate studies. The number of students falling within the four different categories varied between the three courses. The upper secondary-level course had a considerably higher number of completing learners (about 25 per cent) than the two other courses (about five to ten per cent).
Phil Hill has developed a similar four-category grouping. Hill distinguished between active participants who e.g. take the entire course and take part in discussions, passive participants who follow the course content, but do not participate actively beyond that, drop-ins who only follow parts of the course, and observers who merely observe and test certain parts.10
Vanderbilt University in the US has similar experience with its three first MOOCs. The smallest of the three courses had 23 000 attendees, the largest had 43 000 attendees. In the largest course, 78 % watched one or more videos. In the two other courses 90 % watched one or more videos. The more work and effort that was needed in the various types of assignments in the course, the fewer people took part. In one course, seven per cent received a completed course confirmation, in the two others this was 15 and 16 %. Data from these courses e.g. shows that differences in background and knowledge are much more prevalent than in traditional courses. Vanderbilt believes it can conclude that MOOC participants are motivated, but that there are significant differences in motivation between different groups of participants. Furthermore, the experiences from Vanderbilt show that MOOC participants to a large extent also make use of the opportunities provided by technology to produce their own work as well.11
Edinburgh University was the first university in the UK to offer Coursera courses. The university has analysed data from more than 300 000 people who enrolled in the initial six MOOCs offered by the university.12 Even if the courses were offered through Coursera, these courses were educationally closer related to cMOOCs, with use of videos and discussions on social media (e.g. Google Hang-out). The university has carried out a survey among 45 000 students at the start of the courses and 15 000 at their conclusion. It is not possible to draw any clear-cut conclusions from these data. However, certain common features are evident.
Firstly, they discovered a considerable drop in participation in all courses from registration to the first week of the course. Out of the total of 300 000 who enrolled, 42 % were active during the first week of the course. In week three, a total of 40 000 assignments were submitted. In week seven this had dropped to about 10 000 assignments. However, participation patterns after course start varied significantly between the six courses. The main reasons for participating were curiosity as regards MOOCs and web-based learning, as well as a desire to learn new subjects. Career and documentation were less important motivation factors. In other words, they discovered, as in other analyses, that the students’ motivation was clearly more explorative than a means to an end. Edinburgh University also found that the students were highly satisfied with the courses. Only three per cent of those who completed believed they had not benefited as desired.
Analyses of participant patterns show that the number of participants who complete MOOCs is low. The previously mentioned study from HarvardX and MITx found that around five per cent of course participants achieved a course certificate. The researchers behind the study were, however, convinced that a completion ratio at best was an insufficient measure of the value of MOOCs and the participants’ degree of success. According to the researchers, the data they have analysed show that many course participants were in fact highly involved in the courses without achieving a course certificate. According to the researchers, withdrawal from MOOCs is therefore not a sign that the courses have failed, but a natural result of an open, free of charge and asynchronous enrolment process where the participants themselves decide how long they want to attend. The researchers believe that it is natural to analyse MOOC participation based on the fact that the participants regard the content as web content that they want to “surf”, rather than courses they are going to complete.13 Stephen Downes, who was behind the first course called a MOOC, also believes that Stanford’s classification of the MOOC participants’ behaviour demonstrates that completion is a too narrow measure of whether MOOCs are suitable and effective. The reasoning behind this is that the measure overlooks the participants' motivation and reasons for attending. Many participate out of curiosity, rather than to achieve documentation of completed study.14
There is currently little information available on the learning effects of MOOCs. As mentioned above, there are indications that learning taking place in MOOCs has to be analysed in a different manner than learning taking place within the traditional education institutions. Andrew Ho, research director at HarvardX, believes that knowledge of learning in MOOCs will not be a result of conventional statistics;
Rather, our research describes an emerging learning ecosystem, one where enrolment can be casual and nonbinding, learning happens asynchronously, and registrants come from all countries in the world, with diverse intentions and patterns of learning.15
The Educause Center for Analysis and Research (ECAR) has carried out a study among students in undergraduate studies. The study found that students preferred forms of blended learning when they experimented with utilising MOOCs. The study showed that the students wanted face-to-face contact with academic employees, in spite of having the opportunity to contact them directly via the web. The results are in line with a recent meta-analysis that examines the effects of integrating technology in higher education.16
A survey carried out by Columbia University found that the fail percentage and withdrawal rate were significantly higher in a course offered online than a corresponding course offered with actual meeting points between the participants and academic employees (32 vs. 19 %). At the same time, San Jose State and edX found that the fail percentage fell from 45 to nine per cent in an experiment where elements from an online version of the course Circuits and Electronics were incorporated into the campus version of the course.
The analysis of the same course found a weak correlation between the number of posts contributed by participants in the course’s discussion forum and the result achieved by the course participants. This may indicate that learning outcomes improve along with involvement and participation in the course. San Jose State and edX also found that the time participants spent working independently in connection with the course had a considerably larger impact on outcomes than the time participants spent watching the course videos.17
The vast amounts of data from MOOCs and other learning platforms provide new opportunities for analysis and research on student learning. Learning Analyticsis an emerging field of research that revolves around analysing these data to improve learning and teaching. For example, one of edX’s goals is to carry out experiments to explore how students learn, and how digital tools and different teaching methods can improve learning.
According to the NMC Horizon Report, Learning Analytics will become one of the most important technological changes within education over the next five years. In Chapter 10, the Commission evaluates the opportunities offered by Learning Analytics.
Footnotes
Australian Trade Commission (Austrade) (2013) More than MOOCs: Opportunities arising from disruptive technologies in education. Available from: http://www.austrade.gov.au/ Education/News/Reports/More-than-MOOCs--Opportunities-arising-from-disruptive-technologies-in-education (Retrieved: 11 December 2013).
Dahlstrom, Eden et al. (2013) ECAR study of Undergraduate Students and Information Technology. Available from: https://net.educause.edu/ir/library/pdf/ERS1302/ ERS1302.pdf (Retrieved: 11 December 2013).
Universities UK (2013) Massive Open Online Courses: Higher Educations Digital Moment? Available from: http://www.universitiesuk.ac.uk/highereducation/ Documents/2013/MassiveOpenOnlineCourses.pdf (Retrieved: 11 December 2013).
Campus Technology (2014) Inside the First-Year Data From MITx and HarvardX. Available from: http://campustechnology.com/articles/2014/01/27/ inside-the-first-year-data-from-mitx-and-harvardx.aspx (Retrieved: 28 April 2014).
Universities UK (2013) Massive Open Online Courses: Higher Educations Digital Moment? Available from: http://www.universitiesuk.ac.uk/highereducation/ Documents/2013/MassiveOpenOnlineCourses.pdf (Retrieved: 11 December 2013).
Fowler, Geoffrey A. (2013) Survey: MOOC Students Are Elite, Young and Male. Available from: http://blogs.wsj.com/digits/2013/11/20/survey-mooc- students-are-elite-young-and-male-2/ (Retrieved: 11 December 2013).
Belanger, V. & Thronton, J. (2013) Bioelectricity: A Quantitative Approach – Duke University’s First MOOC. Available from: http://dukespace.lib.duke.edu/dspace/bitstream/ handle/10161/6216/Duke_Bioelectricity_ MOOC_Fall2012.pdf (Retrieved: 11 December 2013).
University of Edinburgh (2013) MOOCs @ Edinburgh 2013 – Report #1. Available from: http://www.era.lib.ed.ac.uk/bitstream/1842/6683/1/ Edinburgh%20MOOCs%20Report%202013%20%231.pdf (Retrieved: 11 December 2013).
Kizilcec, René et al. (2013) Deconstructing Disengagement: Analyzing Learner Subpopulations in Massive Open Online Courses. Available from: http://lytics.stanford.edu/deconstructing-disengagement/(Retrieved: 11 December 2013).
Hill, Phil (2013) Emerging Student Patterns in MOOCs: A Graphical View. Available from: http://mfeldstein.com/ emerging_student_patterns_in_moocs_graphical_view/ (Retrieved: 11 December 2013).
Bruff, Derek (2013) Lessons Learned from Vanderbilt’s first MOOCs. Available from: http://cft.vanderbilt.edu/2013/ 08/lessons-learned-from-vanderbilts-first-moocs/ (Retrieved: 11 December 2013).
University of Edinburgh (2013) MOOCs @ Edinburgh 2013 – Report #1. Available from: http://www.era.lib.ed.ac.uk/bitstream/1842/6683/1/ Edinburgh%20MOOCs%20 Report%202013%20%231.pdf (Retrieved: 11 December 2013).
Reich, J. and Ho A. (2014) “The Tricky Task of Figuring Out What Makes a MOOC Successful”, The Atlantic, 23. January 2014. Available from: http://www.theatlantic.com/ education/archive/2014/01/the-tricky-task-of-figuring-out- what-makes-a-mooc-successful/283274/(Retrieved: 29 April 2014).
E-Literate (2013) Insight on MOOC student types from ELI Focus Session. Available from: http://mfeldstein.com/ insight-on-mooc-student-types-from-eli-focus-session/ (Retrieved: 11 December 2013).
Reich, J. and Ho A. (2014) “The Tricky Task of Figuring Out What Makes a MOOC Successful”, The Atlantic, 23. January 2014. Available from: http://www.theatlantic.com/ education/archive/2014/01/the-tricky-task-of-figuring-out- what-makes-a-mooc-successful/283274/(Retrieved: 29 April 2014).
Dahlstrom, Eden et al. (2013) ECAR study of Undergraduate Students and Information Technology. Available from: https://net.educause.edu/ir/library/pdf/ERS1302/ ERS1302.pdf (Retrieved: 11 December 2013).
Fowler, Geoffrey, A. (2013) “An Early Report Card on Massive Open Online Courses”, The Wall Street Journal. Available from: http://online.wsj.com/news/articles/ SB10001424052702303759604579093400834738972 (Retrieved: 11 December 2013).