3 Overall Summary of the report «Evaluation of Active Management of the Norwegian Government Pension Fund – Global»
Written by the professors Andrew Ang, William N. Goetzmann and Stephen M. Schaefer
The objective of this report is to evaluate the role of active management in the Norwegian Government Pension Fund – Global («the Fund»). The project brief called for a review of the academic research on active vs. passive (index) management and the efficiency of markets, an historical analysis of NBIM’s track record, and a prospective analysis of how to use the Fund’s comparative advantages to benefit the management process.
In line with the brief, the report has three main sections. The first undertakes a review of the theory and empirical evidence on the Efficient Market Hypothesis [EMH]. If markets are completely efficient, active portfolio management has little potential to add to fund performance. Therefore, in assessing the potential role of active management for the Fund, it is important to reach a view on both the theoretical basis and empirical support for the EMH. The second contains a detailed empirical analysis of NBIM’s active performance in managing the Fund, identifying both the average returns in excess of benchmarks and the risks to which the Fund has been exposed. The analysis of performance differentiates between internally and externally managed funds and between different asset classes and strategies. The final part of the report looks at the implications of the first two sections for the future management of the Fund. In particular, it identifies the comparative advantages of the Fund and asks, in the light of the review of the theory and evidence on the EMH and the Fund’s performance, what types of portfolio strategies and performance benchmarks should be pursued.
The most recent expressions of the EMH in academic research recognize the existence of market frictions, information costs, agency, and capital structure constraints. In this setting there is no compelling theoretical or empirical evidence to recommend a pure strategy of passive indexing although finding active managers who consistently deliver excess risk-adjusted returns to investors is rare. In evaluating NBIM’s track record, we find that active management has played a very small role in its performance to date. The incremental contribution of active management has been slightly positive overall, with notable negative returns during 2008 and the early part of 2009. Analysis of NBIM’s active management style indicates that a significant component of performance is explained by exposure to systematic factors which fared very poorly during the financial crisis. We believe that exposure to such factors is actually appropriate for a long-term investor since the factors earn risk premiums over the long run, however, we recommend that, to the fullest extent possible, these factor exposures taken by active management be treated as part of the Fund benchmark. We propose a new framework to implement this change. In the same way the Fund has chosen to hold a significant position in equities to capture the equity risk premium over the long run, we recommend that other factor risk premiums be accessed by the Fund to generate long-term positive performance. The proposed framework exploits the Fund’s distinct long-horizon profile and allows the preferences of the asset owners to determine how much exposure to each risk factor should be taken.
Summary: Section I
In simple terms, the EMH asserts that, at all times, the price of a security reflects all available information about its fundamental value. A consequence of the theory is that, if true, it is impossible for an investment manager – and hence the clients of the manager – to consistently beat the market. The underlying principle driving the EMH is that, in a large, active marketplace for publicly traded securities, vigorous competition among scores of investors will drive speculative profits to zero. The implication of the EMH for investors is that, to the extent that speculative trading is costly, speculation must be a loser’s game. Hence, an indexing strategy is bound eventually to beat a strategy that uses active management, where active management is characterized as trading that seeks to exploit mispriced assets relative to a risk-adjusted benchmark. In the world of the EMH, there are no mispriced assets because the invisible hand of the marketplace moves faster than any single agent.
In Section I of the report we review the extensive theoretical and empirical literature on the EMH. Our review of theory indicates that the EMH has been refined over the past several decades to reflect the realism of the marketplace, including costly information, transactions costs, financing, agency costs, and other real-world frictions. The most recent expressions of the EMH thus allow a role for arbitrageurs in the market who may profit from their comparative advantages. These advantages may include specialized knowledge, lower trading costs, low management fees or agency costs, and a financing structure that allows the arbitrageur to undertake trades with long verification periods. The actions of these arbitrageurs cause liquid securities markets to be generally fairly efficient with respect to information, despite some notable anomalies. As a result, the balance between indexation and active management is a choice variable for which the optimum depends on general beliefs about the existence and potential of manager skill, the pricing opportunities afforded within a given market, the time preferences and risk aversion of the investor, and the expertise and incentive contract of the specific manager.
Our review of the empirical tests of the EMH is divided into two parts: tests on prices and tests on investment managers and institutions. Tests of the theory using past price behavior in the stock and bond markets have occasionally produced evidence contrary to the conclusion of efficiency, suggesting that the EMH may not hold for all markets and all times. The logical foundation for these tests is a pricing model that represents the «fair» price of a security in terms of its exposure to a set of common risk factors. The simplest of these models is the Capital Asset Pricing Model [CAPM], and the most commonly used in recent times is a multi-factor model called the Arbitrage Pricing Theory [APT]. The APT holds that the investor will be compensated by higher returns for accepting the risk implied by exposure to these factors.
Both the CAPM and the APT stress the important role that risk factors play in determining the expected future return of investment in an asset. Tests of the EMH in this framework are implicitly joint tests of the pricing model and market efficiency, however. Much recent debate has focused on whether such violations should be interpreted as inefficiency, or simply the inability of researchers to correctly identify and specify the risk factors relevant to the market. Regardless, violations of the EMH based on pricing tests are of potential interest to the Fund because they may indicate sources of returns – whether these are factor-based or based on the pricing inefficiency.
If the benchmark is solely a market-weighted portfolio consisting of all traded securities, then active management (defined as deviations from these market weights) may be useful in accessing factor risk premiums which are not captured by market exposure. In the context of the APT this could also be interpreted as passive exposure to additional risk factors. Theory and empirical evidence suggests that investors are compensated for taking systematic risks – such as investing in «value» stocks vs. «growth» stocks and volatility risk – over the long term. In the presence of these multiple systematic risk factors, empirical tests overwhelmingly reject that the market portfolio is efficient and other static or time-varying combinations of assets result in higher reward-to-risk ratios.
The back-tests of trading strategies seeking pure alpha have suggested a wide array of potentially profitable investments. However, for a number of reasons these provide limited guidance to the Fund going forward. They represent simulated, not actual, returns and do not account for actual transactions costs, fees, and price impact. They also suffer from potential data-mining biases. Changing market conditions, including time-varying arbitrage activity, make it difficult to extrapolate future performance. Finally, many anomalies are not scalable and cannot be implemented in the large position sizes relevant to the Fund.
The second part of Section I reviews tests of the EMH using information on managers and institutions. These are more relevant to the Fund since they reflect the necessary role of an investment intermediary. Unfortunately, many of the studies of managerial skill focus on retail mutual funds, whose cost structure and value proposition differ markedly from the Fund’s, and thus may not be a useful benchmark. Recent theory and empirical evidence suggests that some fund managers may have talent and out-perform market benchmarks before fees. However, the evidence does not support the conclusion that superior ability filters through to the ultimate investors in those funds. In the mutual fund industry, after-fee returns and alphas are, on average, zero or negative. While the average mutual fund typically underperforms a passive portfolio on an after-fee risk-adjusted basis, there is evidence that some managers are better than others.
Turning to the non-retail sector, there is some evidence of positive post-fee risk-adjusted returns in hedge funds where highly paid managers actively trade marketable securities. One caveat is that the quality and duration of these data, as well as the changing institutional marketplace for hedge fund services make it difficult to extrapolate such conclusions to future performance. By contrast, there is little convincing evidence of superior risk-adjusted returns to private equity and venture capital. Although some studies suggest skill persistence, the current data are not conclusive on this point. In the real estate sector there is simply not enough information to evaluate whether managers have added value on a risk-adjusted basis.
In other institutional investment sectors, such as large-scale endowments, pension funds and sovereign funds, there is even less evidence about the capability of active management to generate positive risk-adjusted returns. Some U.S. endowments performed exceedingly well prior to the recent crisis using alternative investments as the basis for their strategy. It is often noted that a long-horizon perspective allowed these endowments to focus on alternative asset classes. Most research suggests that pension fund managers are not able to identify top managers ex ante and the managers that serve the pension fund sector show little evidence of skill on a risk-adjusted basis. The few studies of sovereign fund trades in public securities provide evidence that, while stock prices respond positively when a sovereign fund invests, the long-term performance of these investments is not particularly good.
In summary, the EMH has been refined over the past several decades to reflect information, transactions, financing and agency costs. Tests of the theory on prices have produced violations suggestive of the potential for active management to add value to a multi-asset portfolio, but finding consistent out-performing active managers is difficult.
Summary: Section II
Section II evaluates NBIM’s historical track record of active management. It is based on quantitative analysis of data provided by NBIM and meetings with NBIM personnel to discuss their general strategy and philosophy of active management. We analyze quantitative data on performance for the whole Fund, the two asset class divisions fixed income and equities, and internal and external active management within each asset class division for the period from January 1998 to September 2009 at the monthly frequency.
In our view NBIM is set up to provide two services to its client, the people and future generations of Norway. First, it offers «passive» returns based on the benchmark from the Ministry of Finance. The components of this benchmark are determined by the desire to efficiently diversify the overall portfolio. The benchmark takes the form of a portfolio allocation by region and asset class and is intended to be a potentially tradable portfolio of securities, as opposed to a hypothetical benchmark. As such, it represents a realistically feasible alternative to active management. NBIM seeks to offer this benchmark return in an operationally secure and transparent manner at lowest possible cost to the client.
Second, NBIM offers active management that seeks to add positive, risk-adjusted return over the benchmark net of fees. NBIM pursues this goal through a combination of internal and external management, and a philosophy of outsourcing many aspects of its back-office operations. Thus, it has internal portfolio managers and traders as well as a number of external investment managers whom it engages via specific mandates tied to pre-determined benchmarks.
NBIM implements active management in two main ways. The first is the decision to deviate from long-term strategic loadings on factors (e.g. a temporary shift from the target allocation to equities) and second, the decision to hold securities in weights that differ from factor benchmark weights based on fundamental analysis. These roughly correspond to timing and selection, where the default, or the baseline case, is the Fund benchmark. This approach is employed for both internally and externally managed funds. Fundamental analysis and factor exposure operate quite differently: the former looks at investment opportunities from the «bottom-up» by finding attractive companies and securities and then aggregates to the portfolio level whereas the latter is a «top-down» investment technique that first chooses different factors and then implements them by trading securities. Given NBIM’s stated approach to generating value, it is natural to ask whether NBIM has the capability of internally generating value as well as identifying external managers who add value. Our quantitative analysis addresses this question.
We define the «active return» of a fund, i.e., the part of the return that measures the contribution of active management, to be the difference between the return on the portfolio and the return on the corresponding benchmark. Thus, if the Fund were to hold the benchmark, the active return would be zero.
An alternative measure of the contribution of active management is the intercept, or «alpha», in a regression of returns on the benchmark. This measure and the average active return will be equal when the beta of the portfolio relative to the benchmark is one. In the case of the Fund the betas are in most cases very close to one but we nevertheless focus on the active return rather than alpha since a deviation in beta from one is also an active decision by the manager.
We address the question of whether the fund has been successful in its active management activities. Figure 3.1 plots cumulated active returns on the overall Fund, which are cumulated sums of the monthly active returns from the beginning of the sample (January 1998). Units on the y-axis are in percentages. The cumulated active returns generally trend upwards strongly and start declining precipitously at the beginning of 2008. Thus, there seems to be a break around the beginning of 2008. In our analysis we investigate the sample period up to December 2007 (the «pre-2008 sample») separately from the whole sample, where the last few months include the global financial crisis. Mindful of the biases which may result from conditioning on a particular «end-point», we also conduct analysis using information up to each date in the sample only.
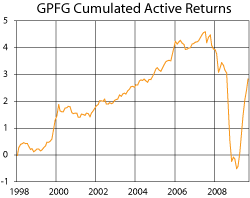
Figure 3.1 Cumulated Active Returns on the Overall Fund
Table 3.1 below reports the average value of the active return for the total Fund and for the fixed income and equity sub-portfolios. Over the whole sample the active return on the total portfolio had a mean of 0.02% per month and the p-value, which tests whether this is equal to zero, is 0.57. Thus we cannot find any statistical evidence of significant active outperformance over the sample taken as a whole. In contrast, prior to 2008 the mean active return was 0.03% per month and this is highly significant. Note that even though this is statistically significant, the absolute value of the active return added to the fund, and thus the economic contribution, is relatively small.
Table 3.1 Average Returns to Active Management
| Total fund | Fixed Income | Equity | ||||
|---|---|---|---|---|---|---|
| Full Sample | Pre-2008 | Full Sample | Pre-2008 | Full Sample | Pre-2008 | |
| Mean | 0.02% | 0,03% | 0.00% | 0.01% | 0.05% | 0.06% |
| P-value | 0.56 | 0,01 | 0.98 | 0.45 | 0.08 | 0.02 |
Within the overall portfolio, the results for fixed income and equity are quite different. For fixed income, the mean active return is zero for the full sample and 0.01% per month for the period prior to 2008. Neither is significantly different from zero and so there is no evidence that active fixed income management has added value. In contrast, the corresponding results for equity are 0.05% per month for the full sample and 0.06% per month for the pre-2008 period. While both are still relatively small, the latter is highly significant and the former marginally significant. Active management of the equity portion of the Fund has, in a small way and on average, added value since the inception of the Fund.
We next address the question of how much impact active management has had on the overall risk taken by the fund. Table 3.2 below reports the fraction of the overall variance of fund returns that is attributable to variability in the benchmark and to active management (the active return). As in Table 3.1, results are given for the total Fund and for the fixed income and equity sub-portfolios and for both the whole period covered by the data (January 1998 to September 2009) and the period up to December 2007.
Table 3.2 Variance Attribution of Fund Returns
| Total fund | Fixed Income | Equity | ||||
|---|---|---|---|---|---|---|
| Full Sample | Pre-2008 | Full Sample | Pre-2008 | Full Sample | Pre-2008 | |
| Benchmark Return | 99.1% | 99.7% | 97.1% | 99.8% | 99.7% | 99.7% |
| Active Return | 0.9% | 0.3% | 2.9% | 0.2% | 0.3% | 0.3% |
| Total Return | 100.0% | 100.0% | 100.0% | 100.0% | 100.0% | 100.0% |
The results are striking and among the most important in this report: for the full sample, including the crisis, the active management activities of the Fund account for less than one percent of the overall variance. Excluding the crisis, this figure falls to a miniscule 0.3%. For the fixed income sub-portfolio, where many of the most extreme events in the crisis have been located, the figure including the crisis is still only 2.9%. The implication of this result is that, compared with the choice of benchmark, active management has an almost trivially small impact on the overall risk of the Fund. Table 3.2 shows that, to a first approximation, the Fund is more similar to an index fund than an actively managed fund.
In fact, we find that a significant part of even the very small component of the total Fund return represented by active return is linked to a number of well-recognized systematic factors. Thus the contribution of active management to the overall return that is genuinely idiosyncratic is extremely small indeed.
Our choice of factors is affected by three considerations. First, we select factors that are recognized as having significant pricing effects by the academic literature and industry practice. Second, the set of factors must be parsimonious and third, the factors must have benchmarks that as far as possible can be traded in large size relevant to the Fund and exist since January 1998 (start of the Fund returns). The ten factors that we use are shown in Table 3.3 below.
Table 3.3 Factors used in Analysis of Active Returns
| TERM | Difference between long- and short-maturity U.S. Treasury bond returns |
| CREDITAa | Difference between Aa and Treasury bond returns |
| CREDITBaa | Difference between Baa and Aa bond returns |
| CREDITHY | Difference between high yield and Baa bond returns |
| FXCARRY | Captures the carry trade of investing in currencies with high interest rates and shorting currencies with low interest rates |
| LIQUIDITY | Reflects periods of high and low liquidity |
| VALGRTH | Difference in returns between “value” stocks and “growth” stocks |
| SMLG | Difference in returns between small and large stocks |
| MOM | Captures the momentum effect of going long U.S. stocks with past high returns and short stocks with past low returns |
| VOL | Captures differences between implied and realized volatility |
These factors capture the main systematic factors that have been identified in the literature as having significant explanatory power for the variation in the returns or their mean value, or both. The factors span the main dimensions of risk in financial markets, apart from the return on the market portfolio which is captured in the benchmark.
Table 3.4 shows the partial correlation between the factors listed in Table 3.3 and the active return in fixed income (left-hand panel) and equity (right-hand panel). For fixed income the equity related factors of VALGRTH, SMLG, and MOM are excluded. Similarly the fixed income related factors TERM etc. are excluded for the equity sub-portfolio.
The results reveal a highly important feature of the Fund’s active returns. Both the fixed income and equity active returns are strongly related to many of the factors and this implies that a significant fraction of even the very small active return component of total returns could be replicated by a small number of portfolios constructed to mimic the behavior of the factors in Table 3.3. In fact, approximately 70% of all active returns on the overall Fund can be explained by exposures to systematic factors over the sample. It is appropriate that the Fund has exposure to these factors: these are associated with risk premiums that the Fund, as a patient investor, can seek to harvest over time, just in the way that, with an exposure to the market portfolio, it has sought to harvest the equity risk premium.
Table 3.4 Exposure of Active Returns to Systematic factors
| Fixed Income | Equity | |||
|---|---|---|---|---|
| Partial Corr | P-value | Partial Corr | P-value | |
| TERM | -0.21 | 0.01 | ||
| CREDITAa | 0.35 | 0.00 | ||
| CREDITBaa | -0.33 | 0.00 | ||
| CREDITHY | -0.01 | 0.92 | ||
| FXCARRY | -0.04 | 0.64 | ||
| LIQUIDITY | 0.35 | 0.00 | ||
| VALGRTH | -0.56 | 0.00 | ||
| SMLG | 0.41 | 0.00 | ||
| MOM | 0.02 | 0.80 | ||
| VOL | 0.37 | 0.00 | 0.28 | 0.00 |
An important question for the risk management of the Fund is whether the very low active returns in 2008 could have been anticipated. The question is not whether they could have been accurately predicted – the answer to this is almost certainly «no» – but whether the possibility of such damaging returns could have been envisaged and, further, whether the probability of this event could be calculated.
One way to answer this question is to fit a multi-factor model to returns, i.e., to estimate the sensitivity of the active returns to the factors in Table 3.3. What we find, perhaps surprisingly, is that using only data that would have been available at the time just prior to the period of very bad active returns in 2008, the very poor results following the collapse of Lehman could have been predicted to a significant extent conditional on the realizations of the factors in Table 3.3. This is true both using estimated factor exposures as of December 2007 for the whole fund and estimating factor exposures as data became available through 2008. There is some evidence that NBIM may have successfully altered factor exposures during the crisis and so avoided losses, particularly in the equities portfolio, that could have been more severe had the factor exposures remained constant in 2008 and 2009 at their December 2007 levels. Our inference, however, is based on an interpretation of the returns data over that period, rather any specific knowledge that these actions took place.
The key factors responsible for the strongly negative returns in the overall Fund, and especially in the fixed income portfolio, during the financial crisis are those reflecting liquidity and volatility. Factors such as liquidity and volatility have experienced infrequent but large negative returns in the past and recognizing this, together with the extent of the Fund’s exposure to these factors, would have contributed significantly to assessing the Fund’s overall risk exposure. Thus, we find the behavior of the Fund’s active losses in 2008 and part of 2009 were broadly in line with what should have been expected given its exposure to liquidity, volatility, and other factors. Put another way, if the factor exposures pre-2008 and during the financial crisis had been communicated and the asset owner had some knowledge of the potential drawdowns of these factors, the Fund’s losses in 2008 would not have been surprising and would have been within expected loss limits.
Section II also evaluates the Fund’s risk budgeting process based on the behavior of the realized tracking error. The amount of active risk since 1998 has been 0.25% per month, which is substantially below the limit of 0.43% per month in the Fund’s regulations. The tracking error limit was exceeded post-2007, but this was probably due to estimating forecasted variances with only historical data observed to date. A large part of the increase in tracking error post-2007 is due to increased volatility in the factor exposure of active risk.
The Fund’s risk management is based on a process by which the asset owner contracts with its fund manager, NBIM, on a diversified portfolio representing an agreed benchmark, and then the fund manager is given boundaries with respect to the annual deviation of its return from the return of this portfolio, i.e. tracking error. The risk boundaries themselves are not targets. Thus, there is no expected amount of deviation from the benchmark and the risk-budgeting process. This in fact, implicitly rather than explicitly, defines a system of risk limits. This ambiguity, in our view, has two drawbacks. First it may lead to excessive risk aversion on the part of NBIM: without a target, it is difficult to take the manager to task for under-investing in active opportunities, but not the contrary. Second, it is not robust to changes in market conditions; periods of high volatility may cause the manager to trade when market risk increases. We recommend a tracking error target or bands rather than a strict risk limit. We also further recommend that the tracking error concept only be used for market portfolios comprising liquid, tradable securities. We explore this further in Section III.
In evaluating the externally managed funds, we quantitatively investigate only the active management of the external managers and qualitatively comment on the selection of the external mandates by NBIM. We know little about the way in which the mandate benchmarks are chosen and so, while it is possible that some of these choices also reflect active decisions by NBIM, we are unable say whether these decisions add value. Our analysis of externally managed funds therefore focuses on their active returns, i.e., the return relative to the mandate benchmark. Overall external equity management has enjoyed a modest level of success but the active returns of external fixed income funds have been very poor. Although the fees paid to external funds are low, the large exposures of active external returns to systematic factors suggest that active external management has not reflected a large component of unique management ability.
In summary, active management has not detracted from the value of the Fund and accounts for only a very small amount of its overall risk exposure. Prior to 2008, active management contributed a small but highly significant portion to overall Fund returns. However, much of the behavior of the Fund’s small active return can be explained in terms of systematic factors. Our recommendation is that these exposures are, in general, appropriate but that they should be brought into the benchmark and that the Fund’s average exposure to these factors should be a «top-down» decision rather than emerging as a byproduct of «bottom-up» active management. These issues are discussed in Section III.
Summary: Section III
Section III assesses whether and to what extent the Fund has comparative advantages that justify investing significant resources in active management. This includes an evaluation of the opportunities, challenges and specific capabilities with respect to currently managed and new asset classes. In addition to this assessment, it proposes strategies that use the Fund’s comparative advantages, and characterizes these strategies in terms of distributional characteristics, verification horizons, management feasibility compensation structures, and modes of evaluation.
We recognize several distinctive features of the Fund that contribute to its ability to fulfill its mission. First, the transparency and long-term mandate gives the Fund an advantage in ensuring responsible management and provides the on-going basis for evaluating strategic decisions and measuring performance. Second, the large size of the Fund is an advantage that provides scale economies, the ability to influence corporate management, and potential access to the world’s best investment managers and staff. Third, the Fund’s long-term horizon and lack of immediate cash liabilities gives it a comparative advantage in accessing investment opportunities with long verification horizons. Fourth, NBIM as a Norwegian-based asset management entity organized within the central bank (Norges Bank) with a strong public service ethos represents a comparative advantage in that it helps mitigate the problem of agency which is the central challenge of delegated investment management. Finally, the use of segregated accounts for external managers allows NBIM detailed information for continuously monitoring its financial position and assessing its risk exposures.
We also note that each of these distinctive features has potential drawbacks. Public transparency and accountability necessitates active communication to align expectations about the Fund policy and explain performance results. This may lead to less risk-taking by management. The large scale of the Fund has drawbacks as well. Size makes it difficult to beat the market since every major decision is likely to have an adverse price impact. The need to diversify globally leads the fund into markets with higher transaction costs. The large scale necessitates the use of intermediaries and service firms, which represent further cost.
This assessment of the comparative advantages of the Fund provides the basis for a review of the current management approach and an assessment of potential strategies that utilize these advantages.
Our analysis suggests that NBIM takes a fundamental, bottom-up approach to active management focused on security selection. We are not strong advocates of this approach as a way to add value above and beyond factor-based benchmarks, as the empirical evidence (reviewed in Section I) in support of the contribution to returns via superior security selection is limited. However, assuming the costs of this style of active management are low, such activities do not detract from returns even though they may make a small overall contribution to Fund performance. Fundamental analysis may be beneficial for some other aims that the fund wishes to pursue such as socially responsible investing.
With respect to describing and evaluating strategies that utilize the Fund’s comparative advantages, we suggest that the Fund focus more attention on factor risk. We recommend a more top-down, intentional approach to strategic and dynamic factor exposures. This approach relies on expected equilibrium compensation for taking non-diversifiable risk. It is similar to collecting an insurance premium for bearing risk associated with those factors. The foundation of our proposal is the identification and construction of multiple factors that bear risk premiums and the transfer of these factors into the fund benchmark, rather than treating them as the byproduct of other active management strategies.
This approach is designed to utilize the Fund’s comparative advantages. First, it relies upon the Fund’s long-term outlook and lack of current liabilities. Factor premiums, like the equity risk premium of stocks, may exhibit consistent profitability only over long horizons, however they do not rely on identifying mispriced securities. The factor approach also utilizes the advantage of the governance structure of the Fund, in that there exists a transparent mechanism for setting the exposure to risk premiums – like the equity premium – and a common public understanding of the relationship between a policy decision and a market realization. It is natural and appropriate that the owners decide on the systematic exposure to well-established factors. This exposure needs to be communicated and included in the benchmark to the greatest extent possible. Finally, the factor approach utilizes the excellent capabilities of NBIM as developers and monitors of investable benchmarks. In practice, the top-down factor-based approach could be viewed as an extension of the Fund’s asset allocation policy and NBIM’s current operations. The Fund’s asset allocation is determined by assessing the risk and return of investing in debt and equity. Consideration of additional factors is a natural extension. NBIM has clear competence in building indices and tracking them. Thus, NBIM is well suited to undertaking this task.
The need to implement the factor benchmarks in-house is driven by the lack of consistent, investable benchmarks for equity and fixed income factors around the world. NBIM should have major advantages in keeping implementation costs low. We argue that the factor benchmarks will provide clarity with respect to the source of return and the exposure to risk. In Section III we show how the risk-return profile of the factor-based allocation strategy can be described in terms of a probability distribution. Similar tools can be used to gauge the public’s risk aversion with respect to different factors and after identifying the amount of desired exposure to each factor, the factor exposure is brought explicitly into the fund benchmark.
There are several major technical consequences of moving factor exposures into the benchmark of the Fund. First, the optimal benchmark is time varying and has non-market weights. These tilts away from market weights represent the loadings on factor risk premiums. Second, the benchmark is «passive» in the sense that it is constructed according to a set of rules and its composition is pre-determined through the definitions of the factors. But, it is «dynamic» in the sense that their composition is changing more often than a standard S&P500 or FTSE portfolio. Third, and most importantly, the desired amount of factor exposure is set by the asset owner.
The top-down factor approach does not eliminate the potential use of active management. Rather, we define active management in terms of two decisions. First, the decision to deviate from long-term strategic loadings on factors (e.g. a temporary shift from the target allocation to equities) and second, the decision to hold securities in weights that differ from factor benchmark weights. These roughly correspond to timing and selection, where the default, or the baseline case, is determined by factor portfolios that comprise the Fund benchmark. Components of active management will be defined and measured in these two dimensions.
With respect to the current risk monitoring processes, we recommend setting a target for tracking error rather than a boundary, and we further recommend target flexibility that allows for changing market conditions. Tracking error as a risk budgeting and risk management tool should only be applied to a universe of liquid securities. For purposes of internal evaluation of the costs and benefits of active management, and capabilities with respect to timing and selection we recommend maintaining an internal record of decisions about both dimensions of active management. We also recommend that the factor benchmarks themselves be measured against a customized, market-weighted portfolio.
We recommend that different strategies be classified according to the horizon appropriate to the length of time it typically takes for profits from the strategies to be realized. For any strategy, theory may suggest long-run profitability while in the short run there may be extended periods of underperformance. We propose three «horizon buckets» that reflect relative liquidity and the different verification periods of various strategies. Reporting and performance for each class of investment should be segregated, although the management of the portfolio would use the factor model as a framework for integrating all three. Reporting of strategies and assets held in the long-horizon category should also emphasize metrics other than just returns, especially various cashflow-generating metrics. We point out that the lack of such a differentiation across horizons is a disincentive for NBIM to take active risks that generate positive long-horizon rewards.
To implement the process we recommend a series of steps to be taken via a transition process. This involves setting up a new division within NBIM responsible for creating, communicating, maintaining, and implementing factor portfolios and bringing factors into the benchmark for active management.
Summary: Conclusion
The brief for this report focuses on the question of whether the Fund should be actively managed and so the key finding of our report, one that drives the majority of our recommendations, may be a surprise. It is that, to a first approximation, the Fund is actually not an actively managed portfolio.
Active returns, the difference between the fund’s actual return and its benchmark, constitute only a small fraction of both the mean and the volatility of the total return. Moreover, even this small component is itself substantially explained by the Fund’s exposure to a number of systematic factors such as liquidity and volatility. Overall, therefore, the returns on the Fund are similar to those that could have been earned on a fund holding the benchmarks with additional, essentially passive exposure to these factors.
An important question raised by this finding is whether this pattern of risk exposures, dominated by the benchmarks and other systematic factors, is appropriate for the Fund. Our view, supported by our review of the academic literature and our assessment of the differentiating characteristics of the Fund, is that it is. The Fund may seek to continue or even enhance its exposure to purely idiosyncratic and information-based investment strategies. There is no evidence that this activity has hurt performance and may enhance some other aims that the Fund wishes to pursue such as socially responsible investing. However, if the Fund remains well diversified it is highly likely that a significant fraction of its active return will always be driven by one or more systematic factors.
A modern interpretation of the EMH does not deny the possibility that managers might possess skill that allows them to earn excess risk-adjusted returns. Indeed, even modest levels of skill should lead to at least some part of the portfolio being actively managed. Similarly, and more importantly in this context, we should not interpret passive management, the absence of active management, as meaning that the Fund should simply hold a static portfolio that replicates a combination of major stock and bond indices. In such an asset allocation approach the investor chooses the amount of stock versus bond exposure based on the investor’s risk aversion. We advocate enhancing the foundation benchmark by moving to in-house, custom benchmarks that are market weighted.
Depending on its preferences and other characteristics, the Fund may wish to acquire fixed, and possibly dynamic, exposure to other factors. The chosen level of exposure is dependent on how the Fund’s tolerance for a certain factor is different from that of other market participants. For example, if it is felt that the Fund has greater tolerance to bear volatility risk – the risk that in volatile periods certain assets with high volatility risk perform poorly – then the Fund should have a positive exposure to a volatility factor. In holding such assets, the Fund is providing insurance to other investors: by holding more than the market fraction of assets with high volatility risk, the Fund allows other investors to hold a larger fraction of assets with less volatility risk and so the risk premium can be interpreted as an insurance premium that the Fund receives from other investors for reducing their exposure to assets which pay poorly when market volatility is high. Over the long run the Fund will be expected to earn a premium for supplying volatility insurance to other market participants, but during periods of high volatility the Fund will suffer relatively lower returns.
While the principle underlying this approach is the same as the principle motivating the 60%-40% equity-bond allocation, the difference is that there are other factors that are not strongly correlated to the equity premium that offer a reward for risk taking. These represent additional opportunities for return and should dominate the alternative of simply increasing equity exposure. That is, equity risk is only one dimension where the Fund earns a risk premium; the Fund should take advantage of other risk factors as well.
The key characteristics of the Fund that should influence the deviation of its investment policy from a market weight position are its absence of need for liquidity, its very long-term horizon and, at least while cash inflows continue from oil revenue, no explicit liabilities of the fund. These characteristics are important because it is along these dimensions that the Fund is most clearly differentiated from the average investor. The consequence is that the Fund should be able to earn risk premiums from taking exposure to assets that are, for example, somewhat less liquid. The long horizon also enables the Fund to ride out periods of short-term negative returns to factors that in the long run will have positive risk premiums, as predicted by theory and confirmed in data. These factors may include volatility risk, value-growth risk, credit risk, and liquidity risk.
Our main recommendation is that both the metrics used to monitor NBIM’s performance and manner in which the Fund is managed become more closely aligned with the actuality of its risk characteristics. In reality the Fund’s performance is largely determined by its exposure to a number of factors, especially volatility and liquidity risk, as described in Section II. We propose that the benchmarks be framed in terms of these factors – «factor benchmarks» – rather than portfolios defined in terms of geography and asset class as at present. In this framework the Fund’s exposure to a particular factor is chosen by the investor, just as the current 60%-40% equity-bond asset allocation is determined now. A factor benchmark approach would also, in principle, make it easier to include, evaluate, and monitor new asset classes, such as real estate.
One important lesson from the financial crisis is that some factors, e.g., liquidity and volatility, have distributions that are highly skewed with long left tails. In other words, returns on these factors may be relatively stable for much of the time but periodically experience very large negative returns. Our analysis shows that the Fund does have exposure to factors with this payoff pattern. Because of the characteristics of the Fund, these exposures are appropriate because the fund can expect to earn risk premiums in the long run. However, to understand both the risk premiums the Fund is likely to earn from these exposures and the risks it is running in doing so, it is necessary to take a very long term view. This is true for all estimates of risk premiums: even with 100 years or data the standard error on the equity risk premium is about 2%. In fact, over the sample period considered in this study, the realized equity risk premium has been close to zero.
Moving the management of the Fund to the factor benchmark framework will be challenging, but we believe well within NBIM’s capabilities. In its management of the fund to date, NBIM appears to be a highly disciplined manager in that it is able to very precisely track a benchmark. Implementing factor benchmarks involves constructing the factors, selecting the factors to be included in the overall benchmark, and determining how much factor exposure should be taken. Given NBIM’s world-class capabilities with respect to constructing and maintaining investable benchmarks, these challenges can be met. The low tracking error around the Fund’s benchmark testifies to the operational efficiency of NBIM’s management with respect to mimicking tradable factors.
In summary, our report finds that the risks that the Fund has been running, both before and during the crisis, are broadly appropriate given its characteristics and objectives. Our proposals do not therefore suggest a major change in these risk exposures. Active management has not detracted from Fund returns, and in fact has been a small but positive addition to performance. In light of the relative importance that factor exposures already play in the Fund’s returns, we suggest that the Fund consider a framework that more explicitly recognizes the structure of its return generating process via investment in factor benchmark portfolios – and that both the way the Fund is monitored and the way it is organized on a day-to-day basis be adapted to this new framework.