4 The international video game industry
4.1 Introduction
In this chapter, the Ministry will give a presentation of the Nordic video game industry.
In order to illustrate the importance of the industry, we describe finally developments in the sales of video games on the world market, partly by drawing comparisons with other media industries. The video game industry is international, and the various international markets are of varying size and structure. The Ministry has limited the scope of the account to the markets that have most international significance, those of the USA, Asia and Europe.
4.2 The Nordic video game market
The Nordic game market is currently in a growth phase. Counter sales already amount to over NOK 4 billion. By way of comparison, sales in the Nordic cinema market are worth just over NOK 3 billion.
Figure 4.1 shows figures for counter sales of video games, i.e. excluding online games and mobile telephone games in the different Nordic countries.
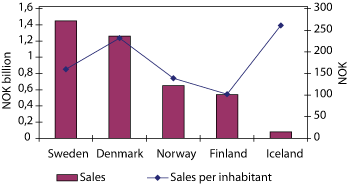
Figure 4.1 Counter sales of video games in the Nordic countries (2006).
Source PricewaterhouseCoopers
Sweden constitutes the largest game market in the Nordic countries, with annual sales amounting to approximately NOK 1.4 billion as against approximately NOK 1.3 billion in Denmark. The Norwegian market, with sales of approximately NOK 0.7 billion, is only half the size of the Swedish. The Finnish market is NOK 0.54 billion and the Icelandic market is the smallest at NOK 0.08 billion.
It is also possible to read out of the Icelandic figure that Iceland consumes most video games per inhabitant. Average sales per inhabitant in Iceland are approximately NOK 260. Sweden and Denmark consume approximately as much per inhabitant.
Consumption per inhabitant is relatively low in Norway, which is in fourth place with sales of approximately NOK 140 per inhabitant.
4.2.1 Video game developers in the Nordic countries
In the following, the Ministry will describe the Nordic game development industry. The purpose of this is partly in order to enable comparison between the structure of the industry in the four Nordic countries. In this connection, it is important to examine how consolidated the industry is. One expression of this is the stability of the companies, in terms of the duration of the companies’ operations. Figure 4.2 shows when the largest development companies were established in each of the Nordic countries.
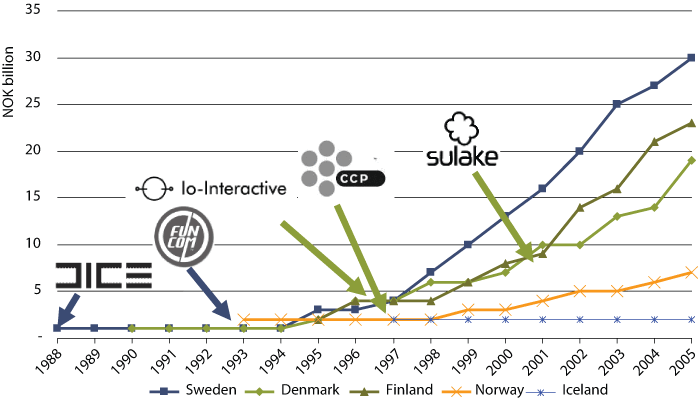
Figure 4.2 Date of establishment of game development companies still operating. Nordic countries.
Source PricewaterhouseCoopers
In all of the Nordic countries, most companies still operating were established between 2001 and 2005. This gives a picture of an industry strongly characterized by relatively newly established companies. On the other hand, all of the largest companies were established prior to this period. With the exception of Sulake, which established itself in the online segment in 2000, the largest companies were established prior to 1998.
The large companies represent a considerable proportion of the total sales in their respective home markets. For example, five of the largest companies in Sweden accounted for 79 per cent of sales in 2006. The large companies develop their own technology and invest considerable resources in this. The companies have considerable significance for the development of the video game industry in the home market, and function as locomotives in innovation and recruitment of fresh talent. With the exception of the Danish IO Interactive, the largest Nordic companies now focus on the online segment.
4.2.2 The number of employees in the development companies
Figure 4.3 gives a picture of the structure of the Nordic market. Since the markets are not especially large, the basic data is somewhat limited. The figures nevertheless clearly indicate that Norway differs from the others. In Norway, just over two-thirds of the companies have no more than five employees. In addition, Norway has no medium-sized companies. This indicates an immature industry. By way of comparison, the other Nordic countries have more even distribution, i.e. companies of all sizes.
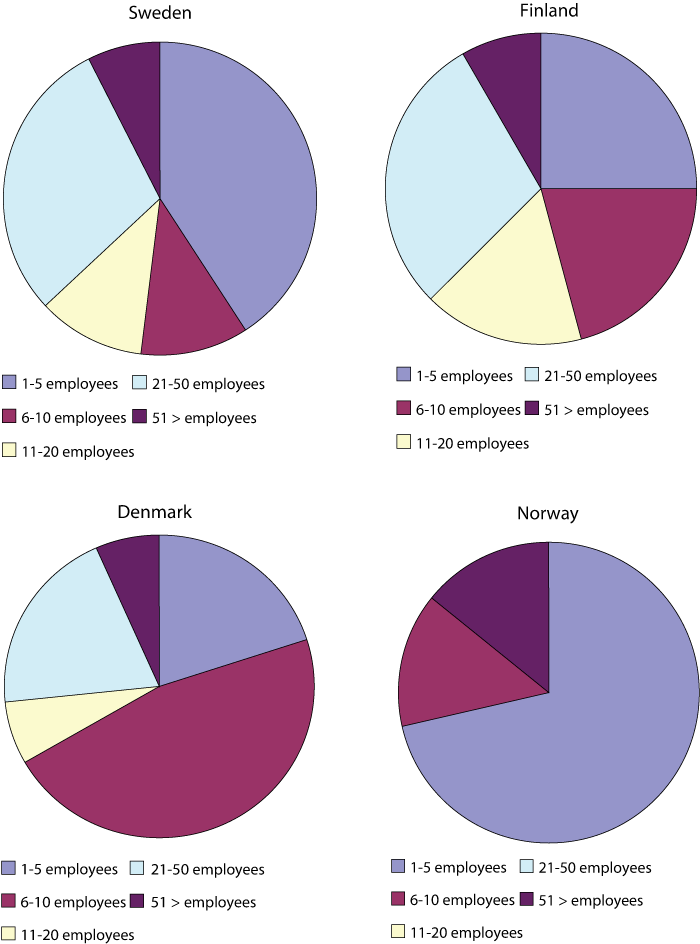
Figure 4.3 The sizes of development companies in the Nordic countries.
Source PricewaterhouseCoopers
4.2.3 Sweden
The Swedish game industry is the most mature of those in the Nordic countries. This is reflected, among other ways, in the existence of a number of companies that function as suppliers to the established game developers. These are companies that can either perform part of the development work or can supply technology such as game engines.
Stockholm and Malmö are the main areas in the Swedish game industry. However, the participants in the Swedish market are scattered geographically. Some of the participants are attached to educational and research institutions at Swedish universities and university colleges.
The Swedish game industry has been characterized by takeovers and mergers, particularly during the period 2000–2003. Figure 4.4 shows the historical sales figures of companies still operating. In 2006, there were 30 game development companies, which represented total sales of NOK 524 million and employed 691 persons.
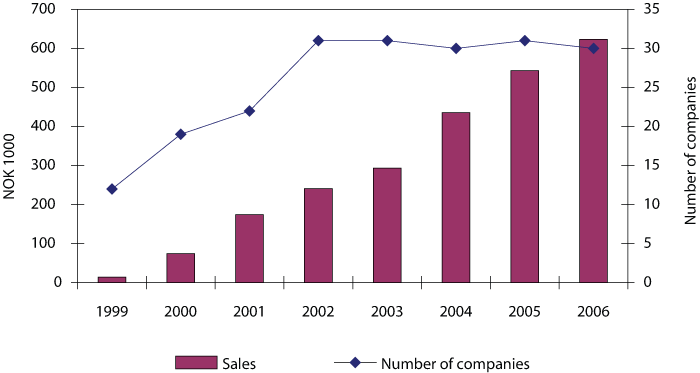
Figure 4.4 Sales and the number of game developers in Sweden.
Source PricewaterhouseCoopers
Most companies develop PC and console games. In 2002, the two largest mobile telephone game developers were taken over by the content supplier Aspiro, which is one of the largest suppliers of mobile telephone content in Northern Europe.
DICE is the oldest of the large game companies in the Nordic area. It was established in 1988 by two students at Växjö University. In 2000, the company took over Refraction Games and 90 per cent of Synergenix Interactive. The takeovers continued in 2001 with the takeover of Sandbox Studios, which is a company based in London. However, in November 2004, DICE itself was taken over by Electronic Arts. In 2006, the company, which has 218 employees, had sales amounting to NOK 206 million.
4.2.4 Denmark
In Denmark, almost the whole environment for game development is centred in Copenhagen, with the exception of a small community in Odense. There are also individual companies in Århus and Ålborg. One of the reasons that there are or have been game companies in these three regions is that the universities of Ålborg, Århus and Copenhagen all offer training in the production of video games.
The Danish company IO Interactive was established in 1997 and, in 2006, had sales amounting to NOK 108 million and had 142 employees. The company has sold a total of 8.8 million units of video games world-wide, and has achieved considerable success with the popular Hitman series. The Hitman story has been sold to Hollywood, where a film has been made about the mysterious hired assassin. IO Interactive has also developed its own game engine, which is used for its games.
4.2.5 Finland
The great majority of game development companies in Finland are located in Helsinki and Espoo. The first companies were established in the middle of the 1990s, but most were established after 2000. Over half of the Finnish game companies develop games for mobile telephones, which is atypical in the Nordic context. Two companies develop games exclusively for hand-held consoles.
Sulake is Finland’s largest video game company. It was established in 2000, and is responsible for the biggest online success in the Nordic countries, Habbo Hotell , which is an online game that draws elements from social gaming and net chatting.
In 2006, Sulake’s sales amounted to nearly NOK 500 million and it had 300 employees. This makes Sulake by far the largest company in the Nordic area, and illustrates the potential income that lies in the online segment.
4.3 The international video game market
4.3.1 Video games in relation to music and films
In the space of a few years, the video game industry has grown to become one of the major industries of the entertainment and media sector. Figure 4.5 shows the historical sales figures in the video game, film and music markets up to 2006, with forecasts for further developments in the coming five years.
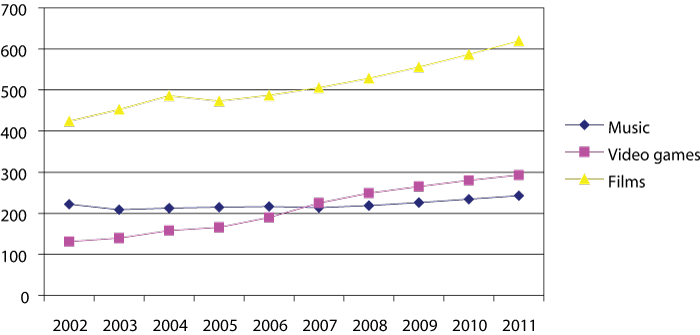
Figure 4.5 Sales of music, video games and films in the international market 2002–2011.
Source PricewaterhouseCoopers
The model shows that sales in 2006 amounted to approximately NOK 190 billion in the international video game market. The introduction of new game consoles and the use of net-based games resulted in a global increase in the video game market of 14.3 per cent from 2005 to 2006. An average annual growth of approximately 9.1 per cent has been forecast for the period from 2007 to 2011. This involves sales of approximately NOK 294 billion in 2011.
By way of comparison, sales of music records in the international market, including legal downloads, amounted to approximately NOK 217 billion in 2006. As a consequence of a higher annual growth, it was estimated that video games would exceed sales in the record industry during the course of 2007.
As shown in figure 4.5, the film industry, with sales in 2006 of approximately NOK 487 billion, is more than double the size of the video game industry. This is largely due to DVD sales and TV income. If the size of the film industry is based on cinema box office alone, the video game industry is larger than the film industry.
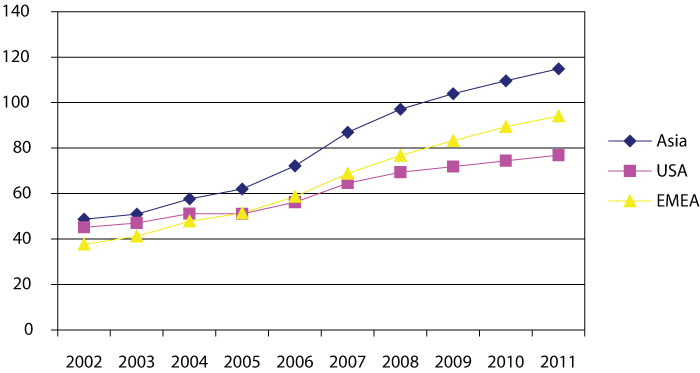
Figure 4.6 Market size and growth distributed by region. Amounts in NOK millions.
Source PricewaterhouseCoopers
4.3.2 The Development of the international video game market
Asia, Europe and the USA have the largest markets for the sale of video games. Figure 4.6 shows the development of the three markets with a forecast for the development during the next five years. 2007 is expected to be the year with the keenest growth in percentage in most national markets. This is mainly due to the introduction of new game consoles.
Asia (including Australia) is the region with the largest sales. In 2006, sales amounted to approximately NOK 70 billion and sales in 2011 are forecast to be approximately NOK 113 billion. This represents an annual growth of approximately 10 per cent.
Europe, South Africa and selected countries in the Middle East (abbreviated to EMEA) were the second largest region in 2006 with sales of approximately NOK 56 billion. On the basis of an annual expected growth of 10.2 per cent, sales will increase to approximately NOK 92 billion in 2011.
The USA is the largest national market with sales in 2006 of NOK 54 billion. This is forecast to increase to NOK 75 billion in 2011, which involves an annual growth of approximately 6.7 per cent. This is somewhat lower growth than in the other markets.
4.3.3 Game platforms in the various markets
Figure 4.7 shows historical figures and estimated development in international game sales by platform during the period 2002–2011. In addition to the various technological platforms, this includes figures for developments within advertising in games.
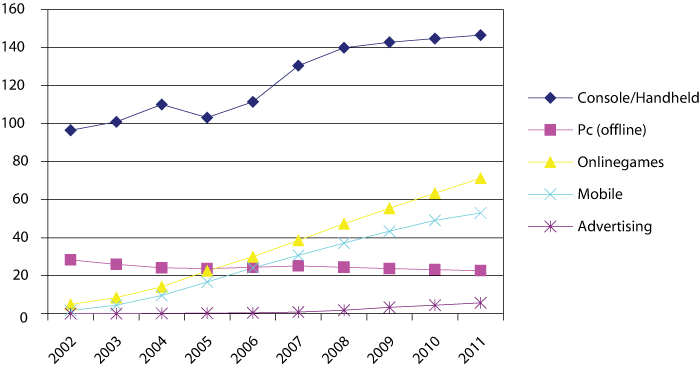
Figure 4.7 International game sales by platform during the period 2002–2011.
Source PricewaterhouseCoopers
Internationally, the growth of the console market has been influenced by the introduction of an increasing number of more sophisticated consoles. Growth is expected to flatten out from 2008.
PC games that are not online are losing market shares. This segment has also been facing major challenges associated with illegal copying. Although the market for PC games is falling, new operating systems and other technological improvements may check this fall somewhat.
Online games account for the largest growth in the market. Much of this growth can be explained by the increased broadband penetration and the availability of online services for consoles. Moreover, online games for the PC are far more difficult to pirate. Game manufacturers are therefore launching an increasing number of online games for the PC.
The fact that the new consoles are equipped with connection to the Internet may be expected to contribute to growth of the online market. Greater broadband penetration and access to increasingly greater bandwidths are also conducive to the use of online games.
Mobile telephone games too have shown keen growth in recent years. This growth is expected to continue. The expansion of the 3G mobile telephone network contributes to this growth.
Advertising in games in the form of advertising posters and product placement has grown in pace with the great popularity of video games. Technological developments also play a role here. The games have acquired better graphics and the potential to make continuous changes to advertising in online games.
The USA
As mentioned above, the USA constitutes the largest single market in the game industry with sales in 2006 amounting to NOK 54 billion. Figure 4.8 shows the historical development of the various platforms in the American market and provides forecasts for future development.
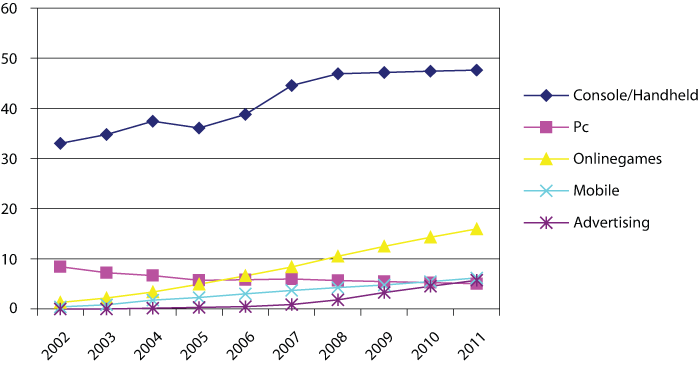
Figure 4.8 The USA. The development of the various platforms 2002–2011.
Source PricewaterhouseCoopers
The market differs somewhat from the world market in that the console and hand-held market is in process of maturing, and a reduction in growth is therefore expected. As early as 2005, there was a fall in this market. However, the market has rallied owing to the launch of next-generation consoles and upgrading of established consoles.
Development of the market for mobile telephone games has moved more slowly in the USA than in many other markets and regions. While mobile telephone game units occupy a larger segment than PC games in most markets, they are not expected to outdistance PC games before 2011 in the USA. This is largely due to the fact that the USA has not progressed as much in its expansion of the 3G mobile telephone network as the other markets (Europe and Asia).
Online games are the segment of the American market that is showing rapidest growth. During the period from 2006 to 2011, an average growth of 19.3 per cent per year is forecast.
Figures are also available for advertising in games in the American market. In 2006, sales from this market amounted to nearly NOK 0.5 billion.
Asia
The area referred to as “Asia-Pacific” includes Asia with the exception of the Middle East, but including Australia and New Zealand, and is the region with the largest sales in the video game market. In 2006, the sales in this market amounted to approximately NOK 70 billion. Figure 4.9 shows the development of the various platforms in the Asian market.
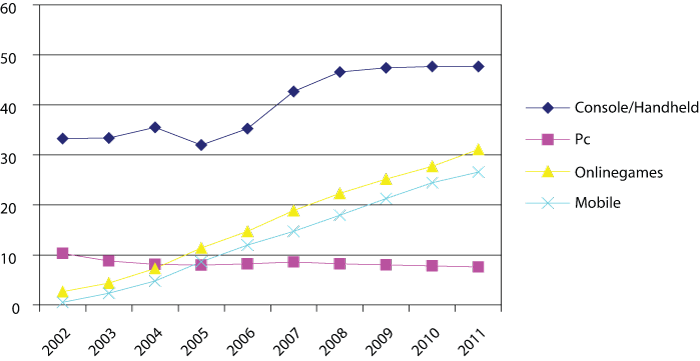
Figure 4.9 Asia-Pacific. The development of the various platforms 2002–2011.
Source PricewaterhouseCoopers
The console and hand-held market constitute the leading segment. This segment is expected to stagnate in 2008. This is largely because the consoles increasingly allow games to be played online.
It is forecast that PC games will fall steadily in the region. In this segment too, the consumers will probably move to online products. Parallel to this, high growth is expected for online games and mobile telephone games in pace with the expansion of broadband and the 3G mobile telephone network. This will particularly apply to the heavily populated market of China.
Japan is the world’s second largest national market with sales of NOK 28.8 billion in 2006. Two of the largest manufacturers of consoles and hand-held game machines, Sony and Nintendo, are located in Japan.
Another large market in the region is South Korea with sales of NOK 18 billion in 2006. Owing to the major penetration of broadband, online games occupy the largest segment of this market.
In China too, online games are the dominant segment according to the registered figures. It is larger than the three other segments together but, according to PricewaterhouseCoopers, this is mainly due to widespread illegal copying of other games. In 2006, sales in the market amounted to NOK 6 billion. The country has the highest expected growth rate in the region at 14.3 per cent.
Europe
The statistics for Europe include Europe, South Africa and selected countries in the Middle East (EMEA), but are regarded as descriptive of the European market as a whole. Here continued growth is expected in the console market. On the other hand, the market for PC games remains relatively stable.
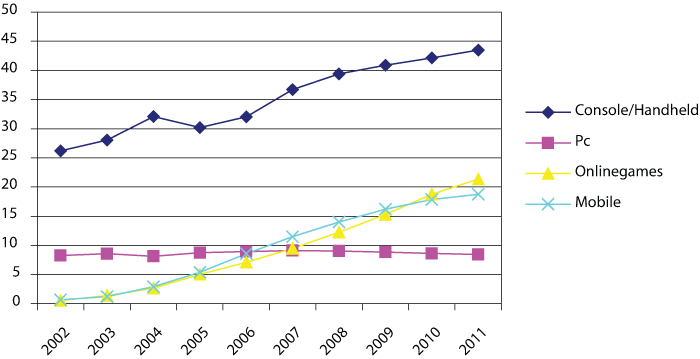
Figure 4.10 Europe (EMEA). The development of the various platforms 2002–2011.
Source PricewaterhouseCoopers
In Europe, the mobile telephone games market is larger than the market for online games. This is due to the early expansion of the 3G mobile telephone network and the use of advanced telephones, and to the fact that it mainly uses a common technological platform. Not until 2009 is it expected that the market for online games will outdistance the mobile telephone games market.
The UK is the largest market in Europe and the world’s third largest national market with sales amounting to NOK 16.8 billion in 2006. Germany is the region’s second largest market with sales of NOK 12.6 billion in 2006. In the German market, unlike the other markets, the PC segment is the largest. France is the region’s third largest market with sales amounting to NOK 9 billion in 2006.
4.4 Summary
The Nordic video game market is developing rapidly. The Swedish market is the only national market showing signs of maturing. In all of the Nordic countries, most companies still operating were established during the period between 2001 and 2005. This gives a picture of an industry strongly characterized by relatively newly established companies. On the other hand, all of the largest companies were established prior to this period. Moreover, the largest companies account for a considerable share of the total sales in their respective home markets.
In the USA, the use of games for hand-held units is not so developed as in other parts of the world. This is a consequence of the slower development of the 3G mobile telephone network in the USA compared with other countries. In Asia, the 3G mobile telephone network is rapidly expanding. The consequence of this is that use of pure PC games in this area will probably die down, while the use of games for mobile telephones and hand-held units will probably flourish. It is assumed that this will particularly apply to China. In Europe, early development of the 3G mobile telephone network and large sales of advanced telephones have provided the basis for extensive use of games designed for mobile units.