Continued strong growth
Historical archive
Published under: Jagland's Government
Publisher: Finans- og tolldepartementet
Press release | Date: 13/05/1997 | Last updated: 21/10/2006
Press Release
13. May 1997
Revised National Budget 1997
Continued strong growth
The growth in the Norwegian economy is continuing. With an average increase of Mainland GDP of 3.6 pct. over the last four years, the economy is now operating close to its capacity. Mainland GDP is forecast to grow by 3¼ pct. this year whereas a deceleration to 2¼ pct. is anticipated for 1998. The main force behind the growth this year is a strong increase - albeit slower than last year - in private consumption, along with a brisk upswing in fixed investments in the petroleum sector. The growth in exports of traditional goods, which experienced a strong pick-up in 1996 despite slow economic activity among the most important trading partners, is expected to taper off this year.
The conditions in the labour market have improved considerably during the strong upturn. The employment is estimated to increase by 8 pct. in the four year period 1994-97. In the same period, the unemployment rate has been reduced from over 6 pct. to close to 4 pct. of the labour force.
Wage settlements have been moderate so far this year - indicating an overall wage growth from 1996 to 1997 at approximately 3½ pct. Based on an estimated price inflation of 2½ pct., the real wage is thus expected to increase by about 1 pct. This is a clear deceleration compared to the close to 3 pct. growth in 1996, which was the highest real wage increase since the 1970s.
Economic policy will aim at bringing the present strong upturn in production and demand in line with a sustainable growth pattern in order to avoid a stronger price and wage inflation.
Monetary policy is geared towards maintaining a stable Norwegian krone against European currencies. As a consequence of upward pressure on the krone Norges Bank reduced interest rates three times between November 1996 and January 1997. The krone has weakened somewhat recently, approaching the exchange rate level prior to the recent episode of instability. A tight fiscal policy combined with an income policy is considered vital against the background of an economy running close to capacity.
The fiscal stance for 1997 is now estimated to imply a contractionary effect in the order of ½ pct. of Mainland GDP.
The Fiscal Budget and the Government Petroleum Fund show a surplus of NOK 59.7 billion for 1997. The underlying real expenditure growth is now estimated at 1¾ pct.
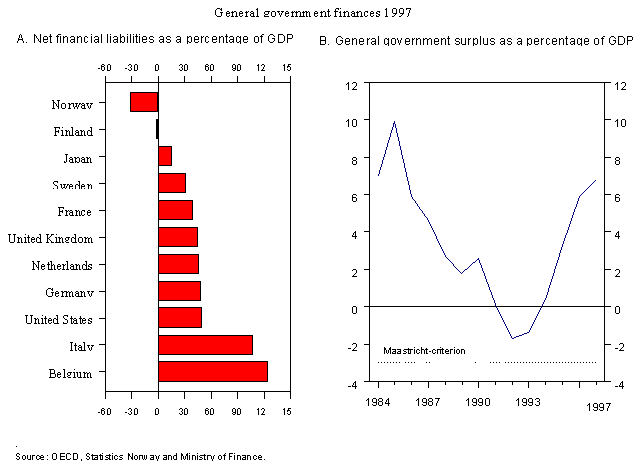
General Government Financial Balance is expected to show a surplus (net lending) equivalent to 6.8 pct. of GDP in 1997 - up from 5.9 pct. last year. This figure can be compared with the Maastricht criterion of a ceiling on net borrowing (deficit) of 3 pct. of GDP. The General Government gross debt, which was 31 pct. of GDP at the end of 1996, is estimated to decline further in 1997.
General outlook
The macroeconomic estimates for 1997 point to continued growth in demand in the private sector.
- Mainland GDP is estimated to grow by 3¼ per cent in 1997. Total GDP for the whole economy, including petroleum and shipping, is estimated to increase by almost 4 per cent in 1997. Private consumption and investments in the petroleum sector will be the main contributors to growth in 1997.
- Private consumption is estimated to increase by 3¼ per cent in 1997, somewhat less than in 1996.
- Investments in the enterprise sector in Mainland Norway are estimated to increase by 5 per cent in 1997. This is 6 percentage points lower than in 1996.
- Demand impulses on the Mainland economyfrom oil investment are expected to increase by almost NOK 6 billion from 1996 to 1997. This relatively strong increase is, however, partially caused by lower than expected investments in oil companies in 1996.
- Employment (number of persons employed) is estimated to increase by 2 per cent in 1997, following a 2.5 per cent increase last year. Although the labour force grew strongly last year, the unemployment rate declined to an average of 4.9 per cent in 1996 according to the labour force survey based on new definitions.Due to a continued high level of economic activity, the average unemployment rate is estimated to decline to 4 per cent in 1997.
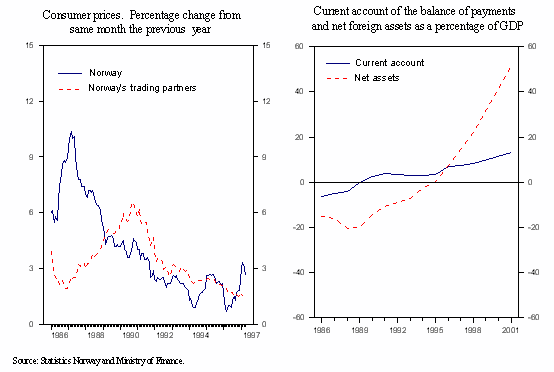
- The average growth in consumer prices was 1.3 per cent last year, the lowest since 1960. Year on year inflation was higher at the beginning of 1997, around 3 per cent. This was mainly due to higher excises from January 1997 and a more modest decline in prices on clothing and footwear than the first months of 1996. Inflation has been reduced since February, and average growth in consumer prices is estimated at 2½ per cent in 1997. Average wage growth is estimated at about 3½ per cent in 1997.
- During the 1990s Norway's current account surplus has been steadily increasing. The surplus is estimated at NOK 81.3 billion in 1997, compared to NOK 72.9 billion last year. This corresponds to 7.2 per cent of GDP in 1996 and 7½ per cent of GDP in 1997. The increased current account surplus in 1997 is caused by an expected rise in export value of gas and oil.
Main economic indicators
Key projections for the Norwegian economy. Volume change from previous year, pct.
| 1996
NOK billion 1993-prices | 1996 | 1997 1)> | |
| Private consumption | 460.3 | 4.7 | 3.2 |
| Public consumption | 190.3 | 3.3 | 2.0 |
| Gross fixed investment | 191.1 | 4.8 | 8.2 |
| - Of which: Petroleum | 43.8 | -4.4 | 18.5 |
| Business sector. Mainland Norway | 90.1 | 11.1 | 5.1 |
| Exports | 391.5 | 10.0 | 5.1 |
| - Of which: Crude oil and natural gas | 145.3 | 15.5 | 6.8 |
| Traditional goods | 145.2 | 10.3 | 4.0 |
| Imports | 308.5 | 6.5 | 5.2 |
| - Of which: Traditional goods | 217.0 | 9.2 | 4.0 |
| Gross Domestic Product | 947.4 | 5.3 | 3.9 |
| - Of which: Mainland Norway | 773.8 | 3.7 | 3.3 |
Memorandum items: | |||
| Consumer price inflation | 1.3 | 2.5 | |
| Wage growth | 4.25 | 3.5 | |
| Employment growth | 2.5 | 2 | |
| Unemployment rate (pct. of labour force) | 4.9 | 4 | |
| Private savings. pct. of net disposable income (savings ratio) | 5.5 | 4,7 | |
| Current account of the balance of payments. NOK billions | 72.9 | 81.3 | |
| As a percentage of GDP | 7.2 | 7.5 |
1)Estimates.
Source: Statistics Norway and Ministry of Finance.
| Key figures for the petroleum sector | ||||||
| 1995 | 1996 | 1997 1)> | 1998 1)> | 2001 1)> | Oil price sensitivity 1997 | |
| Assumptions: | ||||||
| Crude oil price, NOK per barrel | 108 | 134 | 125 | 118 | 126 | 10 |
| Production. mill. Sm 3> o.e. | 193 | 222 | 239 | 261 | 292 | |
| - Crude oil (incl. NGL) | 166 | 185 | 195 | 213 | 225 | |
| - Natural gas | 28 | 37 | 44 | 48 | 68 | |
| Billions NOK: | ||||||
| Export value 2)>. | 115.4 | 158.0 | 166.6 | 175.1 | 211.9 | 12.1 |
| Accrued taxes and royalties 3)> | 29.3 | 41.6 | 38.3 | 39.9 | 59.9 | 5.5 |
| Paid taxes and royalties 3)> | 27.6 | 33.1 | 43.2 | 38.9 | 54.9 | 3.0 |
| Net cash flow 4)> | 38.5 | 69.9 | 78.7 | 73.4 | 126.9 | 8.2 |
1)Estimates.
2) Crude oil, natural gas and pipeline transport.
3) Sum of accrued taxes, royalties, area fees and CO2 excise
tax.
4) Sum of paid taxes and royalties incl. CO2 excise tax,
dividends from Statoil and net payments from direct central
government participation in petroleum activity.
Source: Statistics Norway, Ministry of Oil and Energy and Ministry of Finance.

Fiscal policy
Fiscal budget surplus before loan transactions and central and general government net lending.
Millions NOK
| 1995 | 1996 | 1997 | |
| Fiscal budget surplus | 2 093 | 2 943 | 0 |
| + Surplus in Government Petroleum Fund | 1 981 | 44 294 | 59 741 |
| + Surplus in other Central Government and social security accounts | 1 977 | 3 511 | 7 080 |
| + Definitional differences between fiscal budget and national accounts 1)> | 12 604 | 10 022 | -1 343 |
| + Direct investment in state enterprises | 10 982 | 1 512 | 10 249 |
| = Central government net lending, accrued value . | 29 636 | 62 282 | 75 727 |
| + Local government surplus, accrued value | 884 | -2 049 | -2 273 |
| = General government net lending . | 30 521 | 60 234 | 73 454 |
| In per cent of GDP | 3.3 | 5.9 | 6.8 |
1)Including central government accrued, unrecorded taxes.
Source: Statistics Norway and Ministry of Finance
Key Fiscal Budget figures incl. Government Petroleum Fund. In millions NOK
| 1995 | 1996 | 1997 | |
| Total revenues | 372 358 | 406 147 | 433 145 |
| 1 Revenues from petroleum activities | 50 184 | 61 110 | 69 200 |
| 1.1 Taxes and excises | 27 637 | 33 078 | 43 200 |
| 1.2 Central government petroleum activities | 22 547 | 28 032 | 26 000 |
| 2 Revenues excl. petroleum activities | 322 173 | 345 038 | 363 945 |
| 2.1 Taxes and excises, Mainland Norway | 263 741 | 287 818 | 321 676 |
| 2.2 Other revenues | 58 432 | 57 220 | 42 269 |
| Total expenditure | 368 283 | 358 991 | 375 856 |
| 1 Expenditure on central government petroleum activities | 11 674 | -8 777 | -9 491 |
| 2 Expenditure excl. central government petroleum activities | 356 609 | 367 767 | 385 347 |
| 2.1 Purchases of goods and services | 86 841 | 92 560 | 92 135 |
| 2.2 Transfers | 269 768 | 275 207 | 293 212 |
| Surplus | 4 074 | 47 156 | 57 289 |
| Oil adjusted surplus | -34 436 | -22 730 | -21 402 |
Source: Ministry of Finance.

Head of Information Anne-Sissel Skånvik, tel.: (47) 22 24 41 09, fax.: (47) 22 24 95 10
This page was last updated May 13 1997 by the editors