10 Annex
10.1 Annex I. Summary tables on emission trends
This Annex contains 5 tables summarising the results of the latest greenhouse gas inventories for Norway 1990–2020. The tables are drawn from the annual submission under the Climate Convention and the Kyoto Protocol from 08.04.2022.101
CRF TABLE 10S1: NORWAY’S TOTAL EMISSIONS AND REMOVALS OF GREENHOUSE GASES DURING THE PERIOD 1990–2020
CRF TABLE 10S2: NORWAY’S EMISSIONS AND REMOVALS OF CARBON DIOXIDE (CO2) DURING THE PERIOD 1990–2020
CRF TABLE 10S3: NORWAY’S EMISSIONS OF METHANE (CH4) DURING THE PERIOD 1990–2020
CRF TABLE 10S4: NORWAY’S EMISSIONS OF NITROUS OXIDE (N2O) DURING THE PERIOD 1990–2020
CRF TABLE 10S5: NORWAY’S EMISSIONS OF INDUSTRIAL GREENHOUSE GASES (HCFS, PFCS AND SF6) DURING THE PERIOD 1990–2020
Note references in the tables:
(1) The column “Base year” should be filled in only by those Parties with economies in transition that use a base year different from 1990 in accordance with the relevant decisions of the COP. For these Parties, this different base year is used to calculate the percentage change in the final column of this table.
(2) Fill in net emissions/removals as reported in table Summary 1.A. For the purposes of reporting, the signs for removals are always negative (-) and for emissions positive (+).
(3) In accordance with the UNFCCC reporting guidelines, for Parties that decide to report indirect CO2 the national totals shall be provided with and without indirect CO2.
(4) In accordance with the UNFCCC reporting guidelines, HFC and PFC emissions should be reported for each relevant chemical. However, if it is not possible to report values for each chemical (i.e. mixtures, confidential data, lack of disaggregation), this row could be used for reporting aggregate figures for HFCs and PFCs, respectively. Note that the unit used for this row is kt of CO2 equivalent and that appropriate notation keys should be entered in the cells for the individual chemicals.
(5) Includes net CO2, CH4 and N2O from LULUCF.
Table AI-1 CRF TABLE 10S1: NORWAY’S TOTAL EMISSIONS AND REMOVALS OF GREENHOUSE GASES DURING THE PERIOD 1990–2020.
GREENHOUSE GAS SOURCE AND SINK CATEGORIES | Base year(1) | 1990 | 1991 | 1992 | 1993 | 1994 | 1995 | 1996 | 1997 | 1998 | 1999 | 2000 | 2001 | 2002 | 2003 | 2004 | 2005 | 2006 | 2007 | 2008 | 2009 | 2010 | 2011 | 2012 | 2013 | 2014 | 2015 | 2016 | 2017 | 2018 | 2019 | 2020 | Change from base to latest reported year |
|---|---|---|---|---|---|---|---|---|---|---|---|---|---|---|---|---|---|---|---|---|---|---|---|---|---|---|---|---|---|---|---|---|---|
(kt CO2 equivalents) | % | ||||||||||||||||||||||||||||||||
Total (net emissions)(2) | 40889,89 | 40889,89 | 36694,92 | 35626,76 | 36060,62 | 40038,24 | 36187,88 | 39999,55 | 41329,80 | 39120,60 | 38580,12 | 36281,48 | 35586,04 | 33305,60 | 32296,20 | 33020,24 | 34615,98 | 32650,63 | 34234,94 | 31431,61 | 25553,22 | 31222,87 | 28976,22 | 32050,38 | 31794,10 | 35943,02 | 41387,37 | 40749,35 | 38977,60 | 38269,63 | 34650,02 | 28940,24 | -29,22 |
1. Energy | 28840,36 | 28840,36 | 27785,10 | 28909,88 | 30061,15 | 31670,41 | 32140,63 | 35198,99 | 35026,57 | 34933,57 | 35922,10 | 35049,61 | 36808,89 | 36539,99 | 37755,12 | 37435,06 | 36909,95 | 37710,43 | 39423,80 | 38136,41 | 38167,71 | 39687,40 | 38569,40 | 38138,03 | 38252,66 | 38529,64 | 38991,21 | 38129,77 | 37502,87 | 37519,82 | 35927,08 | 34187,76 | 18,54 |
A. Fuel combustion (sectoral approach) | 25430,37 | 25430,37 | 24974,56 | 25685,73 | 26569,42 | 28020,25 | 28582,84 | 31138,67 | 31120,49 | 30908,70 | 31299,77 | 30142,36 | 32205,74 | 32540,92 | 33908,72 | 33773,45 | 33391,76 | 34346,17 | 34664,77 | 34164,30 | 34874,49 | 36220,93 | 35127,58 | 34729,54 | 34894,05 | 35568,72 | 35755,04 | 35060,84 | 34667,41 | 34794,79 | 33744,94 | 32142,28 | 26,39 |
1. Energy industries | 7267,07 | 7267,07 | 7614,55 | 8173,95 | 8444,14 | 9162,19 | 9069,78 | 9946,19 | 10316,49 | 10000,03 | 9949,35 | 10866,61 | 12082,28 | 12346,94 | 13095,08 | 13179,41 | 13428,56 | 13387,33 | 13720,02 | 13750,60 | 14740,39 | 14889,79 | 14465,55 | 14170,62 | 14215,63 | 14904,89 | 15402,93 | 14 939,65 | 15 328,83 | 15 156,19 | 15 001,66 | 14 305,42 | 96,85 |
2. Manufacturing industries and construction | 3421,34 | 3421,34 | 3163,06 | 3231,18 | 3452,30 | 4060,49 | 3949,67 | 4405,95 | 4167,38 | 4143,91 | 3877,47 | 3485,42 | 3543,38 | 3404,55 | 3599,18 | 3425,61 | 3252,90 | 3561,80 | 3486,17 | 3425,62 | 3118,75 | 3419,08 | 3236,73 | 3093,95 | 3228,85 | 3013,30 | 3003,25 | 2 955,23 | 3 062,04 | 3 167,48 | 2 983,40 | 2 904,30 | -15,11 |
3. Transport | 10055,82 | 10055,82 | 9800,95 | 10022,29 | 10325,14 | 10285,98 | 10998,72 | 11524,98 | 11791,94 | 12093,48 | 12760,50 | 11951,22 | 12290,04 | 12190,18 | 12748,37 | 12968,23 | 12998,23 | 13512,02 | 13835,43 | 13622,06 | 13405,70 | 14040,86 | 14104,22 | 14247,80 | 14283,05 | 14642,93 | 14343,32 | 13 841,88 | 13 048,53 | 13 241,61 | 12 723,93 | 11 929,48 | 18,63 |
4. Other sectors | 4331,00 | 4331,00 | 4075,61 | 3938,14 | 4098,15 | 4106,86 | 4090,49 | 4809,37 | 4416,69 | 4296,41 | 4298,61 | 3648,77 | 3986,84 | 4129,33 | 4292,00 | 3868,58 | 3457,67 | 3648,85 | 3451,52 | 3236,63 | 3423,63 | 3670,29 | 3106,02 | 3018,15 | 2956,99 | 2793,21 | 2822,87 | 3 140,41 | 3 038,42 | 3 080,40 | 2 922,01 | 2 903,80 | -32,95 |
5. Other | 355,14 | 355,14 | 320,38 | 320,17 | 249,69 | 404,72 | 474,18 | 452,18 | 427,99 | 374,86 | 413,83 | 190,35 | 303,21 | 469,92 | 174,09 | 331,62 | 254,40 | 236,17 | 171,63 | 129,38 | 186,02 | 200,91 | 215,07 | 199,01 | 209,53 | 214,39 | 182,67 | 183,67 | 189,60 | 149,12 | 113,95 | 99,28 | -72,04 |
B. Fugitive emissions from fuels | 3409,99 | 3409,99 | 2810,54 | 3224,14 | 3491,73 | 3650,17 | 3557,79 | 3978,31 | 3876,08 | 4019,68 | 4612,22 | 4897,92 | 4599,09 | 3990,49 | 3821,48 | 3639,23 | 3510,99 | 3360,78 | 4681,11 | 3863,12 | 3236,80 | 3369,69 | 3350,64 | 3345,58 | 3325,07 | 2916,90 | 3194,21 | 3058,29 | 2827,82 | 2711,04 | 2170,87 | 2041,84 | -40,12 |
1. Solid fuels | 183,85 | 183,85 | 179,64 | 159,50 | 162,18 | 158,28 | 154,12 | 153,12 | 141,38 | 142,08 | 159,88 | 166,55 | 156,01 | 147,93 | 190,06 | 144,18 | 122,41 | 118,63 | 151,27 | 122,46 | 107,95 | 101,96 | 111,42 | 95,53 | 119,84 | 117,46 | 98,83 | 92,66 | 81,16 | 80,84 | 79,80 | 78,55 | -57,28 |
2. Oil and natural gas and other emissions from energy production | 3226,14 | 3226,14 | 2630,89 | 3064,65 | 3329,55 | 3491,88 | 3403,67 | 3825,19 | 3734,69 | 3877,60 | 4452,34 | 4731,38 | 4443,08 | 3842,56 | 3631,42 | 3495,05 | 3388,58 | 3242,16 | 4529,84 | 3740,66 | 3128,85 | 3267,73 | 3239,23 | 3250,05 | 3205,23 | 2799,44 | 3095,38 | 2 965,62 | 2 746,66 | 2 630,20 | 2 091,07 | 1 963,29 | -39,14 |
C. CO2 transport and storage | NO,NE | NO,NE | NO,NE | NO,NE | NO,NE | NO,NE | NO,NE | 82,01 | 30,01 | 5,20 | 10,11 | 9,32 | 4,06 | 8,57 | 24,92 | 22,38 | 7,20 | 3,48 | 77,92 | 108,98 | 56,42 | 96,79 | 91,17 | 62,91 | 33,53 | 44,02 | 41,97 | 10,64 | 7,64 | 13,99 | 11,26 | 3,64 | 100,00 |
2. Industrial Processes | 15376,57 | 15376,57 | 14189,03 | 11457,62 | 12267,90 | 12569,25 | 12436,00 | 12309,98 | 12598,05 | 12894,48 | 12959,63 | 13220,28 | 12827,43 | 12026,65 | 11378,90 | 12126,94 | 11669,30 | 10930,93 | 10905,25 | 10805,53 | 8371,14 | 9102,44 | 9239,83 | 9169,56 | 9302,04 | 9311,46 | 9317,41 | 9263,06 | 9245,55 | 9296,03 | 9258,97 | 9224,44 | -40,01 |
A. Mineral industry | 727,69 | 727,69 | 680,89 | 739,68 | 925,03 | 943,44 | 990,33 | 991,84 | 1056,44 | 1035,21 | 1002,25 | 1013,11 | 982,34 | 992,09 | 1045,77 | 858,67 | 920,73 | 957,28 | 1017,33 | 1043,31 | 1011,17 | 1023,11 | 1013,81 | 998,18 | 1055,06 | 1055,67 | 987,09 | 971,60 | 1 025,33 | 992,22 | 999,89 | 963,76 | 32,44 |
B. Chemical industry | 4129,28 | 4129,28 | 3921,71 | 3253,88 | 3529,50 | 3678,60 | 3648,09 | 3724,38 | 3944,78 | 3896,02 | 3806,68 | 4023,48 | 4018,89 | 4039,48 | 3927,44 | 4185,46 | 3936,18 | 3847,90 | 3411,74 | 3118,14 | 2385,55 | 2462,84 | 2421,99 | 2355,06 | 2225,78 | 2115,29 | 2323,36 | 2 064,43 | 1 944,70 | 2 103,95 | 2 028,09 | 2 013,72 | -51,23 |
C. Metal industry | 10113,29 | 10113,29 | 9186,33 | 7058,77 | 7360,75 | 7464,77 | 7285,46 | 7034,63 | 6923,59 | 7250,53 | 7373,19 | 7353,86 | 6911,18 | 6090,67 | 5515,04 | 6143,93 | 5872,16 | 5108,87 | 5401,04 | 5518,43 | 3792,72 | 4322,55 | 4438,99 | 4393,30 | 4497,23 | 4666,20 | 4640,44 | 4 805,02 | 4 838,78 | 4 791,51 | 4 912,45 | 5 002,55 | -50,53 |
D. Non-energy products from fuels and solvent use | 287,45 | 287,45 | 265,05 | 263,68 | 268,07 | 265,66 | 235,72 | 247,97 | 247,80 | 222,64 | 218,73 | 207,19 | 204,72 | 203,76 | 209,59 | 211,75 | 204,23 | 194,81 | 206,46 | 204,75 | 190,09 | 208,09 | 218,43 | 211,42 | 222,44 | 221,08 | 203,87 | 218,13 | 216,36 | 217,40 | 187,40 | 226,88 | -21,07 |
E. Electronic industry | NO | NO | NO | NO | NO | NO | 1,03 | 1,03 | 1,03 | 1,03 | 1,14 | 1,14 | 1,14 | 1,14 | 1,14 | 1,14 | 1,14 | 1,14 | 1,14 | 1,14 | 1,14 | 1,14 | 1,14 | 1,14 | 1,14 | 1,14 | 1,14 | 1,14 | 1,14 | 1,14 | 1,14 | 1,14 | 100,00 |
F. Product uses as ODS substitutes | 0,04 | 0,04 | 1,31 | 2,82 | 35,80 | 54,08 | 97,84 | 129,54 | 195,34 | 258,37 | 322,89 | 369,28 | 466,71 | 503,95 | 515,84 | 544,11 | 548,74 | 620,27 | 683,96 | 739,40 | 819,05 | 894,24 | 965,82 | 1028,35 | 1118,12 | 1081,09 | 963,35 | 1 005,48 | 1 029,18 | 996,54 | 933,97 | 809,97 | 1845045,27 |
G. Other product manufacture and use | 87,53 | 87,53 | 90,80 | 97,56 | 105,61 | 119,90 | 130,57 | 133,83 | 172,76 | 174,98 | 177,95 | 189,46 | 171,30 | 121,67 | 79,05 | 93,53 | 93,60 | 114,78 | 94,35 | 90,01 | 87,34 | 95,52 | 79,10 | 77,50 | 81,17 | 71,10 | 89,61 | 81,67 | 76,47 | 71,51 | 82,36 | 86,84 | -0,79 |
H. Other | 31,27 | 31,27 | 42,95 | 41,23 | 43,14 | 42,79 | 46,97 | 46,77 | 56,33 | 55,70 | 56,80 | 62,76 | 71,16 | 73,90 | 85,03 | 88,35 | 92,53 | 85,88 | 89,23 | 90,35 | 84,08 | 94,94 | 100,54 | 104,61 | 101,11 | 99,89 | 108,55 | 115,59 | 113,60 | 121,77 | 113,68 | 119,58 | 282,38 |
3. Agriculture | 4812,30 | 4812,30 | 4746,21 | 4713,47 | 4706,88 | 4708,86 | 4749,19 | 4783,40 | 4727,23 | 4719,51 | 4737,74 | 4586,37 | 4536,26 | 4519,38 | 4596,68 | 4562,11 | 4569,38 | 4482,33 | 4475,16 | 4459,17 | 4441,93 | 4360,57 | 4332,80 | 4352,23 | 4402,74 | 4473,25 | 4537,83 | 4587,46 | 4563,77 | 4541,64 | 4518,01 | 4509,62 | -6,29 |
A. Enteric fermentation | 2414,60 | 2414,60 | 2388,50 | 2403,61 | 2389,40 | 2428,97 | 2429,73 | 2446,93 | 2407,51 | 2408,89 | 2445,24 | 2339,18 | 2321,30 | 2313,31 | 2347,93 | 2316,47 | 2323,33 | 2270,22 | 2249,14 | 2249,08 | 2281,14 | 2261,57 | 2202,00 | 2207,34 | 2229,76 | 2246,90 | 2282,98 | 2 330,98 | 2 323,97 | 2 307,24 | 2 242,72 | 2 232,70 | -7,53 |
B. Manure management | 486,25 | 486,25 | 490,87 | 496,49 | 481,08 | 486,15 | 484,52 | 494,84 | 484,97 | 488,27 | 495,25 | 472,99 | 480,13 | 478,70 | 498,88 | 498,42 | 504,73 | 501,41 | 506,04 | 508,82 | 517,53 | 521,90 | 510,63 | 517,16 | 524,41 | 525,10 | 529,65 | 535,88 | 532,48 | 532,64 | 519,24 | 516,80 | 6,28 |
C. Rice cultivation | NO | NO | NO | NO | NO | NO | NO | NO | NO | NO | NO | NO | NO | NO | NO | NO | NO | NO | NO | NO | NO | NO | NO | NO | NO | NO | NO | NO | NO | NO | NO | NO | 0,00 |
D. Agricultural soils | 1644,39 | 1644,39 | 1637,71 | 1631,96 | 1621,56 | 1604,93 | 1622,41 | 1640,79 | 1639,45 | 1646,31 | 1624,35 | 1622,23 | 1583,65 | 1582,59 | 1618,61 | 1627,55 | 1625,15 | 1601,03 | 1615,87 | 1599,78 | 1551,01 | 1494,66 | 1538,80 | 1544,34 | 1563,82 | 1608,74 | 1631,20 | 1 628,09 | 1 609,82 | 1 596,49 | 1 637,71 | 1 628,95 | -0,94 |
E. Prescribed burning of savannas | NO | NO | NO | NO | NO | NO | NO | NO | NO | NO | NO | NO | NO | NO | NO | NO | NO | NO | NO | NO | NO | NO | NO | NO | NO | NO | NO | NO | NO | NO | NO | NO | 0,00 |
F. Field burning of agricultural residues | 35,53 | 35,53 | 27,93 | 15,20 | 21,01 | 15,08 | 18,69 | 20,39 | 14,67 | 15,41 | 13,84 | 14,75 | 11,63 | 8,71 | 7,32 | 8,21 | 6,89 | 5,75 | 5,46 | 5,77 | 3,98 | 4,11 | 3,11 | 3,29 | 2,92 | 3,74 | 4,11 | 4,01 | 3,96 | 2,25 | 3,94 | 3,77 | -89,40 |
G. Liming | 230,97 | 230,97 | 200,64 | 165,65 | 193,27 | 173,17 | 193,31 | 179,91 | 180,07 | 160,07 | 158,51 | 137,11 | 139,48 | 135,64 | 123,87 | 110,25 | 109,18 | 103,80 | 97,48 | 94,83 | 86,92 | 78,01 | 77,93 | 79,87 | 81,67 | 88,61 | 89,68 | 88,31 | 93,44 | 102,91 | 114,30 | 127,32 | -44,88 |
H. Urea application | 0,55 | 0,55 | 0,55 | 0,55 | 0,55 | 0,55 | 0,55 | 0,55 | 0,55 | 0,55 | 0,55 | 0,11 | 0,07 | 0,43 | 0,07 | 1,22 | 0,10 | 0,12 | 1,17 | 0,89 | 1,35 | 0,32 | 0,33 | 0,23 | 0,16 | 0,16 | 0,22 | 0,19 | 0,09 | 0,10 | 0,10 | 0,08 | -85,20 |
I. Other carbon-containing fertilizers | NO | NO | NO | NO | NO | NO | NO | NO | NO | NO | NO | NO | NO | NO | NO | NO | NO | NO | NO | NO | NO | NO | NO | NO | NO | NO | NO | NO | NO | NO | NO | NO | 0,00 |
J. Other | NO | NO | NO | NO | NO | NO | NO | NO | NO | NO | NO | NO | NO | NO | NO | NO | NO | NO | NO | NO | NO | NO | NO | NO | NO | NO | NO | NO | NO | NO | NO | NO | 0,00 |
4. Land use, land-use change and forestry(2) | -10541,90 | -10541,90 | -12330,13 | -11740,85 | -13271,17 | -11197,81 | -15443,54 | -14511,88 | -13203,30 | -15440,22 | -17002,74 | -18640,90 | -20606,62 | -21704,18 | -23317,02 | -22993,76 | -20329,21 | -22283,16 | -22369,97 | -23699,42 | -27118,89 | -23715,80 | -25014,59 | -21362,33 | -21877,45 | -18097,56 | -13100,88 | -12836,43 | -13862,74 | -14601,45 | -16436,02 | -20332,31 | 92,87 |
A. Forest land | -13254,69 | -13254,69 | -15077,69 | -14832,06 | -16419,82 | -14159,53 | -18415,58 | -17839,51 | -17111,66 | -19229,74 | -20697,25 | -22675,50 | -24706,37 | -25854,70 | -27452,64 | -26985,81 | -24134,54 | -26217,01 | -26339,05 | -28192,79 | -32060,89 | -29570,18 | -30071,04 | -26537,42 | -26879,43 | -23381,93 | -18567,71 | -17 884,67 | -18 644,80 | -19 423,09 | -21 070,33 | -24 503,77 | 84,87 |
B. Cropland | 2003,68 | 2003,68 | 1996,24 | 1992,66 | 1992,21 | 1996,17 | 2064,27 | 2041,31 | 2167,41 | 2171,17 | 2141,59 | 2105,12 | 2204,05 | 2112,79 | 2106,35 | 2101,96 | 2105,15 | 2172,99 | 2169,13 | 2191,34 | 2199,22 | 2296,02 | 2237,21 | 2277,48 | 2272,74 | 2224,01 | 2287,91 | 2 238,30 | 2 222,13 | 2 223,12 | 2 264,55 | 2 235,30 | 11,56 |
C. Grassland | -250,31 | -250,31 | -248,50 | -245,45 | -240,70 | -235,53 | -189,15 | -55,68 | 9,04 | -18,08 | 3,74 | -27,60 | -124,21 | -137,54 | -79,79 | -137,81 | 95,93 | 194,08 | 287,01 | 426,81 | 577,32 | 458,06 | 501,73 | 396,51 | 193,06 | 30,63 | 97,12 | -40,24 | 40,43 | 134,05 | 215,39 | 167,94 | -167,09 |
D. Wetlands | 258,40 | 258,40 | 256,31 | 266,95 | 256,51 | 254,56 | 263,78 | 268,98 | 306,29 | 301,39 | 295,42 | 293,36 | 294,88 | 271,84 | 311,03 | 314,05 | 335,07 | 329,65 | 307,17 | 351,98 | 330,39 | 319,37 | 319,94 | 315,78 | 287,23 | 289,13 | 281,68 | 278,25 | 297,22 | 316,72 | 312,20 | 308,93 | 19,56 |
E. Settlements | 1665,65 | 1665,65 | 1629,81 | 1632,29 | 1600,37 | 1639,89 | 1806,30 | 1858,95 | 2031,37 | 2003,01 | 2076,41 | 2156,77 | 2212,88 | 2206,98 | 1885,67 | 1867,23 | 1705,45 | 1613,88 | 1521,68 | 1722,95 | 1724,45 | 2057,32 | 1864,56 | 1971,11 | 1792,51 | 2143,46 | 2537,19 | 2 434,51 | 2 404,87 | 2 477,32 | 2 264,58 | 1 857,43 | 11,51 |
F. Other land | NO | NO | NO | NO | NO | NO | NO | NO | NO | NO | NO | NO | NO | NO | NO | NO | NO | NO | NO | NO | NO | NO | NO | NO | NO | NO | NO | NO | NO | NO | NO | NO | 0,00 |
G. Harvested wood products | -999,88 | -999,88 | -921,73 | -590,44 | -494,47 | -727,71 | -1007,91 | -821,64 | -644,16 | -708,29 | -865,23 | -536,89 | -532,35 | -348,13 | -132,28 | -197,53 | -480,90 | -422,09 | -361,64 | -246,68 | 62,60 | 674,05 | 82,86 | 163,74 | 405,96 | 546,73 | 211,94 | 83,81 | -235,98 | -381,69 | -473,57 | -449,25 | -55,07 |
H. Other | 31,15 | 31,15 | 30,79 | 30,44 | 30,08 | 29,73 | 30,14 | 31,19 | 33,25 | 35,32 | 37,30 | 38,50 | 39,08 | 38,76 | 38,60 | 38,75 | 39,01 | 39,70 | 40,69 | 41,50 | 42,02 | 42,99 | 43,53 | 43,66 | 43,91 | 44,53 | 45,01 | 45,49 | 45,16 | 44,77 | 44,20 | 43,69 | 40,29 |
5. Waste | 2402,56 | 2402,56 | 2304,71 | 2286,65 | 2295,87 | 2287,53 | 2305,60 | 2219,05 | 2181,25 | 2013,26 | 1963,40 | 2066,13 | 2020,08 | 1923,76 | 1882,51 | 1889,90 | 1796,57 | 1810,09 | 1800,70 | 1729,93 | 1691,32 | 1788,27 | 1848,79 | 1752,89 | 1714,11 | 1726,23 | 1641,79 | 1605,49 | 1528,16 | 1513,59 | 1381,98 | 1350,73 | -43,78 |
A. Solid waste disposal | 2061,76 | 2061,76 | 1965,15 | 1934,42 | 1941,50 | 1936,51 | 1948,15 | 1867,39 | 1825,08 | 1664,25 | 1582,57 | 1634,76 | 1565,57 | 1491,84 | 1474,28 | 1462,12 | 1374,01 | 1392,57 | 1362,95 | 1302,66 | 1317,49 | 1291,12 | 1276,29 | 1234,01 | 1197,53 | 1169,30 | 1103,23 | 1 038,91 | 978,22 | 940,59 | 877,22 | 843,24 | -59,10 |
B. Biological treatment of solid waste | 5,22 | 5,22 | 5,24 | 7,34 | 9,51 | 12,06 | 19,67 | 21,53 | 25,44 | 29,32 | 42,02 | 53,29 | 64,99 | 63,63 | 62,88 | 74,75 | 72,46 | 72,98 | 89,92 | 88,09 | 81,47 | 83,10 | 72,87 | 90,16 | 97,89 | 78,30 | 79,71 | 87,41 | 73,47 | 84,24 | 67,16 | 64,94 | 1143,33 |
C. Incineration and open burning of waste | 16,03 | 16,03 | 23,82 | 23,63 | 29,21 | 25,31 | 23,71 | 26,63 | 27,19 | 29,23 | 45,33 | 91,12 | 101,07 | 99,65 | 68,61 | 78,96 | 78,25 | 72,77 | 75,03 | 69,97 | 19,79 | 129,94 | 175,97 | 157,29 | 153,42 | 212,77 | 183,61 | 195,46 | 200,96 | 213,66 | 165,56 | 167,92 | 947,69 |
D. Waste water treatment and discharge | 319,55 | 319,55 | 310,50 | 321,26 | 315,64 | 313,65 | 314,07 | 303,50 | 303,53 | 290,45 | 293,48 | 286,95 | 288,45 | 268,63 | 276,75 | 274,07 | 271,84 | 271,77 | 272,80 | 269,20 | 272,58 | 284,10 | 323,67 | 271,43 | 265,27 | 265,87 | 275,25 | 283,71 | 275,51 | 275,10 | 272,05 | 274,63 | -14,06 |
E. Other | NO | NO | NO | NO | NO | NO | NO | NO | NO | NO | NO | NO | NO | NO | NO | NO | NO | NO | NO | NO | NO | NO | NO | NO | NO | NO | NO | NO | NO | NO | NO | NO | 0,00 |
6. Other (as specified in summary 1.A) | |||||||||||||||||||||||||||||||||
Memo items: | |||||||||||||||||||||||||||||||||
International bunkers | 3034,96 | 3034,96 | 2671,21 | 2866,89 | 2854,08 | 2769,59 | 2945,72 | 3349,12 | 3989,83 | 4027,31 | 3940,66 | 3830,01 | 3688,80 | 3089,48 | 2967,40 | 3030,76 | 3610,39 | 3572,99 | 3667,38 | 3431,73 | 3306,51 | 3039,25 | 3120,20 | 3179,13 | 3164,95 | 2887,37 | 2816,48 | 2581,28 | 2758,93 | 2974,36 | 2827,70 | 1584,34 | -47,80 |
Aviation | 653,20 | 653,20 | 592,36 | 635,33 | 644,18 | 626,54 | 572,03 | 678,52 | 757,79 | 809,85 | 932,21 | 899,73 | 816,48 | 717,52 | 732,99 | 823,32 | 924,48 | 1111,86 | 1150,90 | 1139,00 | 1101,39 | 1309,32 | 1378,43 | 1529,29 | 1622,10 | 1705,29 | 1649,87 | 1 612,63 | 1 696,21 | 1 777,31 | 1 708,55 | 539,27 | -17,44 |
Navigation | 2381,76 | 2381,76 | 2078,86 | 2231,56 | 2209,89 | 2143,05 | 2373,69 | 2670,60 | 3232,04 | 3217,46 | 3008,45 | 2930,28 | 2872,32 | 2371,96 | 2234,41 | 2207,44 | 2685,91 | 2461,13 | 2516,48 | 2292,73 | 2205,12 | 1729,93 | 1741,77 | 1649,85 | 1542,84 | 1182,08 | 1166,61 | 968,65 | 1 062,72 | 1 197,04 | 1 119,15 | 1 045,07 | -56,12 |
Multilateral operations | NO | NO | NO | NO | NO | NO | NO | NO | NO | NO | NO | NO | NO | NO | NO | NO | NO | NO | NO | NO | NO | NO | NO | NO | NO | NO | NO | NO | NO | NO | NO | NO | 0,00 |
CO2 emissions from biomass | 4488,51 | 4488,51 | 4394,37 | 4115,19 | 4428,84 | 4759,57 | 4854,02 | 4863,41 | 5035,57 | 4677,61 | 4854,73 | 4712,58 | 5111,91 | 5198,28 | 5329,15 | 5109,54 | 5249,77 | 5358,74 | 5592,87 | 5841,39 | 5257,07 | 6461,52 | 6207,52 | 5667,04 | 4980,86 | 3672,28 | 4012,28 | 4 440,09 | 5 272,02 | 4 971,62 | 5 422,82 | 5 019,82 | 11,84 |
CO2 captured | NO | NO | NO | NO | NO | NO | NO | 152,01 | 695,01 | 847,20 | 981,11 | 942,32 | 1013,06 | 963,57 | 938,92 | 772,38 | 865,35 | 823,08 | 998,94 | 1120,19 | 1224,16 | 1299,73 | 1423,51 | 1394,61 | 1243,34 | 1289,12 | 1428,62 | 1 392,77 | 1 367,38 | 1 374,84 | 1 380,68 | 1 086,03 | 100,00 |
Long-term storage of C in waste disposal sites | 18073,68 | 18073,68 | 18694,48 | 19290,03 | 19860,46 | 20405,76 | 20926,78 | 21441,28 | 21940,08 | 22429,89 | 22871,69 | 23289,12 | 23660,81 | 24033,31 | 24390,81 | 24758,01 | 25105,84 | 25468,15 | 25838,57 | 26191,49 | 26426,48 | 26543,30 | 26595,16 | 26602,20 | 26602,93 | 26603,94 | 26607,81 | 26 612,02 | 26 615,34 | 26 621,70 | 26 628,07 | 26 611,68 | 47,24 |
Indirect N2O | 280,46 | 280,46 | 270,61 | 275,82 | 284,35 | 291,20 | 308,83 | 323,30 | 336,18 | 338,98 | 329,54 | 312,43 | 310,60 | 301,65 | 303,80 | 301,68 | 302,19 | 303,08 | 307,49 | 298,41 | 282,42 | 289,01 | 285,33 | 280,03 | 274,28 | 271,06 | 258,78 | 245,72 | 238,85 | 234,43 | 223,78 | 208,80 | -25,55 |
Indirect CO2 (3) | NE,NA,IE | NE,NA,IE | NE,NA,IE | NE,NA,IE | NE,NA,IE | NE,NA,IE | NE,NA,IE | NE,NA,IE | NE,NA,IE | NE,NA,IE | NE,NA,IE | NE,NA,IE | NE,NA,IE | NE,NA,IE | NE,NA,IE | NE,NA,IE | NE,NA,IE | NE,NA,IE | NE,NA,IE | NE,NA,IE | NE,NA,IE | NE,NA,IE | NE,NA,IE | NE,NA,IE | NE,NA,IE | NE,NA,IE | NE,IE,NA | NE,IE,NA | NE,IE,NA | NE,IE,NA | NE,IE,NA | NE,IE,NA | 0,00 |
Total CO2 equivalent emissions without land use, land-use change and forestry | 51431,79 | 51431,79 | 49025,05 | 47367,61 | 49331,79 | 51236,05 | 51631,42 | 54511,43 | 54533,10 | 54560,82 | 55582,86 | 54922,38 | 56192,66 | 55009,78 | 55613,21 | 56014,00 | 54945,19 | 54933,79 | 56604,91 | 55131,03 | 52672,11 | 54938,67 | 53990,82 | 53412,71 | 53671,56 | 54040,58 | 54488,25 | 53585,78 | 52840,35 | 52871,07 | 51086,03 | 49272,55 | -4,20 |
Total CO2 equivalent emissions with land use, land-use change and forestry | 40889,89 | 40889,89 | 36694,92 | 35626,76 | 36060,62 | 40038,24 | 36187,88 | 39999,55 | 41329,80 | 39120,60 | 38580,12 | 36281,48 | 35586,04 | 33305,60 | 32296,20 | 33020,24 | 34615,98 | 32650,63 | 34234,94 | 31431,61 | 25553,22 | 31222,87 | 28976,22 | 32050,38 | 31794,10 | 35943,02 | 41387,37 | 40749,35 | 38977,60 | 38269,63 | 34650,02 | 28940,24 | -29,22 |
Total CO2 equivalent emissions, including indirect CO2, without land use, land-use change and forestry | NA | NA | NA | NA | NA | NA | NA | NA | NA | NA | NA | NA | NA | NA | NA | NA | NA | NA | NA | NA | NA | NA | NA | NA | NA | NA | NA | NA | NA | NA | NA | NA | 0,00 |
Total CO2 equivalent emissions, including indirect CO2, with land use, land-use change and forestry | NA | NA | NA | NA | NA | NA | NA | NA | NA | NA | NA | NA | NA | NA | NA | NA | NA | NA | NA | NA | NA | NA | NA | NA | NA | NA | NA | NA | NA | NA | NA | NA | 0,00 |
Table 10.1
Table AI-2 CRF TABLE 10S2: NORWAY’S EMISSIONS AND REMOVALS OF CARBON DIOXIDE (CO2) DURING THE PERIOD 1990–2020.
GREENHOUSE GAS SOURCE AND SINK CATEGORIES | Base year(1) | 1990 | 1991 | 1992 | 1993 | 1994 | 1995 | 1996 | 1997 | 1998 | 1999 | 2000 | 2001 | 2002 | 2003 | 2004 | 2005 | 2006 | 2007 | 2008 | 2009 | 2010 | 2011 | 2012 | 2013 | 2014 | 2015 | 2016 | 2017 | 2018 | 2019 | 2020 | Change from base to latest reported year | ||
|---|---|---|---|---|---|---|---|---|---|---|---|---|---|---|---|---|---|---|---|---|---|---|---|---|---|---|---|---|---|---|---|---|---|---|---|
(kt) | % | ||||||||||||||||||||||||||||||||||
1. Energy | 27584,55 | 27584,55 | 26528,01 | 27554,82 | 28539,79 | 30082,51 | 30562,92 | 33538,40 | 33250,84 | 33225,89 | 34226,73 | 33296,51 | 34983,36 | 34740,01 | 36010,09 | 35769,26 | 35339,41 | 36241,16 | 37820,68 | 36623,44 | 36663,68 | 38143,30 | 37096,00 | 36671,43 | 36852,77 | 37168,60 | 37612,49 | 36835,27 | 36254,24 | 36295,94 | 34729,92 | 32979,39 | 19,56 | ||
A. Fuel combustion (sectoral approach) | 24707,26 | 24707,26 | 24293,25 | 25005,13 | 25830,16 | 27244,52 | 27811,77 | 30326,58 | 30280,75 | 30103,26 | 30498,36 | 29354,12 | 31403,06 | 31701,12 | 33091,09 | 33026,95 | 32658,80 | 33624,96 | 33923,22 | 33421,79 | 34122,16 | 35411,23 | 34365,54 | 33942,76 | 34175,95 | 34866,23 | 35029,07 | 34363,27 | 33948,46 | 34097,73 | 33064,42 | 31456,89 | 27,32 | ||
1. Energy industries | 7200,38 | 7200,38 | 7543,07 | 8096,92 | 8366,01 | 9080,58 | 8986,95 | 9857,85 | 10223,66 | 9909,91 | 9864,29 | 10776,09 | 11982,91 | 12243,18 | 12981,28 | 13064,88 | 13315,51 | 13277,46 | 13605,98 | 13628,70 | 14605,33 | 14746,31 | 14330,14 | 14032,54 | 14082,09 | 14759,91 | 15248,01 | 14 793,89 | 15 179,83 | 15 007,35 | 14 850,22 | 14 159,61 | 96,65 | ||
2. Manufacturing industries and construction | 3382,13 | 3382,13 | 3125,62 | 3192,31 | 3411,81 | 4016,76 | 3904,09 | 4357,29 | 4116,08 | 4095,43 | 3827,84 | 3439,92 | 3495,81 | 3358,11 | 3549,91 | 3378,20 | 3203,16 | 3510,48 | 3432,51 | 3372,79 | 3071,60 | 3366,27 | 3183,97 | 3045,21 | 3176,01 | 2966,32 | 2955,03 | 2 910,68 | 3 015,67 | 3 117,48 | 2 935,60 | 2 857,07 | -15,52 | ||
3. Transport | 9887,80 | 9887,80 | 9635,93 | 9856,96 | 10155,17 | 10114,64 | 10824,51 | 11350,56 | 11613,17 | 11918,36 | 12586,16 | 11784,97 | 12125,11 | 12028,57 | 12579,37 | 12800,62 | 12855,53 | 13369,71 | 13662,36 | 13440,78 | 13220,32 | 13845,11 | 13894,94 | 14019,03 | 14044,40 | 14390,71 | 14088,07 | 13 595,57 | 12 792,54 | 13 005,08 | 12 486,97 | 11 707,63 | 18,40 | ||
4. Other sectors | 3884,93 | 3884,93 | 3671,02 | 3541,63 | 3649,59 | 3631,46 | 3626,45 | 4312,91 | 3903,80 | 3808,26 | 3810,04 | 3164,49 | 3498,69 | 3605,64 | 3807,83 | 3454,61 | 3032,52 | 3233,29 | 3052,30 | 2851,28 | 3040,56 | 3254,43 | 2743,40 | 2648,80 | 2665,84 | 2536,91 | 2557,00 | 2 881,19 | 2 772,60 | 2 820,10 | 2 678,76 | 2 634,25 | -32,19 | ||
5. Other | 352,02 | 352,02 | 317,60 | 317,32 | 247,58 | 401,08 | 469,76 | 447,97 | 424,05 | 371,29 | 410,03 | 188,66 | 300,54 | 465,62 | 172,71 | 328,64 | 252,07 | 234,01 | 170,07 | 128,24 | 184,35 | 199,11 | 213,08 | 197,18 | 207,62 | 212,39 | 180,96 | 181,95 | 187,83 | 147,72 | 112,87 | 98,33 | -72,07 | ||
B. Fugitive emissions from fuels | 2877,29 | 2877,29 | 2234,76 | 2549,69 | 2709,63 | 2837,99 | 2751,15 | 3129,81 | 2940,09 | 3117,43 | 3718,26 | 3933,06 | 3576,25 | 3030,32 | 2894,08 | 2719,93 | 2673,42 | 2612,73 | 3819,54 | 3092,66 | 2485,09 | 2635,28 | 2639,29 | 2665,76 | 2643,29 | 2258,35 | 2541,45 | 2461,35 | 2298,15 | 2184,23 | 1654,24 | 1518,86 | -47,21 | ||
1. Solid fuels | 20,43 | 20,43 | 20,15 | 17,75 | 18,24 | 17,84 | 17,40 | 17,35 | 15,90 | 16,06 | 18,38 | 19,27 | 17,92 | 16,90 | 22,29 | 16,45 | 14,86 | 13,26 | 17,39 | 13,76 | 11,96 | 11,25 | 12,50 | 10,49 | 13,60 | 13,30 | 10,99 | 10,23 | 8,81 | 8,78 | 8,67 | 8,52 | -58,26 | ||
2. Oil and natural gas and other emissions from energy production | 2856,87 | 2856,87 | 2214,61 | 2531,94 | 2691,39 | 2820,14 | 2733,76 | 3112,46 | 2924,19 | 3101,37 | 3699,87 | 3913,79 | 3558,34 | 3013,42 | 2871,79 | 2703,48 | 2658,56 | 2599,47 | 3802,14 | 3078,91 | 2473,14 | 2624,03 | 2626,78 | 2655,27 | 2629,69 | 2245,05 | 2530,46 | 2 451,12 | 2 289,34 | 2 175,44 | 1 645,57 | 1 510,34 | -47,13 | ||
C. CO2 transport and storage | NO,NE | NO,NE | NO,NE | NO,NE | NO,NE | NO,NE | NO,NE | 82,01 | 30,01 | 5,20 | 10,11 | 9,32 | 4,06 | 8,57 | 24,92 | 22,38 | 7,20 | 3,48 | 77,92 | 108,98 | 56,42 | 96,79 | 91,17 | 62,91 | 33,53 | 44,02 | 41,97 | 10,64 | 7,64 | 13,99 | 11,26 | 3,64 | 100,00 | ||
2. Industrial processes | 7265,19 | 7265,19 | 6783,70 | 6712,33 | 7239,19 | 7623,17 | 7728,96 | 7827,68 | 8277,41 | 8456,82 | 8207,84 | 8627,66 | 8307,05 | 7621,62 | 7779,40 | 8351,78 | 7817,82 | 7511,82 | 7674,47 | 8008,37 | 6453,93 | 7344,72 | 7448,41 | 7393,35 | 7504,65 | 7584,13 | 7711,69 | 7652,84 | 7702,24 | 7788,48 | 7781,46 | 7928,98 | 9,14 | ||
A. Mineral industry | 727,69 | 727,69 | 680,89 | 739,68 | 925,03 | 943,44 | 990,33 | 991,84 | 1056,44 | 1035,21 | 1002,25 | 1013,11 | 982,34 | 992,09 | 1045,77 | 858,67 | 920,73 | 957,28 | 1017,33 | 1043,31 | 1011,17 | 1023,11 | 1013,81 | 998,18 | 1055,06 | 1055,67 | 987,09 | 971,60 | 1 025,33 | 992,22 | 999,89 | 963,76 | 32,44 | ||
B. Chemical industry | 2051,70 | 2051,70 | 1997,10 | 1860,51 | 1929,15 | 2010,35 | 1977,09 | 2072,19 | 2300,98 | 2167,77 | 1856,45 | 2254,31 | 2291,27 | 2060,82 | 2144,48 | 2268,24 | 1917,80 | 2142,16 | 1915,14 | 2052,14 | 1818,77 | 1940,72 | 1945,06 | 1891,99 | 1815,18 | 1726,28 | 1923,81 | 1 734,45 | 1 644,76 | 1 819,20 | 1 748,83 | 1 783,54 | -13,07 | ||
C. Metal industry | 4167,07 | 4167,07 | 3797,71 | 3807,23 | 4073,79 | 4360,92 | 4478,86 | 4468,91 | 4615,87 | 4975,50 | 5073,60 | 5090,29 | 4757,56 | 4291,05 | 4294,53 | 4924,77 | 4682,53 | 4131,70 | 4446,31 | 4617,83 | 3349,82 | 4077,86 | 4170,57 | 4187,15 | 4310,87 | 4481,21 | 4488,37 | 4 613,07 | 4 702,19 | 4 637,89 | 4 731,66 | 4 835,21 | 16,03 | ||
D. Non-energy products from fuels and solvent use | 287,45 | 287,45 | 265,05 | 263,68 | 268,07 | 265,66 | 235,72 | 247,97 | 247,80 | 222,64 | 218,73 | 207,19 | 204,72 | 203,76 | 209,59 | 211,75 | 204,23 | 194,81 | 206,46 | 204,75 | 190,09 | 208,09 | 218,43 | 211,42 | 222,44 | 221,08 | 203,87 | 218,13 | 216,36 | 217,40 | 187,40 | 226,88 | -21,07 | ||
E. Electronic industry | |||||||||||||||||||||||||||||||||||
F. Product uses as ODS substitutes | |||||||||||||||||||||||||||||||||||
G. Other product manufacture and use | NO | NO | NO | NO | NO | NO | NO | NO | NO | NO | NO | NO | NO | NO | NO | NO | NO | NO | NO | NO | NO | NO | NO | NO | NO | NO | NO | NO | NO | NO | NO | NO | 0,00 | ||
H. Other | 31,27 | 31,27 | 42,95 | 41,23 | 43,14 | 42,79 | 46,97 | 46,77 | 56,33 | 55,70 | 56,80 | 62,76 | 71,16 | 73,90 | 85,03 | 88,35 | 92,53 | 85,88 | 89,23 | 90,35 | 84,08 | 94,94 | 100,54 | 104,61 | 101,11 | 99,89 | 108,55 | 115,59 | 113,60 | 121,77 | 113,68 | 119,58 | 282,38 | ||
3. Agriculture | 231,52 | 231,52 | 201,20 | 166,20 | 193,82 | 173,72 | 193,86 | 180,46 | 180,63 | 160,63 | 159,06 | 137,22 | 139,56 | 136,07 | 123,95 | 111,46 | 109,28 | 103,93 | 98,65 | 95,72 | 88,27 | 78,33 | 78,26 | 80,10 | 81,83 | 88,77 | 89,89 | 88,50 | 93,53 | 103,01 | 114,41 | 127,40 | -44,97 | ||
A. Enteric fermentation | |||||||||||||||||||||||||||||||||||
B. Manure management | |||||||||||||||||||||||||||||||||||
C. Rice cultivation | |||||||||||||||||||||||||||||||||||
D. Agricultural soils | |||||||||||||||||||||||||||||||||||
E. Prescribed burning of savannas | |||||||||||||||||||||||||||||||||||
F. Field burning of agricultural residues | |||||||||||||||||||||||||||||||||||
G. Liming | 230,97 | 230,97 | 200,64 | 165,65 | 193,27 | 173,17 | 193,31 | 179,91 | 180,07 | 160,07 | 158,51 | 137,11 | 139,48 | 135,64 | 123,87 | 110,25 | 109,18 | 103,80 | 97,48 | 94,83 | 86,92 | 78,01 | 77,93 | 79,87 | 81,67 | 88,61 | 89,68 | 88,31 | 93,44 | 102,91 | 114,30 | 127,32 | -44,88 | ||
H. Urea application | 0,55 | 0,55 | 0,55 | 0,55 | 0,55 | 0,55 | 0,55 | 0,55 | 0,55 | 0,55 | 0,55 | 0,11 | 0,07 | 0,43 | 0,07 | 1,22 | 0,10 | 0,12 | 1,17 | 0,89 | 1,35 | 0,32 | 0,33 | 0,23 | 0,16 | 0,16 | 0,22 | 0,19 | 0,09 | 0,10 | 0,10 | 0,08 | -85,20 | ||
I. Other carbon-containing fertilizers | NO | NO | NO | NO | NO | NO | NO | NO | NO | NO | NO | NO | NO | NO | NO | NO | NO | NO | NO | NO | NO | NO | NO | NO | NO | NO | NO | NO | NO | NO | NO | NO | 0,00 | ||
J. Other | NO | NO | NO | NO | NO | NO | NO | NO | NO | NO | NO | NO | NO | NO | NO | NO | NO | NO | NO | NO | NO | NO | NO | NO | NO | NO | NO | NO | NO | NO | NO | NO | 0,00 | ||
4. Land use, land-use change and forestry (2) | -10948,30 | -10948,30 | -12739,44 | -12150,84 | -13679,79 | -11606,76 | -15853,19 | -14923,02 | -13619,59 | -15859,81 | -17424,50 | -19064,03 | -21031,07 | -22130,48 | -23744,95 | -23419,68 | -20756,92 | -22715,37 | -22797,73 | -24135,82 | -27552,95 | -24155,48 | -25453,99 | -21803,33 | -22317,81 | -18537,63 | -13541,77 | -13285,08 | -14311,28 | -15049,04 | -16881,59 | -20778,65 | 89,79 | ||
A. Forest land | -13477,41 | -13477,41 | -15302,08 | -15056,56 | -16642,85 | -14382,96 | -18639,11 | -18063,76 | -17336,23 | -19455,61 | -20921,66 | -22898,58 | -24928,67 | -26077,22 | -27675,14 | -27207,33 | -24356,05 | -26442,21 | -26560,94 | -28421,14 | -32284,64 | -29795,13 | -30294,45 | -26761,63 | -27103,87 | -23606,80 | -18792,13 | -18 113,01 | -18 873,40 | -19 651,79 | -21 297,94 | -24 731,60 | 83,50 | ||
B. Cropland | 1916,04 | 1916,04 | 1908,48 | 1904,79 | 1904,22 | 1908,07 | 1976,02 | 1952,68 | 2078,13 | 2081,25 | 2051,03 | 2013,94 | 2112,17 | 2020,65 | 2013,97 | 2009,11 | 2011,83 | 2080,00 | 2076,42 | 2098,85 | 2107,10 | 2204,13 | 2144,78 | 2184,62 | 2179,47 | 2130,18 | 2193,53 | 2 143,58 | 2 127,09 | 2 127,76 | 2 168,92 | 2 139,42 | 11,66 | ||
C. Grassland | -261,25 | -261,25 | -259,24 | -255,98 | -251,02 | -245,65 | -199,07 | -65,39 | -0,89 | -27,79 | -6,03 | -37,94 | -134,86 | -148,29 | -90,75 | -148,93 | 84,65 | 182,60 | 275,09 | 414,47 | 564,42 | 442,40 | 486,10 | 381,13 | 178,21 | 15,85 | 82,17 | -55,28 | 25,59 | 118,54 | 200,10 | 153,14 | -158,62 | ||
D. Wetlands | 219,25 | 219,25 | 216,73 | 226,94 | 216,07 | 213,69 | 222,77 | 228,13 | 265,44 | 260,53 | 254,50 | 252,38 | 253,45 | 230,12 | 269,03 | 271,76 | 292,50 | 287,07 | 264,59 | 309,41 | 287,81 | 276,51 | 277,08 | 272,92 | 244,37 | 246,27 | 238,82 | 235,39 | 254,65 | 274,43 | 270,20 | 267,22 | 21,88 | ||
E. Settlements | 1654,96 | 1654,96 | 1618,40 | 1620,40 | 1588,27 | 1627,80 | 1794,10 | 1846,97 | 2018,11 | 1990,11 | 2062,90 | 2143,07 | 2199,19 | 2192,39 | 1870,23 | 1853,25 | 1691,05 | 1599,27 | 1508,75 | 1709,27 | 1709,76 | 2042,57 | 1849,64 | 1955,88 | 1778,04 | 2130,14 | 2523,89 | 2 420,43 | 2 390,78 | 2 463,72 | 2 250,69 | 1 842,43 | 11,33 | ||
F. Other land | NO | NO | NO | NO | NO | NO | NO | NO | NO | NO | NO | NO | NO | NO | NO | NO | NO | NO | NO | NO | NO | NO | NO | NO | NO | NO | NO | NO | NO | NO | NO | NO | 0,00 | ||
G. Harvested wood products | -999,88 | -999,88 | -921,73 | -590,44 | -494,47 | -727,71 | -1007,91 | -821,64 | -644,16 | -708,29 | -865,23 | -536,89 | -532,35 | -348,13 | -132,28 | -197,53 | -480,90 | -422,09 | -361,64 | -246,68 | 62,60 | 674,05 | 82,86 | 163,74 | 405,96 | 546,73 | 211,94 | 83,81 | -235,98 | -381,69 | -473,57 | -449,25 | -55,07 | ||
H. Other | NO,IE | NO,IE | NO,IE | NO,IE | NO,IE | NO,IE | NO,IE | NO,IE | NO,IE | NO,IE | NO,IE | NO,IE | NO,IE | NO,IE | NO,IE | NO,IE | NO,IE | NO,IE | NO,IE | NO,IE | NO,IE | NO,IE | NO,IE | NO,IE | NO,IE | NO,IE | NO,IE | NO,IE | NO,IE | NO,IE | NO,IE | NO,IE | 0,00 | ||
5. Waste | 15,36 | 15,36 | 22,84 | 22,64 | 28,00 | 24,28 | 22,74 | 25,51 | 26,04 | 27,96 | 43,39 | 87,42 | 97,00 | 95,66 | 65,84 | 75,79 | 75,11 | 69,83 | 72,01 | 67,12 | 18,90 | 124,66 | 168,72 | 151,07 | 147,38 | 204,26 | 176,24 | 187,58 | 192,83 | 205,01 | 158,76 | 160,98 | 947,85 | ||
A. Solid waste disposal | NO | NO | NO | NO | NO | NO | NO | NO | NO | NO | NO | NO | NO | NO | NO | NO | NO | NO | NO | NO | NO | NO | NO | NO | NO | NO | NO | NO | NO | NO | NO | NO | 0,00 | ||
B. Biological treatment of solid waste | |||||||||||||||||||||||||||||||||||
C. Incineration and open burning of waste | 15,36 | 15,36 | 22,84 | 22,64 | 28,00 | 24,28 | 22,74 | 25,51 | 26,04 | 27,96 | 43,39 | 87,42 | 97,00 | 95,66 | 65,84 | 75,79 | 75,11 | 69,83 | 72,01 | 67,12 | 18,90 | 124,66 | 168,72 | 151,07 | 147,38 | 204,26 | 176,24 | 187,58 | 192,83 | 205,01 | 158,76 | 160,98 | 947,85 | ||
D. Waste water treatment and discharge | |||||||||||||||||||||||||||||||||||
E. Other | NO | NO | NO | NO | NO | NO | NO | NO | NO | NO | NO | NO | NO | NO | NO | NO | NO | NO | NO | NO | NO | NO | NO | NO | NO | NO | NO | NO | NO | NO | NO | NO | 0,00 | ||
6. Other (as specified in summary 1.A) | |||||||||||||||||||||||||||||||||||
Memo items: | |||||||||||||||||||||||||||||||||||
International bunkers | 2944,71 | 2944,71 | 2592,09 | 2781,90 | 2769,76 | 2687,73 | 2857,21 | 3248,40 | 3868,58 | 3905,78 | 3825,01 | 3716,26 | 3578,16 | 2998,15 | 2880,89 | 2944,01 | 3506,73 | 3474,22 | 3567,15 | 3340,21 | 3219,53 | 2964,94 | 3045,21 | 3105,30 | 3093,53 | 2825,79 | 2725,58 | 2486,20 | 2663,95 | 2869,18 | 2724,26 | 1497,67 | -49,14 | ||
Aviation | 642,93 | 642,93 | 583,04 | 625,34 | 634,05 | 616,69 | 563,03 | 667,85 | 745,87 | 797,11 | 917,55 | 885,58 | 803,64 | 706,24 | 721,46 | 810,37 | 909,95 | 1094,38 | 1132,80 | 1121,09 | 1084,07 | 1288,73 | 1356,61 | 1504,96 | 1596,17 | 1677,96 | 1623,22 | 1 586,70 | 1 668,59 | 1 748,29 | 1 680,63 | 530,40 | -17,50 | ||
Navigation | 2301,78 | 2301,78 | 2009,05 | 2156,55 | 2135,70 | 2071,04 | 2294,18 | 2580,55 | 3122,71 | 3108,67 | 2907,46 | 2830,68 | 2774,52 | 2291,92 | 2159,42 | 2133,64 | 2596,78 | 2379,85 | 2434,34 | 2219,12 | 2135,45 | 1676,20 | 1688,59 | 1600,34 | 1497,37 | 1147,83 | 1102,36 | 899,49 | 995,36 | 1 120,88 | 1 043,63 | 967,27 | -57,98 | ||
Multilateral operations | NO | NO | NO | NO | NO | NO | NO | NO | NO | NO | NO | NO | NO | NO | NO | NO | NO | NO | NO | NO | NO | NO | NO | NO | NO | NO | NO | NO | NO | NO | NO | NO | 0,00 | ||
CO2 emissions from biomass | 4488,51 | 4488,51 | 4394,37 | 4115,19 | 4428,84 | 4759,57 | 4854,02 | 4863,41 | 5035,57 | 4677,61 | 4854,73 | 4712,58 | 5111,91 | 5198,28 | 5329,15 | 5109,54 | 5249,77 | 5358,74 | 5592,87 | 5841,39 | 5257,07 | 6461,52 | 6207,52 | 5667,04 | 4980,86 | 3672,28 | 4012,28 | 4 440,09 | 5 272,02 | 4 971,62 | 5 422,82 | 5 019,82 | 11,84 | ||
CO2 captured | NO | NO | NO | NO | NO | NO | NO | 152,01 | 695,01 | 847,20 | 981,11 | 942,32 | 1013,06 | 963,57 | 938,92 | 772,38 | 823,08 | 998,94 | 1120,19 | 1224,16 | 1299,73 | 1423,51 | 1394,61 | 1243,34 | 1289,12 | 1428,62 | 1 392,77 | 1 367,38 | 1 374,84 | 1 380,68 | 1 086,03 | 100,00 | |||
Long-term storage of C in waste disposal sites | 18073,68 | 18073,68 | 18694,48 | 19290,03 | 19860,46 | 20405,76 | 20926,78 | 21441,28 | 21940,08 | 22429,89 | 22871,69 | 23289,12 | 23660,81 | 24033,31 | 24390,81 | 24758,01 | 25105,84 | 25468,15 | 25838,57 | 26191,49 | 26426,48 | 26543,30 | 26595,16 | 26602,20 | 26602,93 | 26603,94 | 26607,81 | 26 612,02 | 26 615,34 | 26 621,70 | 26 628,07 | 26 611,68 | 47,24 | ||
Indirect N2O | |||||||||||||||||||||||||||||||||||
Indirect CO2 (3) | NE,NA,IE | NE,NA,IE | NE,NA,IE | NE,NA,IE | NE,NA,IE | NE,NA,IE | NE,NA,IE | NE,NA,IE | NE,NA,IE | NE,NA,IE | NE,NA,IE | NE,NA,IE | NE,NA,IE | NE,NA,IE | NE,NA,IE | NE,NA,IE | NE,NA,IE | NE,NA,IE | NE,NA,IE | NE,NA,IE | NE,NA,IE | NE,NA,IE | NE,NA,IE | NE,NA,IE | NE,NA,IE | NE,NA,IE | NE,IE,NA | NE,IE,NA | NE,IE,NA | NE,IE,NA | NE,IE,NA | NE,IE,NA | 0,00 | ||
Total CO2 equivalent emissions without land use, land-use change and forestry | 35096,63 | 35096,63 | 33535,74 | 34455,99 | 36000,79 | 37903,67 | 38508,48 | 41572,05 | 41734,92 | 41871,29 | 42637,01 | 42148,81 | 43526,97 | 42593,35 | 43979,27 | 44308,29 | 43341,62 | 43926,74 | 45665,81 | 44794,65 | 43224,78 | 45691,01 | 44791,39 | 44295,95 | 44586,63 | 45045,76 | 45590,31 | 44764,20 | 44242,84 | 44392,44 | 42784,54 | 41196,76 | 17,38 | ||
Total CO2 equivalent emissions with land use, land-use change and forestry | 24148,33 | 24148,33 | 20796,30 | 22305,15 | 22321,01 | 26296,91 | 22655,28 | 26649,03 | 28115,33 | 26011,48 | 25212,51 | 23084,77 | 22495,90 | 20462,88 | 20234,32 | 20888,61 | 22584,70 | 21211,37 | 22868,08 | 20658,84 | 15671,82 | 21535,54 | 19337,41 | 22492,62 | 22268,82 | 26508,13 | 32048,54 | 31479,11 | 29931,56 | 29343,41 | 25902,95 | 20418,11 | -15,45 | ||
Total CO2 equivalent emissions, including indirect CO2, without land use, land-use change and forestry | NA | NA | NA | NA | NA | NA | NA | NA | NA | NA | NA | NA | NA | NA | NA | NA | NA | NA | NA | NA | NA | NA | NA | NA | NA | NA | NA | NA | NA | NA | NA | NA | 0,00 | ||
Total CO2 equivalent emissions, including indirect CO2, with land use, land-use change and forestry | NA | NA | NA | NA | NA | NA | NA | NA | NA | NA | NA | NA | NA | NA | NA | NA | NA | NA | NA | NA | NA | NA | NA | NA | NA | NA | NA | NA | NA | NA | NA | NA | 0,00 | ||
Table 10.2
Table AI-3 CRF TABLE 10S3: NORWAY’S EMISSIONS OF METHANE (CH4) DURING THE PERIOD 1990–2020.
GREENHOUSE GAS SOURCE AND SINK CATEGORIES | Base year(1) | 1990 | 1991 | 1992 | 1993 | 1994 | 1995 | 1996 | 1997 | 1998 | 1999 | 2000 | 2001 | 2002 | 2003 | 2004 | 2005 | 2006 | 2007 | 2008 | 2009 | 2010 | 2011 | 2012 | 2013 | 2014 | 2015 | 2016 | 2017 | 2018 | 2019 | 2020 | Change from base to latest reported year |
|---|---|---|---|---|---|---|---|---|---|---|---|---|---|---|---|---|---|---|---|---|---|---|---|---|---|---|---|---|---|---|---|---|---|
(kt) | % | ||||||||||||||||||||||||||||||||
1. Energy | 43,60 | 43,60 | 43,68 | 47,36 | 53,68 | 55,95 | 55,34 | 58,17 | 62,51 | 59,83 | 59,26 | 62,19 | 64,87 | 63,81 | 61,52 | 58,65 | 55,81 | 51,58 | 56,59 | 52,98 | 52,80 | 53,98 | 51,04 | 50,48 | 47,71 | 46,29 | 46,78 | 43,29 | 41,17 | 39,84 | 38,79 | 39,72 | -8,89 |
A. Fuel combustion (sectoral approach) | 22,49 | 22,49 | 20,79 | 20,54 | 22,56 | 23,64 | 23,24 | 24,42 | 25,24 | 23,91 | 23,71 | 23,79 | 24,13 | 25,54 | 24,54 | 22,01 | 22,43 | 21,78 | 22,40 | 22,39 | 22,87 | 24,74 | 22,72 | 23,42 | 20,56 | 20,07 | 20,78 | 19,54 | 20,08 | 18,86 | 18,20 | 18,88 | -16,06 |
1. Energy industries | 2,13 | 2,13 | 2,24 | 2,42 | 2,52 | 2,61 | 2,63 | 2,82 | 3,01 | 2,88 | 2,67 | 3,05 | 3,40 | 3,54 | 3,84 | 4,01 | 3,96 | 3,81 | 4,01 | 4,21 | 4,65 | 4,97 | 4,66 | 4,63 | 4,39 | 4,84 | 5,17 | 4,80 | 4,88 | 4,83 | 4,89 | 4,72 | 121,62 |
2. Manufacturing industries and construction | 0,42 | 0,42 | 0,39 | 0,41 | 0,42 | 0,46 | 0,47 | 0,51 | 0,55 | 0,51 | 0,54 | 0,50 | 0,51 | 0,50 | 0,54 | 0,52 | 0,55 | 0,55 | 0,56 | 0,55 | 0,50 | 0,55 | 0,54 | 0,49 | 0,54 | 0,50 | 0,50 | 0,46 | 0,48 | 0,52 | 0,51 | 0,50 | 19,41 |
3. Transport | 3,33 | 3,33 | 3,14 | 3,02 | 2,95 | 2,83 | 2,84 | 2,65 | 2,57 | 2,40 | 2,28 | 2,10 | 1,99 | 1,91 | 2,15 | 2,22 | 2,19 | 2,14 | 3,20 | 3,50 | 3,73 | 4,01 | 4,33 | 4,86 | 5,22 | 5,64 | 5,69 | 5,23 | 5,41 | 4,49 | 4,46 | 4,28 | 28,62 |
4. Other sectors | 16,60 | 16,60 | 15,00 | 14,68 | 16,65 | 17,72 | 17,28 | 18,42 | 19,09 | 18,10 | 18,22 | 18,13 | 18,20 | 19,56 | 18,00 | 15,26 | 15,73 | 15,27 | 14,62 | 14,12 | 13,99 | 15,20 | 13,17 | 13,43 | 10,41 | 9,08 | 9,41 | 9,04 | 9,30 | 9,02 | 8,34 | 9,38 | -43,51 |
5. Other | 0,02 | 0,02 | 0,01 | 0,01 | 0,01 | 0,01 | 0,02 | 0,03 | 0,02 | 0,02 | 0,02 | 0,01 | 0,02 | 0,02 | 0,01 | 0,01 | 0,01 | 0,01 | 0,01 | 0,01 | 0,01 | 0,01 | 0,01 | 0,01 | 0,01 | 0,01 | 0,01 | 0,01 | 0,01 | 0,00 | 0,00 | 0,00 | -88,79 |
B. Fugitive emissions from fuels | 21,11 | 21,11 | 22,89 | 26,82 | 31,12 | 32,31 | 32,10 | 33,75 | 37,26 | 35,92 | 35,54 | 38,40 | 40,74 | 38,27 | 36,97 | 36,64 | 33,38 | 29,80 | 34,20 | 30,58 | 29,93 | 29,23 | 28,33 | 27,07 | 27,14 | 26,22 | 26,00 | 23,76 | 21,09 | 20,98 | 20,59 | 20,85 | -1,25 |
1. Solid fuels | 6,54 | 6,54 | 6,38 | 5,67 | 5,76 | 5,62 | 5,47 | 5,43 | 5,02 | 5,04 | 5,66 | 5,89 | 5,52 | 5,24 | 6,71 | 5,11 | 4,30 | 4,21 | 5,36 | 4,35 | 3,84 | 3,63 | 3,96 | 3,40 | 4,25 | 4,17 | 3,51 | 3,30 | 2,89 | 2,88 | 2,85 | 2,80 | -57,15 |
2. Oil and natural gas and other emissions from energy production | 14,57 | 14,57 | 16,51 | 21,15 | 25,36 | 26,70 | 26,63 | 28,32 | 32,24 | 30,88 | 29,88 | 32,51 | 35,22 | 33,03 | 30,26 | 31,53 | 29,08 | 25,59 | 28,84 | 26,23 | 26,09 | 25,60 | 24,37 | 23,67 | 22,89 | 22,06 | 22,48 | 20,46 | 18,19 | 18,10 | 17,74 | 18,05 | 23,83 |
C. CO2 transport and storage | |||||||||||||||||||||||||||||||||
2. Industrial processes | 1,09 | 1,09 | 0,92 | 0,95 | 0,96 | 1,04 | 1,10 | 1,07 | 1,30 | 1,51 | 1,37 | 1,34 | 1,46 | 1,45 | 1,15 | 1,09 | 1,09 | 1,00 | 0,87 | 1,03 | 0,88 | 1,01 | 1,03 | 0,94 | 0,90 | 0,89 | 0,92 | 0,87 | 0,89 | 0,92 | 0,85 | 0,84 | -23,30 |
A. Mineral industry | |||||||||||||||||||||||||||||||||
B. Chemical industry | 1,04 | 1,04 | 0,87 | 0,91 | 0,91 | 0,99 | 1,05 | 1,01 | 1,24 | 1,45 | 1,31 | 1,28 | 1,41 | 1,40 | 1,10 | 1,04 | 1,04 | 0,98 | 0,84 | 0,99 | 0,84 | 0,95 | 0,98 | 0,89 | 0,84 | 0,84 | 0,87 | 0,82 | 0,84 | 0,88 | 0,80 | 0,79 | -24,62 |
C. Metal industry | 0,05 | 0,05 | 0,04 | 0,04 | 0,05 | 0,05 | 0,06 | 0,06 | 0,06 | 0,06 | 0,06 | 0,06 | 0,05 | 0,05 | 0,04 | 0,05 | 0,04 | 0,03 | 0,03 | 0,04 | 0,04 | 0,06 | 0,05 | 0,05 | 0,05 | 0,06 | 0,05 | 0,05 | 0,05 | 0,05 | 0,05 | 0,05 | 4,61 |
D. Non-energy products from fuels and solvent use | NA | NA | NA | NA | NA | NA | NA | NA | NA | NA | NA | NA | NA | NA | NA | NA | NA | NA | NA | NA | NA | NA | NA | NA | NA | NA | NA | NA | NA | NA | NA | NA | 0,00 |
E. Electronic industry | |||||||||||||||||||||||||||||||||
F. Product uses as ODS substitutes | |||||||||||||||||||||||||||||||||
G. Other product manufacture and use | NO | NO | NO | NO | NO | NO | NO | NO | NO | NO | NO | NO | NO | NO | NO | NO | NO | NO | NO | NO | NO | NO | NO | NO | NO | NO | NO | NO | NO | NO | NO | NO | 0,00 |
H. Other | NA | NA | NA | NA | NA | NA | NA | NA | NA | NA | NA | NA | NA | NA | NA | NA | NA | NA | NA | NA | NA | NA | NA | NA | NA | NA | NA | NA | NA | NA | NA | NA | 0,00 |
3. Agriculture | 111,20 | 111,20 | 110,03 | 110,43 | 109,81 | 111,38 | 111,46 | 112,49 | 110,47 | 110,60 | 112,13 | 107,16 | 106,54 | 106,06 | 107,95 | 106,76 | 107,20 | 104,95 | 104,25 | 104,32 | 105,83 | 105,22 | 102,51 | 102,94 | 104,00 | 104,74 | 106,34 | 108,45 | 108,08 | 107,36 | 104,45 | 103,99 | -6,48 |
A. Enteric fermentation | 96,58 | 96,58 | 95,54 | 96,14 | 95,58 | 97,16 | 97,19 | 97,88 | 96,30 | 96,36 | 97,81 | 93,57 | 92,85 | 92,53 | 93,92 | 92,66 | 92,93 | 90,81 | 89,97 | 89,96 | 91,25 | 90,46 | 88,08 | 88,29 | 89,19 | 89,88 | 91,32 | 93,24 | 92,96 | 92,29 | 89,71 | 89,31 | -7,53 |
B. Manure management | 13,53 | 13,53 | 13,63 | 13,82 | 13,59 | 13,76 | 13,70 | 13,99 | 13,72 | 13,77 | 13,90 | 13,15 | 13,33 | 13,26 | 13,81 | 13,85 | 14,06 | 13,96 | 14,12 | 14,18 | 14,46 | 14,63 | 14,33 | 14,54 | 14,72 | 14,75 | 14,90 | 15,09 | 15,00 | 15,00 | 14,62 | 14,57 | 7,65 |
C. Rice cultivation | NO | NO | NO | NO | NO | NO | NO | NO | NO | NO | NO | NO | NO | NO | NO | NO | NO | NO | NO | NO | NO | NO | NO | NO | NO | NO | NO | NO | NO | NO | NO | NO | 0,00 |
D. Agricultural soils | NE | NE | NE | NE | NE | NE | NE | NE | NE | NE | NE | NE | NE | NE | NE | NE | NE | NE | NE | NE | NE | NE | NE | NE | NE | NE | NE | NE | NE | NE | NE | NE | 0,00 |
E. Prescribed burning of savannas | NO | NO | NO | NO | NO | NO | NO | NO | NO | NO | NO | NO | NO | NO | NO | NO | NO | NO | NO | NO | NO | NO | NO | NO | NO | NO | NO | NO | NO | NO | NO | NO | 0,00 |
F. Field burning of agricultural residues | 1,09 | 1,09 | 0,85 | 0,46 | 0,64 | 0,46 | 0,57 | 0,62 | 0,45 | 0,47 | 0,42 | 0,45 | 0,36 | 0,27 | 0,22 | 0,25 | 0,21 | 0,18 | 0,17 | 0,18 | 0,12 | 0,13 | 0,09 | 0,10 | 0,09 | 0,11 | 0,13 | 0,12 | 0,12 | 0,07 | 0,12 | 0,12 | -89,40 |
G. Liming | |||||||||||||||||||||||||||||||||
H. Urea application | |||||||||||||||||||||||||||||||||
I. Other carbon-containing fertilizers | |||||||||||||||||||||||||||||||||
J. Other | NO | NO | NO | NO | NO | NO | NO | NO | NO | NO | NO | NO | NO | NO | NO | NO | NO | NO | NO | NO | NO | NO | NO | NO | NO | NO | NO | NO | NO | NO | NO | NO | 0,00 |
4. Land use, land-use change and forestry | 6,77 | 6,77 | 6,79 | 6,78 | 6,75 | 6,75 | 6,75 | 6,80 | 6,87 | 6,92 | 6,96 | 7,00 | 7,03 | 7,04 | 7,06 | 7,07 | 7,11 | 7,21 | 7,15 | 7,32 | 7,21 | 7,25 | 7,25 | 7,26 | 7,28 | 7,34 | 7,36 | 7,40 | 7,42 | 7,48 | 7,48 | 7,47 | 10,40 |
A. Forest land | 2,03 | 2,03 | 2,05 | 2,05 | 2,02 | 2,02 | 2,02 | 2,04 | 2,04 | 2,04 | 2,03 | 2,02 | 2,01 | 2,01 | 2,02 | 2,01 | 2,01 | 2,10 | 2,01 | 2,16 | 2,04 | 2,06 | 2,02 | 2,03 | 2,03 | 2,05 | 2,03 | 2,04 | 2,04 | 2,08 | 2,07 | 2,05 | 1,22 |
B. Cropland | 3,38 | 3,38 | 3,39 | 3,40 | 3,40 | 3,41 | 3,42 | 3,44 | 3,46 | 3,49 | 3,51 | 3,54 | 3,56 | 3,58 | 3,59 | 3,61 | 3,63 | 3,62 | 3,61 | 3,60 | 3,58 | 3,56 | 3,57 | 3,58 | 3,59 | 3,60 | 3,61 | 3,62 | 3,63 | 3,64 | 3,65 | 3,65 | 8,05 |
C. Grassland | 0,44 | 0,44 | 0,43 | 0,42 | 0,41 | 0,40 | 0,40 | 0,39 | 0,39 | 0,39 | 0,39 | 0,39 | 0,39 | 0,39 | 0,39 | 0,39 | 0,39 | 0,39 | 0,40 | 0,40 | 0,41 | 0,42 | 0,43 | 0,43 | 0,43 | 0,44 | 0,45 | 0,46 | 0,47 | 0,48 | 0,48 | 0,49 | 11,53 |
D. Wetlands | 0,33 | 0,33 | 0,33 | 0,33 | 0,33 | 0,34 | 0,34 | 0,34 | 0,34 | 0,34 | 0,34 | 0,34 | 0,34 | 0,34 | 0,35 | 0,35 | 0,35 | 0,35 | 0,35 | 0,35 | 0,35 | 0,35 | 0,35 | 0,35 | 0,35 | 0,35 | 0,35 | 0,35 | 0,35 | 0,35 | 0,35 | 0,34 | 5,50 |
E. Settlements | NO | NO | NO | NO | NO | NO | NO | NO | NO | NO | NO | NO | NO | NO | NO | NO | NO | NO | NO | NO | NO | NO | NO | NO | NO | NO | NO | NO | NO | NO | NO | NO | 0,00 |
F. Other land | NO | NO | NO | NO | NO | NO | NO | NO | NO | NO | NO | NO | NO | NO | NO | NO | NO | NO | NO | NO | NO | NO | NO | NO | NO | NO | NO | NO | NO | NO | NO | NO | 0,00 |
G. Harvested wood products | |||||||||||||||||||||||||||||||||
H. Other | 0,60 | 0,60 | 0,59 | 0,59 | 0,58 | 0,57 | 0,58 | 0,60 | 0,63 | 0,67 | 0,70 | 0,72 | 0,72 | 0,72 | 0,72 | 0,73 | 0,74 | 0,76 | 0,79 | 0,81 | 0,83 | 0,86 | 0,87 | 0,88 | 0,88 | 0,90 | 0,91 | 0,93 | 0,93 | 0,94 | 0,94 | 0,94 | 56,72 |
5. Waste | 93,54 | 93,54 | 89,31 | 88,62 | 88,70 | 88,19 | 88,89 | 85,29 | 83,66 | 76,78 | 73,92 | 76,35 | 73,74 | 70,01 | 69,58 | 69,19 | 65,54 | 66,29 | 65,47 | 62,85 | 63,32 | 62,83 | 63,58 | 60,13 | 58,64 | 57,02 | 54,71 | 52,66 | 49,50 | 48,36 | 45,31 | 43,91 | -53,05 |
A. Solid waste disposal | 82,47 | 82,47 | 78,61 | 77,38 | 77,66 | 77,46 | 77,93 | 74,70 | 73,00 | 66,57 | 63,30 | 65,39 | 62,62 | 59,67 | 58,97 | 58,48 | 54,96 | 55,70 | 54,52 | 52,11 | 52,70 | 51,64 | 51,05 | 49,36 | 47,90 | 46,77 | 44,13 | 41,56 | 39,13 | 37,62 | 35,09 | 33,73 | -59,10 |
B. Biological treatment of solid waste | 0,13 | 0,13 | 0,13 | 0,21 | 0,26 | 0,33 | 0,59 | 0,64 | 0,73 | 0,82 | 1,14 | 1,43 | 1,73 | 1,69 | 1,68 | 1,97 | 1,94 | 1,97 | 2,38 | 2,35 | 2,20 | 2,26 | 2,03 | 2,41 | 2,61 | 2,15 | 2,26 | 2,43 | 2,12 | 2,43 | 2,04 | 1,95 | 1451,74 |
C. Incineration and open burning of waste | 0,01 | 0,01 | 0,02 | 0,02 | 0,02 | 0,02 | 0,02 | 0,02 | 0,02 | 0,02 | 0,03 | 0,06 | 0,07 | 0,06 | 0,05 | 0,05 | 0,05 | 0,05 | 0,05 | 0,05 | 0,02 | 0,08 | 0,11 | 0,10 | 0,09 | 0,13 | 0,12 | 0,12 | 0,13 | 0,14 | 0,11 | 0,11 | 999,69 |
D. Waste water treatment and discharge | 10,93 | 10,93 | 10,57 | 11,02 | 10,76 | 10,38 | 10,35 | 9,94 | 9,91 | 9,36 | 9,45 | 9,47 | 9,32 | 8,58 | 8,88 | 8,69 | 8,58 | 8,57 | 8,53 | 8,34 | 8,40 | 8,84 | 10,39 | 8,26 | 8,03 | 7,96 | 8,21 | 8,55 | 8,13 | 8,17 | 8,08 | 8,13 | -25,66 |
E. Other | NO | NO | NO | NO | NO | NO | NO | NO | NO | NO | NO | NO | NO | NO | NO | NO | NO | NO | NO | NO | NO | NO | NO | NO | NO | NO | NO | NO | NO | NO | NO | NO | 0,00 |
6. Other (as specified in summary 1.A) | |||||||||||||||||||||||||||||||||
Total CH4 emissions without CH4 from LULUCF | 249,44 | 249,44 | 243,93 | 247,37 | 253,15 | 256,55 | 256,78 | 257,02 | 257,95 | 248,72 | 246,69 | 247,04 | 246,61 | 241,33 | 240,19 | 235,70 | 229,63 | 223,82 | 227,19 | 221,17 | 222,83 | 223,03 | 218,17 | 214,49 | 211,24 | 208,94 | 208,76 | 205,28 | 199,65 | 196,49 | 189,40 | 188,47 | -24,44 |
Total CH4 emissions with CH4 from LULUCF | 256,20 | 256,20 | 250,72 | 254,16 | 259,89 | 263,30 | 263,54 | 263,82 | 264,81 | 255,64 | 253,65 | 254,04 | 253,64 | 248,37 | 247,25 | 242,77 | 236,75 | 231,03 | 234,34 | 228,50 | 230,04 | 230,28 | 225,41 | 221,76 | 218,52 | 216,28 | 216,12 | 212,68 | 207,07 | 203,97 | 196,88 | 195,94 | -23,52 |
Memo items: | |||||||||||||||||||||||||||||||||
International bunkers | 0,17 | 0,17 | 0,15 | 0,16 | 0,16 | 0,16 | 0,17 | 0,19 | 0,23 | 0,23 | 0,22 | 0,21 | 0,21 | 0,17 | 0,16 | 0,16 | 0,20 | 0,18 | 0,19 | 0,17 | 0,16 | 0,13 | 0,13 | 0,13 | 0,12 | 0,10 | 1,41 | 1,88 | 1,74 | 2,01 | 2,10 | 2,30 | 1220,62 |
Aviation | 0,01 | 0,01 | 0,01 | 0,01 | 0,01 | 0,01 | 0,01 | 0,01 | 0,01 | 0,01 | 0,01 | 0,01 | 0,01 | 0,01 | 0,01 | 0,01 | 0,01 | 0,01 | 0,01 | 0,01 | 0,01 | 0,01 | 0,01 | 0,01 | 0,01 | 0,01 | 0,01 | 0,01 | 0,01 | 0,01 | 0,01 | 0,00 | -35,95 |
Navigation | 0,17 | 0,17 | 0,15 | 0,16 | 0,15 | 0,15 | 0,17 | 0,19 | 0,23 | 0,22 | 0,21 | 0,20 | 0,20 | 0,17 | 0,16 | 0,15 | 0,19 | 0,17 | 0,18 | 0,16 | 0,15 | 0,12 | 0,12 | 0,12 | 0,11 | 0,08 | 1,40 | 1,87 | 1,73 | 2,00 | 2,09 | 2,29 | 1277,36 |
Multilateral operations | NO | NO | NO | NO | NO | NO | NO | NO | NO | NO | NO | NO | NO | NO | NO | NO | NO | NO | NO | NO | NO | NO | NO | NO | NO | NO | NO | NO | NO | NO | NO | NO | 0,00 |
CO2 emissions from biomass | |||||||||||||||||||||||||||||||||
CO2 captured | |||||||||||||||||||||||||||||||||
Long-term storage of C in waste disposal sites | |||||||||||||||||||||||||||||||||
Indirect N2O | |||||||||||||||||||||||||||||||||
Indirect CO2 (3) | |||||||||||||||||||||||||||||||||
Table AI-4 CRF TABLE 10S4: NORWAY’S EMISSIONS OF NITROUS OXIDE (N2O) DURING THE PERIOD 1990–2020.
GREENHOUSE GAS SOURCE AND SINK CATEGORIES | Base year(1) | 1990 | 1991 | 1992 | 1993 | 1994 | 1995 | 1996 | 1997 | 1998 | 1999 | 2000 | 2001 | 2002 | 2003 | 2004 | 2005 | 2006 | 2007 | 2008 | 2009 | 2010 | 2011 | 2012 | 2013 | 2014 | 2015 | 2016 | 2017 | 2018 | 2019 | 2020 | Change from base to latest reported year |
|---|---|---|---|---|---|---|---|---|---|---|---|---|---|---|---|---|---|---|---|---|---|---|---|---|---|---|---|---|---|---|---|---|---|
(kt) | % | ||||||||||||||||||||||||||||||||
1. Energy | 0,56 | 0,56 | 0,55 | 0,57 | 0,60 | 0,63 | 0,65 | 0,69 | 0,72 | 0,71 | 0,72 | 0,67 | 0,68 | 0,69 | 0,69 | 0,67 | 0,59 | 0,60 | 0,63 | 0,63 | 0,62 | 0,65 | 0,66 | 0,69 | 0,70 | 0,68 | 0,70 | 0,71 | 0,74 | 0,76 | 0,76 | 0,72 | 29,82 |
A. Fuel combustion (sectoral approach) | 0,54 | 0,54 | 0,54 | 0,56 | 0,59 | 0,62 | 0,64 | 0,68 | 0,70 | 0,70 | 0,70 | 0,65 | 0,67 | 0,68 | 0,68 | 0,66 | 0,58 | 0,59 | 0,61 | 0,61 | 0,61 | 0,64 | 0,65 | 0,68 | 0,68 | 0,67 | 0,69 | 0,70 | 0,73 | 0,76 | 0,76 | 0,72 | 32,68 |
1. Energy industries | 0,05 | 0,05 | 0,05 | 0,06 | 0,05 | 0,05 | 0,06 | 0,06 | 0,06 | 0,06 | 0,06 | 0,05 | 0,05 | 0,05 | 0,06 | 0,05 | 0,05 | 0,05 | 0,05 | 0,06 | 0,06 | 0,06 | 0,06 | 0,07 | 0,08 | 0,08 | 0,09 | 0,09 | 0,09 | 0,09 | 0,10 | 0,09 | 106,80 |
2. Manufacturing industries and construction | 0,10 | 0,10 | 0,09 | 0,10 | 0,10 | 0,11 | 0,11 | 0,12 | 0,13 | 0,12 | 0,12 | 0,11 | 0,12 | 0,11 | 0,12 | 0,12 | 0,12 | 0,13 | 0,13 | 0,13 | 0,12 | 0,13 | 0,13 | 0,12 | 0,13 | 0,12 | 0,12 | 0,11 | 0,12 | 0,12 | 0,12 | 0,12 | 20,80 |
3. Transport | 0,28 | 0,28 | 0,29 | 0,30 | 0,32 | 0,34 | 0,35 | 0,36 | 0,38 | 0,39 | 0,39 | 0,38 | 0,39 | 0,38 | 0,39 | 0,38 | 0,30 | 0,30 | 0,31 | 0,31 | 0,31 | 0,32 | 0,34 | 0,36 | 0,36 | 0,37 | 0,38 | 0,39 | 0,41 | 0,42 | 0,42 | 0,39 | 35,40 |
4. Other sectors | 0,10 | 0,10 | 0,10 | 0,10 | 0,11 | 0,11 | 0,11 | 0,12 | 0,12 | 0,12 | 0,11 | 0,10 | 0,11 | 0,12 | 0,11 | 0,11 | 0,11 | 0,11 | 0,11 | 0,11 | 0,11 | 0,12 | 0,11 | 0,11 | 0,10 | 0,10 | 0,10 | 0,11 | 0,11 | 0,12 | 0,12 | 0,12 | 12,94 |
5. Other | 0,01 | 0,01 | 0,01 | 0,01 | 0,01 | 0,01 | 0,01 | 0,01 | 0,01 | 0,01 | 0,01 | 0,00 | 0,01 | 0,01 | 0,00 | 0,01 | 0,01 | 0,01 | 0,00 | 0,00 | 0,00 | 0,01 | 0,01 | 0,01 | 0,01 | 0,01 | 0,01 | 0,01 | 0,01 | 0,00 | 0,00 | 0,00 | -66,77 |
B. Fugitive emissions from fuels | 0,02 | 0,02 | 0,01 | 0,01 | 0,01 | 0,01 | 0,01 | 0,02 | 0,01 | 0,01 | 0,02 | 0,02 | 0,01 | 0,01 | 0,01 | 0,01 | 0,01 | 0,01 | 0,02 | 0,02 | 0,01 | 0,01 | 0,01 | 0,01 | 0,01 | 0,01 | 0,01 | 0,01 | 0,01 | 0,01 | 0,01 | 0,01 | -63,97 |
1. Solid fuels | NA,NO | NA,NO | NA,NO | NA,NO | NA,NO | NA,NO | NA,NO | NA,NO | NA,NO | NA,NO | NA,NO | NA,NO | NA,NO | NA,NO | NA,NO | NA,NO | NA,NO | NA,NO | NA,NO | NA,NO | NA,NO | NA,NO | NA,NO | NA,NO | NA,NO | NA,NO | NO,NA | NO,NA | NO,NA | NO,NA | NO,NA | NO,NA | 0,00 |
2. Oil and natural gas and other emissions from energy production | 0,02 | 0,02 | 0,01 | 0,01 | 0,01 | 0,01 | 0,01 | 0,02 | 0,01 | 0,01 | 0,02 | 0,02 | 0,01 | 0,01 | 0,01 | 0,01 | 0,01 | 0,01 | 0,02 | 0,02 | 0,01 | 0,01 | 0,01 | 0,01 | 0,01 | 0,01 | 0,01 | 0,01 | 0,01 | 0,01 | 0,01 | 0,01 | -63,97 |
C. CO2 transport and storage | |||||||||||||||||||||||||||||||||
2. Industrial processes | 7,02 | 7,02 | 6,51 | 4,73 | 5,43 | 5,66 | 5,66 | 5,61 | 5,56 | 5,83 | 6,58 | 5,97 | 5,81 | 6,64 | 6,00 | 6,46 | 6,79 | 5,75 | 5,04 | 3,61 | 1,95 | 1,78 | 1,62 | 1,58 | 1,41 | 1,33 | 1,36 | 1,13 | 1,02 | 0,96 | 0,94 | 0,77 | -89,03 |
A. Mineral industry | |||||||||||||||||||||||||||||||||
B. Chemical industry | 6,88 | 6,88 | 6,39 | 4,60 | 5,29 | 5,52 | 5,52 | 5,46 | 5,41 | 5,68 | 6,43 | 5,83 | 5,68 | 6,52 | 5,89 | 6,35 | 6,69 | 5,64 | 4,95 | 3,49 | 1,83 | 1,67 | 1,52 | 1,48 | 1,31 | 1,24 | 1,27 | 1,04 | 0,94 | 0,88 | 0,87 | 0,71 | -89,74 |
C. Metal industry | 0,02 | 0,02 | 0,01 | 0,01 | 0,02 | 0,02 | 0,02 | 0,02 | 0,02 | 0,02 | 0,02 | 0,02 | 0,02 | 0,02 | 0,01 | 0,02 | 0,01 | 0,01 | 0,01 | 0,01 | 0,01 | 0,02 | 0,02 | 0,01 | 0,01 | 0,02 | 0,01 | 0,02 | 0,01 | 0,01 | 0,01 | 0,02 | -8,24 |
D. Non-energy products from fuels and solvent use | NA | NA | NA | NA | NA | NA | NA | NA | NA | NA | NA | NA | NA | NA | NA | NA | NA | NA | NA | NA | NA | NA | NA | NA | NA | NA | NA | NA | NA | NA | NA | NA | 0,00 |
E. Electronic industry | |||||||||||||||||||||||||||||||||
F. Product uses as ODS substitutes | |||||||||||||||||||||||||||||||||
G. Other product manufacture and use | 0,11 | 0,11 | 0,11 | 0,11 | 0,12 | 0,12 | 0,13 | 0,13 | 0,13 | 0,13 | 0,13 | 0,12 | 0,11 | 0,10 | 0,10 | 0,10 | 0,09 | 0,09 | 0,08 | 0,10 | 0,11 | 0,09 | 0,09 | 0,09 | 0,09 | 0,08 | 0,08 | 0,07 | 0,07 | 0,06 | 0,05 | 0,05 | -58,25 |
H. Other | NA | NA | NA | NA | NA | NA | NA | NA | NA | NA | NA | NA | NA | NA | NA | NA | NA | NA | NA | NA | NA | NA | NA | NA | NA | NA | NA | NA | NA | NA | NA | NA | 0,00 |
3. Agriculture | 6,04 | 6,04 | 6,02 | 5,99 | 5,93 | 5,87 | 5,94 | 6,01 | 5,99 | 6,02 | 5,96 | 5,94 | 5,82 | 5,81 | 5,95 | 5,98 | 5,97 | 5,89 | 5,94 | 5,89 | 5,73 | 5,54 | 5,68 | 5,70 | 5,77 | 5,93 | 6,00 | 6,00 | 5,93 | 5,89 | 6,01 | 5,98 | -1,02 |
A. Enteric fermentation | |||||||||||||||||||||||||||||||||
B. Manure management | 0,50 | 0,50 | 0,50 | 0,51 | 0,47 | 0,48 | 0,48 | 0,49 | 0,48 | 0,48 | 0,50 | 0,48 | 0,49 | 0,49 | 0,52 | 0,51 | 0,51 | 0,51 | 0,51 | 0,52 | 0,52 | 0,52 | 0,51 | 0,52 | 0,52 | 0,52 | 0,53 | 0,53 | 0,53 | 0,53 | 0,52 | 0,51 | 3,15 |
C. Rice cultivation | |||||||||||||||||||||||||||||||||
D. Agricultural soils | 5,52 | 5,52 | 5,50 | 5,48 | 5,44 | 5,39 | 5,44 | 5,51 | 5,50 | 5,52 | 5,45 | 5,44 | 5,31 | 5,31 | 5,43 | 5,46 | 5,45 | 5,37 | 5,42 | 5,37 | 5,20 | 5,02 | 5,16 | 5,18 | 5,25 | 5,40 | 5,47 | 5,46 | 5,40 | 5,36 | 5,50 | 5,47 | -0,94 |
E. Prescribed burning of savannas | NO | NO | NO | NO | NO | NO | NO | NO | NO | NO | NO | NO | NO | NO | NO | NO | NO | NO | NO | NO | NO | NO | NO | NO | NO | NO | NO | NO | NO | NO | NO | NO | 0,00 |
F. Field burning of agricultural residues | 0,03 | 0,03 | 0,02 | 0,01 | 0,02 | 0,01 | 0,01 | 0,02 | 0,01 | 0,01 | 0,01 | 0,01 | 0,01 | 0,01 | 0,01 | 0,01 | 0,01 | 0,00 | 0,00 | 0,00 | 0,00 | 0,00 | 0,00 | 0,00 | 0,00 | 0,00 | 0,00 | 0,00 | 0,00 | 0,00 | 0,00 | 0,00 | -89,40 |
G. Liming | |||||||||||||||||||||||||||||||||
H. Urea application | |||||||||||||||||||||||||||||||||
I. Other carbon containing fertlizers | |||||||||||||||||||||||||||||||||
J. Other | NO | NO | NO | NO | NO | NO | NO | NO | NO | NO | NO | NO | NO | NO | NO | NO | NO | NO | NO | NO | NO | NO | NO | NO | NO | NO | NO | NO | NO | NO | NO | NO | 0,00 |
4. Land use, land-use change and forestry | 0,80 | 0,80 | 0,80 | 0,81 | 0,81 | 0,81 | 0,81 | 0,81 | 0,82 | 0,83 | 0,83 | 0,83 | 0,83 | 0,84 | 0,84 | 0,84 | 0,84 | 0,85 | 0,84 | 0,85 | 0,85 | 0,87 | 0,87 | 0,87 | 0,87 | 0,86 | 0,86 | 0,88 | 0,88 | 0,87 | 0,87 | 0,87 | 9,42 |
A. Forest land | 0,58 | 0,58 | 0,58 | 0,58 | 0,58 | 0,58 | 0,58 | 0,58 | 0,58 | 0,59 | 0,58 | 0,58 | 0,58 | 0,58 | 0,58 | 0,58 | 0,57 | 0,58 | 0,58 | 0,58 | 0,58 | 0,58 | 0,58 | 0,58 | 0,58 | 0,58 | 0,58 | 0,59 | 0,60 | 0,59 | 0,59 | 0,59 | 2,61 |
B. Cropland | 0,01 | 0,01 | 0,01 | 0,01 | 0,01 | 0,01 | 0,01 | 0,01 | 0,01 | 0,01 | 0,01 | 0,01 | 0,01 | 0,01 | 0,01 | 0,01 | 0,01 | 0,01 | 0,01 | 0,01 | 0,01 | 0,01 | 0,01 | 0,01 | 0,01 | 0,01 | 0,01 | 0,01 | 0,01 | 0,01 | 0,02 | 0,02 | 45,44 |
C. Grassland | NE,NO | NE,NO | NE,NO | NE,NO | NE,NO | NE,NO | NE,NO | NE,NO | 0,00 | NE,NO | 0,00 | 0,00 | 0,00 | 0,00 | 0,00 | 0,00 | 0,01 | 0,01 | 0,01 | 0,01 | 0,01 | 0,02 | 0,02 | 0,02 | 0,01 | 0,01 | 0,01 | 0,01 | 0,01 | 0,01 | 0,01 | 0,01 | 100,00 |
D. Wetlands | 0,10 | 0,10 | 0,11 | 0,11 | 0,11 | 0,11 | 0,11 | 0,11 | 0,11 | 0,11 | 0,11 | 0,11 | 0,11 | 0,11 | 0,11 | 0,11 | 0,11 | 0,11 | 0,11 | 0,11 | 0,11 | 0,11 | 0,11 | 0,11 | 0,11 | 0,11 | 0,11 | 0,11 | 0,11 | 0,11 | 0,11 | 0,11 | 6,83 |
E. Settlements | 0,04 | 0,04 | 0,04 | 0,04 | 0,04 | 0,04 | 0,04 | 0,04 | 0,04 | 0,04 | 0,05 | 0,05 | 0,05 | 0,05 | 0,05 | 0,05 | 0,05 | 0,05 | 0,04 | 0,05 | 0,05 | 0,05 | 0,05 | 0,05 | 0,05 | 0,04 | 0,04 | 0,05 | 0,05 | 0,05 | 0,05 | 0,05 | 40,35 |
F. Other land | NO | NO | NO | NO | NO | NO | NO | NO | NO | NO | NO | NO | NO | NO | NO | NO | NO | NO | NO | NO | NO | NO | NO | NO | NO | NO | NO | NO | NO | NO | NO | NO | 0,00 |
G. Harvested wood products | |||||||||||||||||||||||||||||||||
H. Other | 0,05 | 0,05 | 0,05 | 0,05 | 0,05 | 0,05 | 0,05 | 0,05 | 0,06 | 0,06 | 0,07 | 0,07 | 0,07 | 0,07 | 0,07 | 0,07 | 0,07 | 0,07 | 0,07 | 0,07 | 0,07 | 0,07 | 0,07 | 0,07 | 0,07 | 0,07 | 0,07 | 0,07 | 0,07 | 0,07 | 0,07 | 0,07 | 25,15 |
5. Waste | 0,16 | 0,16 | 0,16 | 0,16 | 0,17 | 0,20 | 0,20 | 0,21 | 0,21 | 0,22 | 0,24 | 0,23 | 0,27 | 0,26 | 0,26 | 0,28 | 0,28 | 0,28 | 0,31 | 0,31 | 0,30 | 0,31 | 0,30 | 0,33 | 0,34 | 0,32 | 0,33 | 0,34 | 0,33 | 0,33 | 0,30 | 0,31 | 88,71 |
A. Solid waste disposal | |||||||||||||||||||||||||||||||||
B. Biological treatment of solid waste | 0,01 | 0,01 | 0,01 | 0,01 | 0,01 | 0,01 | 0,02 | 0,02 | 0,02 | 0,03 | 0,05 | 0,06 | 0,07 | 0,07 | 0,07 | 0,09 | 0,08 | 0,08 | 0,10 | 0,10 | 0,09 | 0,09 | 0,07 | 0,10 | 0,11 | 0,08 | 0,08 | 0,09 | 0,07 | 0,08 | 0,05 | 0,05 | 680,35 |
C. Incineration and open burning of waste | 0,00 | 0,00 | 0,00 | 0,00 | 0,00 | 0,00 | 0,00 | 0,00 | 0,00 | 0,00 | 0,00 | 0,01 | 0,01 | 0,01 | 0,01 | 0,01 | 0,01 | 0,01 | 0,01 | 0,01 | 0,00 | 0,01 | 0,01 | 0,01 | 0,01 | 0,02 | 0,01 | 0,02 | 0,02 | 0,02 | 0,01 | 0,01 | 910,26 |
D. Waste water treatment and discharge | 0,16 | 0,16 | 0,16 | 0,15 | 0,16 | 0,18 | 0,19 | 0,18 | 0,19 | 0,19 | 0,19 | 0,17 | 0,19 | 0,18 | 0,18 | 0,19 | 0,19 | 0,19 | 0,20 | 0,20 | 0,21 | 0,21 | 0,21 | 0,22 | 0,22 | 0,22 | 0,24 | 0,23 | 0,24 | 0,24 | 0,24 | 0,24 | 54,59 |
E. Other | NO | NO | NO | NO | NO | NO | NO | NO | NO | NO | NO | NO | NO | NO | NO | NO | NO | NO | NO | NO | NO | NO | NO | NO | NO | NO | NO | NO | NO | NO | NO | NO | 0,00 |
6. Other (as specified in summary 1.A) | |||||||||||||||||||||||||||||||||
Total direct N2O emissions without N2O from LULUCF | 13,78 | 13,78 | 13,25 | 11,46 | 12,13 | 12,36 | 12,46 | 12,51 | 12,48 | 12,78 | 13,50 | 12,81 | 12,58 | 13,40 | 12,91 | 13,39 | 13,63 | 12,52 | 11,92 | 10,44 | 8,60 | 8,29 | 8,27 | 8,30 | 8,22 | 8,26 | 8,39 | 8,18 | 8,02 | 7,95 | 8,02 | 7,78 | -43,52 |
Total direct N2O emissions with N2O from LULUCF | 14,57 | 14,57 | 14,06 | 12,27 | 12,93 | 13,17 | 13,26 | 13,32 | 13,30 | 13,61 | 14,33 | 13,65 | 13,41 | 14,24 | 13,75 | 14,23 | 14,47 | 13,36 | 12,76 | 11,29 | 9,45 | 9,16 | 9,13 | 9,17 | 9,09 | 9,12 | 9,26 | 9,06 | 8,90 | 8,82 | 8,89 | 8,65 | -40,63 |
Memo items: | |||||||||||||||||||||||||||||||||
International bunkers | 0,29 | 0,29 | 0,25 | 0,27 | 0,27 | 0,26 | 0,28 | 0,32 | 0,39 | 0,39 | 0,37 | 0,36 | 0,35 | 0,29 | 0,28 | 0,28 | 0,33 | 0,32 | 0,32 | 0,29 | 0,28 | 0,24 | 0,24 | 0,24 | 0,23 | 0,20 | 0,19 | 0,16 | 0,17 | 0,18 | 0,17 | 0,10 | -65,92 |
Aviation | 0,03 | 0,03 | 0,03 | 0,03 | 0,03 | 0,03 | 0,03 | 0,04 | 0,04 | 0,04 | 0,05 | 0,05 | 0,04 | 0,04 | 0,04 | 0,04 | 0,05 | 0,06 | 0,06 | 0,06 | 0,06 | 0,07 | 0,07 | 0,08 | 0,09 | 0,09 | 0,09 | 0,09 | 0,09 | 0,10 | 0,09 | 0,03 | -13,22 |
Navigation | 0,25 | 0,25 | 0,22 | 0,24 | 0,24 | 0,23 | 0,25 | 0,29 | 0,35 | 0,35 | 0,32 | 0,32 | 0,31 | 0,25 | 0,24 | 0,23 | 0,28 | 0,26 | 0,26 | 0,23 | 0,22 | 0,17 | 0,17 | 0,16 | 0,14 | 0,11 | 0,10 | 0,08 | 0,08 | 0,09 | 0,08 | 0,07 | -72,93 |
Multilateral operations | NO | NO | NO | NO | NO | NO | NO | NO | NO | NO | NO | NO | NO | NO | NO | NO | NO | NO | NO | NO | NO | NO | NO | NO | NO | NO | NO | NO | NO | NO | NO | NO | 0,00 |
CO2 emissions from biomass | |||||||||||||||||||||||||||||||||
CO2 captured | |||||||||||||||||||||||||||||||||
Long-term storage of C in waste disposal sites | |||||||||||||||||||||||||||||||||
Indirect N2O | 0,94 | 0,94 | 0,91 | 0,93 | 0,95 | 0,98 | 1,04 | 1,08 | 1,13 | 1,14 | 1,11 | 1,05 | 1,04 | 1,01 | 1,02 | 1,01 | 1,01 | 1,02 | 1,03 | 1,00 | 0,95 | 0,97 | 0,96 | 0,94 | 0,92 | 0,91 | 0,87 | 0,82 | 0,80 | 0,79 | 0,75 | 0,70 | -25,55 |
Indirect CO2 (3) | |||||||||||||||||||||||||||||||||
Table AI-5 CRF TABLE 10S5: NORWAY’S EMISSIONS OF INDUSTRIAL GREENHOUSE GASES (HCFS, PFCS AND SF6) DURING THE PERIOD 1990–2020.
GREENHOUSE GAS SOURCE AND SINK CATEGORIES | Base year(1) | 1990 | 1991 | 1992 | 1993 | 1994 | 1995 | 1996 | 1997 | 1998 | 1999 | 2000 | 2001 | 2002 | 2003 | 2004 | 2005 | 2006 | 2007 | 2008 | 2009 | 2010 | 2011 | 2012 | 2013 | 2014 | 2015 | 2016 | 2017 | 2018 | 2019 | 2020 | Change from base to latest reported year |
|---|---|---|---|---|---|---|---|---|---|---|---|---|---|---|---|---|---|---|---|---|---|---|---|---|---|---|---|---|---|---|---|---|---|
(kt) | % | ||||||||||||||||||||||||||||||||
Emissions of HFCs and PFCs - (kt CO2 equivalent) | 3894,84 | 3894,84 | 3458,01 | 2640,05 | 2684,07 | 2396,61 | 2411,89 | 2237,16 | 2078,04 | 1970,35 | 1922,85 | 1887,73 | 1997,97 | 2162,74 | 1566,94 | 1560,85 | 1504,06 | 1479,35 | 1635,15 | 1635,39 | 1257,40 | 1132,57 | 1228,40 | 1228,79 | 1299,14 | 1260,01 | 1109,74 | 1191,65 | 1160,13 | 1144,62 | 1109,03 | 971,40 | -75,06 |
Emissions of HFCs - (kt CO2 equivalent) | 0,04 | 0,04 | 1,31 | 2,82 | 35,80 | 54,08 | 97,84 | 129,54 | 195,34 | 258,37 | 322,89 | 369,28 | 466,71 | 503,95 | 515,84 | 544,11 | 548,74 | 620,27 | 683,96 | 739,40 | 819,05 | 894,22 | 965,80 | 1028,32 | 1118,11 | 1081,09 | 963,35 | 1005,48 | 1029,18 | 996,54 | 933,97 | 809,97 | 1845045,27 |
HFC-23 | NO,NA | NO,NA | NO,NA | NO,NA | NO,NA | 0,00 | 0,00 | 0,00 | 0,00 | 0,00 | 0,00 | 0,00 | 0,00 | 0,00 | 0,00 | 0,00 | 0,00 | 0,00 | 0,00 | 0,00 | 0,00 | 0,00 | 0,00 | 0,00 | 0,00 | 0,00 | 0,00 | 0,00 | 0,00 | 0,00 | 0,00 | 0,00 | 100,00 |
HFC-32 | NO,NA | NO,NA | NO,NA | NO,NA | NO,NA | NO,NA | NO,NA | 0,00 | 0,00 | 0,00 | 0,00 | 0,00 | 0,00 | 0,00 | 0,00 | 0,00 | 0,00 | 0,01 | 0,01 | 0,01 | 0,01 | 0,02 | 0,02 | 0,02 | 0,03 | 0,03 | 0,03 | 0,03 | 0,03 | 0,04 | 0,04 | 0,05 | 100,00 |
HFC-41 | NA,NO | NA,NO | NA,NO | NA,NO | NA,NO | NA,NO | NA,NO | NA,NO | NA,NO | NA,NO | NA,NO | NA,NO | NA,NO | NA,NO | NA,NO | NA,NO | NA,NO | NA,NO | NA,NO | NA,NO | NA,NO | NA,NO | NA,NO | NA,NO | NA,NO | NA,NO | NO,NA | NO,NA | NO,NA | NO,NA | NO,NA | NO,NA | 0,00 |
HFC-43-10mee | NA,NO | NA,NO | NA,NO | NA,NO | NA,NO | NA,NO | NA,NO | NA,NO | NA,NO | NA,NO | NA,NO | NA,NO | NA,NO | NA,NO | NA,NO | NA,NO | NA,NO | NA,NO | NA,NO | NA,NO | NA,NO | NA,NO | NA,NO | NA,NO | NA,NO | NA,NO | NO,NA | NO,NA | NO,NA | NO,NA | NO,NA | NO,NA | 0,00 |
HFC-125 | NO,IE,NA | NO,IE,NA | NO,IE,NA | NO,IE,NA | NO,IE,NA | 0,00 | 0,01 | 0,01 | 0,02 | 0,02 | 0,03 | 0,03 | 0,04 | 0,05 | 0,05 | 0,05 | 0,05 | 0,06 | 0,06 | 0,06 | 0,07 | 0,08 | 0,08 | 0,09 | 0,09 | 0,09 | 0,08 | 0,08 | 0,08 | 0,09 | 0,09 | 0,07 | 100,00 |
HFC-134 | NA,NO | NA,NO | NA,NO | NA,NO | NA,NO | NA,NO | NA,NO | NA,NO | NA,NO | NA,NO | NA,NO | NA,NO | NA,NO | NA,NO | NA,NO | 0,00 | 0,00 | 0,00 | 0,00 | 0,00 | 0,00 | 0,00 | 0,00 | 0,00 | 0,00 | 0,00 | 0,00 | 0,01 | 0,00 | 0,00 | 0,00 | 0,01 | 100,00 |
HFC-134a | NO,IE,NA | NO,IE,NA | 0,00 | 0,00 | 0,02 | 0,03 | 0,04 | 0,04 | 0,05 | 0,07 | 0,08 | 0,07 | 0,08 | 0,08 | 0,08 | 0,10 | 0,12 | 0,14 | 0,16 | 0,18 | 0,20 | 0,23 | 0,25 | 0,27 | 0,28 | 0,29 | 0,29 | 0,31 | 0,31 | 0,30 | 0,30 | 0,29 | 100,00 |
HFC-143 | NA,NO | NA,NO | NA,NO | NA,NO | NA,NO | NA,NO | NA,NO | NA,NO | NA,NO | NA,NO | NA,NO | NA,NO | NA,NO | NA,NO | NA,NO | NA,NO | 0,00 | 0,00 | 0,00 | 0,00 | 0,00 | 0,00 | 0,00 | 0,00 | 0,00 | 0,00 | 0,00 | 0,00 | 0,01 | 0,00 | NO,NA | NO,NA | 0,00 |
HFC-143a | NO,NA | NO,NA | NO,NA | NO,NA | NO,NA | 0,00 | 0,00 | 0,01 | 0,01 | 0,02 | 0,02 | 0,03 | 0,04 | 0,04 | 0,04 | 0,04 | 0,04 | 0,04 | 0,05 | 0,05 | 0,05 | 0,06 | 0,06 | 0,06 | 0,07 | 0,06 | 0,04 | 0,04 | 0,04 | 0,04 | 0,03 | 0,01 | 100,00 |
HFC-152 | NA,NO | NA,NO | NA,NO | NA,NO | NA,NO | NA,NO | NA,NO | NA,NO | NA,NO | NA,NO | NA,NO | NA,NO | NA,NO | NA,NO | NA,NO | NA,NO | NA,NO | NA,NO | NA,NO | NA,NO | NA,NO | NA,NO | NA,NO | NA,NO | NA,NO | NA,NO | NO,NA | NO,NA | NO,NA | NO,NA | NO,NA | NO,NA | 0,00 |
HFC-152a | 0,00 | 0,00 | 0,00 | 0,00 | 0,00 | 0,00 | 0,00 | 0,00 | 0,00 | 0,00 | 0,00 | 0,00 | 0,00 | 0,00 | 0,00 | 0,00 | 0,00 | 0,00 | 0,00 | 0,00 | 0,00 | 0,00 | 0,00 | 0,00 | 0,01 | 0,00 | 0,00 | 0,00 | 0,00 | 0,00 | 0,00 | 0,00 | 108,46 |
HFC-161 | NA,NO | NA,NO | NA,NO | NA,NO | NA,NO | NA,NO | NA,NO | NA,NO | NA,NO | NA,NO | NA,NO | NA,NO | NA,NO | NA,NO | NA,NO | NA,NO | NA,NO | NA,NO | NA,NO | NA,NO | NA,NO | NA,NO | NA,NO | NA,NO | NA,NO | NA,NO | NO,NA | NO,NA | NO,NA | NO,NA | NO,NA | NO,NA | 0,00 |
HFC-227ea | NO,IE,NA | NO,IE,NA | NO,IE,NA | NO,IE,NA | NO,IE,NA | NO,IE,NA | NO,IE,NA | NO,IE,NA | NO,IE,NA | NO,IE,NA | NO,IE,NA | NO,IE,NA | NO,IE,NA | NO,IE,NA | NO,IE,NA | NO,IE,NA | NO,IE,NA | NO,IE,NA | NO,IE,NA | NO,IE,NA | NO,IE,NA | NO,IE,NA | NO,IE,NA | 0,00 | 0,00 | 0,00 | 0,00 | 0,00 | 0,00 | 0,00 | 0,00 | 0,00 | 100,00 |
HFC-236cb | NA,NO | NA,NO | NA,NO | NA,NO | NA,NO | NA,NO | NA,NO | NA,NO | NA,NO | NA,NO | NA,NO | NA,NO | NA,NO | NA,NO | NA,NO | NA,NO | NA,NO | NA,NO | NA,NO | NA,NO | NA,NO | NA,NO | NA,NO | NA,NO | NA,NO | NA,NO | NO,NA | NO,NA | NO,NA | NO,NA | NO,NA | NO,NA | 0,00 |
HFC-236ea | NA,NO | NA,NO | NA,NO | NA,NO | NA,NO | NA,NO | NA,NO | NA,NO | NA,NO | NA,NO | NA,NO | NA,NO | NA,NO | NA,NO | NA,NO | NA,NO | NA,NO | NA,NO | NA,NO | NA,NO | NA,NO | NA,NO | NA,NO | NA,NO | NA,NO | NA,NO | NO,NA | NO,NA | NO,NA | NO,NA | NO,NA | NO,NA | 0,00 |
HFC-236fa | NA,NO | NA,NO | NA,NO | NA,NO | NA,NO | NA,NO | NA,NO | NA,NO | NA,NO | NA,NO | NA,NO | NA,NO | NA,NO | NA,NO | NA,NO | NA,NO | NA,NO | NA,NO | NA,NO | NA,NO | NA,NO | NA,NO | NA,NO | NA,NO | NA,NO | NA,NO | NO,NA | NO,NA | NO,NA | NO,NA | NO,NA | NO,NA | 0,00 |
HFC-245ca | NA,NO | NA,NO | NA,NO | NA,NO | NA,NO | NA,NO | NA,NO | NA,NO | NA,NO | NA,NO | NA,NO | NA,NO | NA,NO | NA,NO | NA,NO | NA,NO | NA,NO | NA,NO | NA,NO | NA,NO | NA,NO | NA,NO | NA,NO | NA,NO | NA,NO | NA,NO | NO,NA | NO,NA | NO,NA | NO,NA | NO,NA | NO,NA | 0,00 |
HFC-245fa | NA,NO | NA,NO | NA,NO | NA,NO | NA,NO | NA,NO | NA,NO | NA,NO | NA,NO | NA,NO | NA,NO | NA,NO | NA,NO | NA,NO | NA,NO | NA,NO | NA,NO | NA,NO | NA,NO | NA,NO | NA,NO | NA,NO | NA,NO | NA,NO | NA,NO | NA,NO | NO,NA | NO,NA | NO,NA | NO,NA | NO,NA | NO,NA | 0,00 |
HFC-365mfc | NA,NO | NA,NO | NA,NO | NA,NO | NA,NO | NA,NO | NA,NO | NA,NO | NA,NO | NA,NO | NA,NO | NA,NO | NA,NO | NA,NO | NA,NO | NA,NO | NA,NO | NA,NO | NA,NO | NA,NO | NA,NO | NA,NO | NA,NO | NA,NO | NA,NO | NA,NO | NO,NA | NO,NA | NO,NA | NO,NA | NO,NA | NO,NA | 0,00 |
Unspecified mix of HFCs(4) - (kt CO2 equivalent) | 0,00 | 0,00 | 0,00 | 0,00 | 0,29 | 0,52 | 2,58 | 3,99 | 9,04 | 13,82 | 19,17 | 21,54 | 24,05 | 28,45 | 27,86 | 30,18 | 33,53 | 32,19 | 32,82 | 31,77 | 31,94 | 33,58 | 52,90 | 65,57 | 63,92 | 61,26 | 48,67 | 52,43 | 73,07 | 38,47 | 34,50 | 40,70 | 2727947572,36 |
Emissions of PFCs - (kt CO2 equivalent) | 3894,80 | 3894,80 | 3456,70 | 2637,22 | 2648,27 | 2342,53 | 2314,05 | 2107,62 | 1882,70 | 1711,98 | 1599,97 | 1518,45 | 1531,26 | 1658,79 | 1051,11 | 1016,75 | 955,32 | 859,08 | 951,19 | 895,99 | 438,35 | 238,35 | 262,60 | 200,47 | 181,03 | 178,92 | 146,39 | 186,17 | 130,96 | 148,08 | 175,07 | 161,42 | -95,86 |
CF4 | 0,47 | 0,47 | 0,42 | 0,32 | 0,32 | 0,29 | 0,28 | 0,26 | 0,23 | 0,21 | 0,20 | 0,19 | 0,19 | 0,20 | 0,13 | 0,12 | 0,12 | 0,10 | 0,11 | 0,10 | 0,05 | 0,03 | 0,03 | 0,02 | 0,02 | 0,02 | 0,02 | 0,02 | 0,01 | 0,02 | 0,02 | 0,02 | -96,08 |
C2F6 | 0,04 | 0,04 | 0,03 | 0,02 | 0,02 | 0,02 | 0,02 | 0,02 | 0,02 | 0,01 | 0,01 | 0,01 | 0,01 | 0,01 | 0,01 | 0,01 | 0,01 | 0,01 | 0,01 | 0,01 | 0,01 | 0,00 | 0,00 | 0,00 | 0,00 | 0,00 | 0,00 | 0,00 | 0,00 | 0,00 | 0,00 | 0,00 | -94,09 |
C3F8 | NA,NO | NA,NO | NA,NO | NA,NO | NA,NO | NA,NO | NA,NO | NA,NO | NA,NO | NA,NO | NA,NO | NA,NO | NA,NO | NA,NO | NA,NO | NA,NO | NA,NO | NA,NO | NA,NO | NA,NO | NA,NO | 0,00 | 0,00 | 0,00 | 0,00 | 0,00 | NO,NA | NO,NA | NO,NA | NO,NA | NO,NA | NO,NA | 0,00 |
C4F10 | NA,NO | NA,NO | NA,NO | NA,NO | NA,NO | NA,NO | NA,NO | NA,NO | NA,NO | NA,NO | NA,NO | NA,NO | NA,NO | NA,NO | NA,NO | NA,NO | NA,NO | NA,NO | NA,NO | NA,NO | NA,NO | NA,NO | NA,NO | NA,NO | NA,NO | NA,NO | NO,NA | NO,NA | NO,NA | NO,NA | NO,NA | NO,NA | 0,00 |
c-C4F8 | NA,NO | NA,NO | NA,NO | NA,NO | NA,NO | NA,NO | NA,NO | NA,NO | NA,NO | NA,NO | NA,NO | NA,NO | NA,NO | NA,NO | NA,NO | NA,NO | NA,NO | NA,NO | NA,NO | NA,NO | NA,NO | NA,NO | NA,NO | NA,NO | NA,NO | NA,NO | NO,NA | NO,NA | NO,NA | NO,NA | NO,NA | NO,NA | 0,00 |
C5F12 | NA,NO | NA,NO | NA,NO | NA,NO | NA,NO | NA,NO | NA,NO | NA,NO | NA,NO | NA,NO | NA,NO | NA,NO | NA,NO | NA,NO | NA,NO | NA,NO | NA,NO | NA,NO | NA,NO | NA,NO | NA,NO | NA,NO | NA,NO | NA,NO | NA,NO | NA,NO | NO,NA | NO,NA | NO,NA | NO,NA | NO,NA | NO,NA | 0,00 |
C6F14 | NA,NO | NA,NO | NA,NO | NA,NO | NA,NO | NA,NO | NA,NO | NA,NO | NA,NO | NA,NO | NA,NO | NA,NO | NA,NO | NA,NO | NA,NO | NA,NO | NA,NO | NA,NO | NA,NO | NA,NO | NA,NO | NA,NO | NA,NO | NA,NO | NA,NO | NA,NO | NO,NA | NO,NA | NO,NA | NO,NA | NO,NA | NO,NA | 0,00 |
C10F18 | NA,NO | NA,NO | NA,NO | NA,NO | NA,NO | NA,NO | NA,NO | NA,NO | NA,NO | NA,NO | NA,NO | NA,NO | NA,NO | NA,NO | NA,NO | NA,NO | NA,NO | NA,NO | NA,NO | NA,NO | NA,NO | NA,NO | NA,NO | NA,NO | NA,NO | NA,NO | NO,NA | NO,NA | NO,NA | NO,NA | NO,NA | NO,NA | 0,00 |
c-C3F6 | NA,NO | NA,NO | NA,NO | NA,NO | NA,NO | NA,NO | NA,NO | NA,NO | NA,NO | NA,NO | NA,NO | NA,NO | NA,NO | NA,NO | NA,NO | NA,NO | NA,NO | NA,NO | NA,NO | NA,NO | NA,NO | NA,NO | NA,NO | NA,NO | NA,NO | NA,NO | NO,NA | NO,NA | NO,NA | NO,NA | NO,NA | NO,NA | 0,00 |
Unspecified mix of PFCs(4) - (kt CO2 equivalent) | NA,NO | NA,NO | NA,NO | NA,NO | NA,NO | NA,NO | NA,NO | NA,NO | NA,NO | NA,NO | NA,NO | NA,NO | NA,NO | NA,NO | NA,NO | NA,NO | NA,NO | NA,NO | NA,NO | NA,NO | NA,NO | NA,NO | NA,NO | NA,NO | NA,NO | NA,NO | NO,NA | NO,NA | NO,NA | NO,NA | NO,NA | NO,NA | 0,00 |
Unspecified mix of HFCs and PFCs - (kt CO2 equivalent) | NA,NO | NA,NO | NA,NO | NA,NO | NA,NO | NA,NO | NA,NO | NA,NO | NA,NO | NA,NO | NA,NO | NA,NO | NA,NO | NA,NO | NA,NO | NA,NO | NA,NO | NA,NO | NA,NO | NA,NO | NA,NO | NA,NO | NA,NO | NA,NO | NA,NO | NA,NO | NO,NA | NO,NA | NO,NA | NO,NA | NO,NA | NO,NA | 0,00 |
Emissions of SF6 - (kt CO2 equivalent) | 2098,54 | 2098,54 | 1983,46 | 672,58 | 703,76 | 837,57 | 579,80 | 547,63 | 553,11 | 693,20 | 833,63 | 891,28 | 754,64 | 227,16 | 215,65 | 261,34 | 296,86 | 202,51 | 71,20 | 60,77 | 56,18 | 68,50 | 53,62 | 52,63 | 55,44 | 48,84 | 67,59 | 61,17 | 56,28 | 53,85 | 67,98 | 73,72 | -96,49 |
SF6 | 0,09 | 0,09 | 0,09 | 0,03 | 0,03 | 0,04 | 0,03 | 0,02 | 0,02 | 0,03 | 0,04 | 0,04 | 0,03 | 0,01 | 0,01 | 0,01 | 0,01 | 0,01 | 0,00 | 0,00 | 0,00 | 0,00 | 0,00 | 0,00 | 0,00 | 0,00 | 0,00 | 0,00 | 0,00 | 0,00 | 0,00 | 0,00 | -96,49 |
Emissions of NF3 - (kt CO2 equivalent) | NA,NO | NA,NO | NA,NO | NA,NO | NA,NO | NA,NO | NA,NO | NA,NO | NA,NO | NA,NO | NA,NO | NA,NO | NA,NO | NA,NO | NA,NO | NA,NO | NA,NO | NA,NO | NA,NO | NA,NO | NA,NO | NA,NO | NA,NO | NA,NO | NA,NO | NA,NO | NO,NA | NO,NA | NO,NA | NO,NA | NO,NA | NO,NA | 0,00 |
NF3 | NA,NO | NA,NO | NA,NO | NA,NO | NA,NO | NA,NO | NA,NO | NA,NO | NA,NO | NA,NO | NA,NO | NA,NO | NA,NO | NA,NO | NA,NO | NA,NO | NA,NO | NA,NO | NA,NO | NA,NO | NA,NO | NA,NO | NA,NO | NA,NO | NA,NO | NA,NO | NO,NA | NO,NA | NO,NA | NO,NA | NO,NA | NO,NA | 0,00 |
10.2 Annex II. Summary of reporting of supplementary information under Article 7, paragraph 2, of the Kyoto Protocol.
Table A2-1 Summary of reporting of the Supplementary information under Article 7, paragraph 2, of the Kyoto Protocol in the NC8.
Information reported under Article 7, paragraph 2 | Chapter |
|---|---|
National systems in accordance with Article 5, paragraph 1 | NC chapter 3.3 |
National registries | NC chapter 3.4 |
Information on base year, assigned amount and total greenhouse gas emission trend under the Kyoto Protocol | Base year: BR chapter 3 Assigned amount: BR chapter 4.4.2 Emission trend: NC chapter 3, Annex I and CTF table 1. |
Supplementarity relating to the mechanisms pursuant to Articles 6, 12 and 17 | 5.7 |
Policies and measures in accordance with Article 2 | 4.3 |
Legislative arrangements and enforcement and administrative procedures | 4.2 |
Information under Article 10: Art 10a (programmes to improve the quality of local emission factors, activity data and/or models which reflect the socio-economic conditions of each Party for the preparation and periodic updating of national inventories) Art 10b (measures to mitigate climate change and measures to facilitate adequate adaptation to climate change) Art 10c (transfer of, or access to, environmentally sound technologies, know-how, practices and processes pertinent to climate change, in particular to developing countries) Art 10d (maintenance and the development of systematic observation systems and development of data archives to reduce uncertainties related to the climate system etc.) Art 10e (the development and implementation of education and training programmes) | Art. 10a: 3.3 Art. 10b: 6.4 Art. 10c: 7.2 Art. 10d: 8 Art. 10e: 9 |
Financial resources | 7 |
10.3 Annex III. Norway’s fifth Biennial Report under the Framework Convention on Climate Change
1 Introduction
This report is Norway’s fifth biennial report related to climate change under the Framework Convention on Climate Change (UNFCCC). The latest National Inventory Report (NIR) for greenhouse gases was submitted in April 2022. Norway ratified the UNFCCC on 9 July 1993. Norway ratified the Kyoto Protocol on 30 May 2002 and became a Party when the Protocol entered into force on 16 February 2005, and ratified the Doha amendment in June 2014. In addition, Norway ratified the Paris Agreement on 20 June 2016.
Norway’s fifth Biennial Report (BR5) has been prepared in accordance with the “UNFCCC biennial reporting guidelines for developed country Parties” as contained in annex 1 to decision 2/CP.17. The common tabular format (CTF) tables have been prepared to be in accordance with decisions 19/CP.18 and 9/CP.21.
Figure A3-1 Total emissions of greenhouse gases by sources and removals from LULUCF in Norway 1990–2020 (Million tonnes CO2 equivalents). 2021 estimate is preliminary.
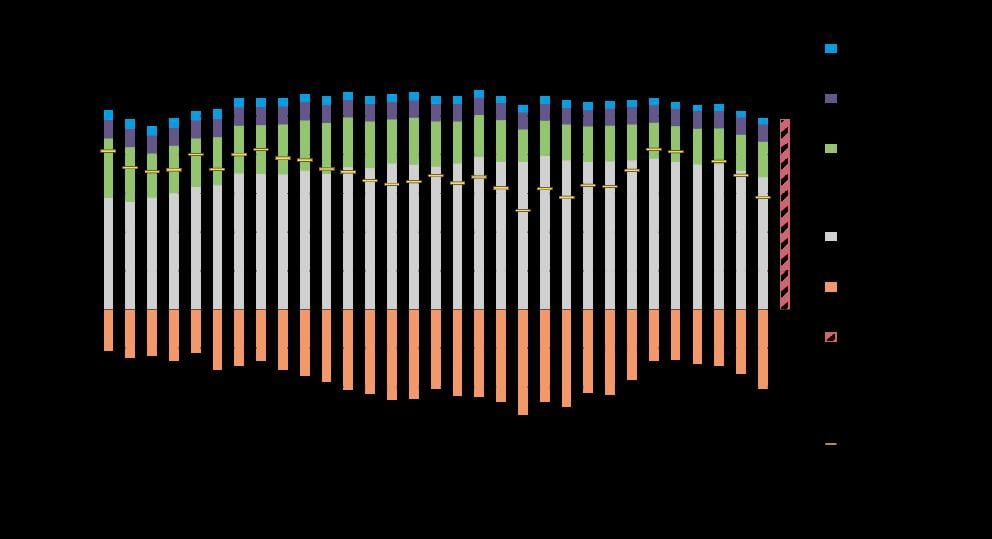
Source: Statistics Norway/Norwegian Environment Agency/ Norwegian Institute of Bioeconomy Research
This BR5 is submitted in conjunction with Norway’s eighth National Communication (NC8) and will in some cases refer to information reported in the NC8. The BR5 focuses on the implementation and achievement of Norway’s 2020 target, as operationalised through the Kyoto Protocol’s second commitment period, and provision of support since what was reported in BR4.
2 Information on greenhouse gas emissions and trends
2.1 Emission trends for aggregated greenhouse gas emissions
The Norwegian National Inventory Report (NIR) has been prepared in accordance with the UNFCCC Reporting Guidelines on Annual Inventories, and the estimation methods generally follow the Guidelines for National Greenhouse Gas Inventories published by the Intergovernmental Panel on Climate Change (IPCC). The latest inventory with the National Inventory Report (NIR) and Common Reporting Format (CRF) covering the years 1990–2020 was submitted to the UNFCCC Secretariat 8 April 2022.
Chapter 2 of Norway’s 2022 NIR and chapter 3 of Norway’s eighth National Communication provide detailed information on the greenhouse gas emissions and removals trends for gases and sectors. Therefore, only a short summary of the GHG emissions and removals trends for the years 1990–2020 is included here in BR5. Norway’s inventory includes indirect emissions of CO2 from non-combustion sources originating from the fossil part of CH4 and NMVOC. If not specified otherwise, emission figures include indirect CO2 emissions, but not LULUCF.
In 2020, total greenhouse gas (GHG) emissions in Norway were 49.3 million tonnes of carbon dioxide equivalents, which is a decrease of 1.8 million tonnes compared to 2019. Preliminary figures for 2021 show 48.9 Mt. Emissions reached their peak at 56.6 million tonnes in 2007. They have since decreased by 13 per cent, and were in 2020 2.2 million tonnes, or 4.2 per cent, lower than in 1990. The net greenhouse gas emissions, including all sources and sinks, were 28.9 million tonnes of CO2 equivalents in 2020 as compared to 40.9 Mt in 1990. The total emissions distribution among the main CRF categories from 1990 to 2020 is illustrated in Figure 2.1.
Table 2.1 presents the total emissions including indirect CO2 emissions and its distribution among the main CRF categories from 1990 to 2020, and a preliminary estimate of the total for 2021. The total indirect CO2 emissions are also presented in this table.
Table A3-1Total emissions of greenhouse gases by sources and removals from LULUCF in Norway 1990–2020. Emissions are given in million tonnes CO2 equivalents
Year | Energy | Industrial processes and product use | Agriculture | LULUCF | Waste | Total with indirect CO2 and without LULUCF | Total with indirect CO2 and with LULUCF | Indirect CO2 emissions |
|---|---|---|---|---|---|---|---|---|
1990 | 28.8 | 15.4 | 4.8 | -10.5 | 2.4 | 51.4 | 40.9 | 0.6 |
1995 | 32.1 | 12.4 | 4.7 | -15.4 | 2.3 | 51.6 | 36.2 | 0.9 |
2000 | 35.0 | 13.2 | 4.6 | -18.6 | 2.1 | 54.9 | 36.3 | 1.0 |
2005 | 36.9 | 11.7 | 4.6 | -20.3 | 1.8 | 54.9 | 34.6 | 0.5 |
2010 | 39.7 | 9.1 | 4.4 | -23.7 | 1.8 | 54.9 | 31.2 | 0.3 |
2011 | 38.6 | 9.2 | 4.3 | -25.0 | 1.8 | 54.0 | 29.0 | 0.3 |
2012 | 38.1 | 9.2 | 4.4 | -21.4 | 1.8 | 53.4 | 32.1 | 0.3 |
2013 | 38.3 | 9.3 | 4.4 | -21.9 | 1.7 | 53.7 | 31.8 | 0.3 |
2014 | 38.5 | 9.3 | 4.5 | -18.1 | 1.7 | 54.0 | 35.9 | 0.3 |
2015 | 39.0 | 9.3 | 4.5 | -13.1 | 1.6 | 54.5 | 41.4 | 0.3 |
2016 | 38.1 | 9.3 | 4.6 | -12.8 | 1.6 | 53.6 | 40.7 | 0.3 |
2017 | 37.5 | 9.2 | 4.6 | -13.9 | 1.5 | 52.8 | 39.0 | 0.3 |
2018 | 37.5 | 9.3 | 4.5 | -14.6 | 1.5 | 52.9 | 38.3 | 0.3 |
2019 | 35.9 | 9.3 | 4.5 | -16.4 | 1.4 | 51.1 | 34.7 | 0.3 |
2020 | 34.2 | 9.2 | 4.5 | -20.3 | 1.4 | 49.3 | 28.9 | 0.3 |
2021* | 48.9 |
Source: Statistics Norway/Norwegian Environment Agency/ Norwegian Institute of Bioeconomy Research. *2021 estimate is preliminary.
Since 1990 Norway has experienced strong economic and population growth as well as expansion of petroleum extraction. These factors have led to increased use of fossil fuels, and consequently higher CO2 emissions. However, the overall growth in CO2 has been offset by reductions in other gases and sectors.
In 2020, the net greenhouse gas removals in the LULUCF sector was 20.3 million tonnes CO2 equivalents, which corresponds to about 41 per cent of the national greenhouse gas emissions (from all other sectors than LULUCF) that year. The average annual net sequestration from the LULUCF sector was about 18.0 million tonnes of CO2 equivalents for the period 1990–2020. It should be noted, however, that only a small portion of this can be accounted for under the Kyoto Protocol. The calculated changes in carbon stocks depend upon several factors such as growing conditions, harvest levels, management practices and land use changes. In particular, variations in annual harvest will in the short term directly influence the variations in changes in carbon stocks and dead organic matter.
CTF table 1 with the trends for the gases is reported through the CTF application and are also found as Annex I to the NC8 report.
2.2 National inventory arrangements and changes
The national system for greenhouse gas inventories is based on close cooperation between the Norwegian Environment Agency, Statistics Norway and the Norwegian Institute of Bioeconomy Research (NIBIO). Statistics Norway is responsible for the official statistics on emissions to air. NIBIO is responsible for the calculations of emissions and removals from Land Use and Land Use Change and Forestry (LULUCF). Chapter 3.3 in NC8 describes the Norwegian national system for greenhouse gas inventory. For a complete description of the national inventory arrangements, see chapter 1.2 of the 2022 NIR. For comprehensive information regarding the national system under the Kyoto Protocol, see Annex V of the NIR. There have been no changes to the national inventory arrangements since Norway’s fourth Biennial Report was reported.
3 Quantified economy-wide emission reduction target
Norway’s climate targets are described in detail in chapter 4 of Norway’s eighth National Communication. In this BR5, Norway reports on the target for the period through 2020. By 2020, Norway was committed to reduce global emissions of greenhouse gases equivalent by 30 per cent relative to Norway’s emission level in 1990. The target was set by the Government in 2007, agreed by the Norwegian Parliament and set the overall ambition level. It was reported pursuant to the Copenhagen Accords. In 2012, this target was made operational through the legally binding commitment for 2013–2020 under the Kyoto Protocol where average emissions in 2013–2020 shall not exceed 84 per cent of the 1990 level. Norway ratified the Doha amendments 12 June 2014. Thus, compliance with the commitment under KP was also implied that the 30 per cent target for 2020 is achieved. Norway explained the relation between the target and a quantified emissions reduction commitment for an 8 years period in its submission under the KP the 8th of May 2012102 and in the subsequent presentation to the AWG KP on the 16th of May103.
In April 2016, Norway submitted its report to facilitate the calculation of its assigned amount pursuant to Article 3, paragraphs 7bis, 8 and 8bis, of the Kyoto Protocol for the second commitment period and to demonstrate its capacity to account for its emissions and assigned amount (hereinafter referred to as the initial report) to facilitate the calculation of the assigned amount.104 The initial report has been reviewed and in 2021 Norway issued its assigned amount in its registry.
Through the initial report Norway made a number of choices with regards to the implementation of the Kyoto Protocol’s second commitment period. CTF table 2 describes relevant information for Norway’s implementation of the second commitment period under the Kyoto Protocol and the most important aspects are summarised here in textual form.
Norway has reported and will account for all the mandatory gases or groups of gases. The year 1990 is used as the base year, with the exception of NF3 which has 2000 as the base year. All mandatory sectors are included and are aggregated with the global warming potential values from the Fourth Assessment Report of the IPCC.
Pursuant to the accounting rules under the Kyoto Protocol, Norway uses an activity-based approach for the LULUCF sector through 2020. For the Kyoto Protocol’s second commitment period, Norway has continued to report on emissions and removals from Deforestation and Afforestation/Reforestation under Article 3.3 and Forest Management under Article 3.4 in accordance with paragraph 7 in Annex I to decision 2/CMP.7. In addition, Norway elected to include emissions and removals from the voluntary activities Cropland Management and Grazing land Management under Article 3.4 for the second period. Norway accounted for all the activities under Articles 3.3 and 3.4 at the end of the commitment period.
As a supplement to domestic action to reduce emissions and enhance removals, Norway will use market-based mechanisms to demonstrate compliance. This includes AAUs reflecting net transfers under the European ETS from the EU to Norway and CERs acquired through the procurement program. Norway will also use about 9 million Kyoto units that were carried over from the first commitment period (see CTF table 2(e)I). 3 million units were acquired by the procurement program, and the 6 million AAUs refer to a swap where the CERs and ERUs used by the ETS installations to offset their emissions in 2013 and 2014 were retired pursuant to the KP 1, and a similar amount of AAUs are carried over. See further information in chapter 4.5 of this BR.
Table A3-2(CTF table 2a). Description of quantified economy-wide emission reduction target: base year
NORWAY | ||
|---|---|---|
Base year/base period | 1990 | |
Emission reduction target | % of base year: 30% | % of 1990: 30% |
Period for reaching target | 2020 | |
Table A3-3(CTF table 2b). Description of quantified economy-wide emission reduction target: gases and sectors covered
Gases covered | Base year for each gas (year): |
|---|---|
CO2 | 1990 |
CH4 | 1990 |
N2O | 1990 |
HFCs | 1990 |
PFCs | 1990 |
SF6 | 1990 |
NF3 | 2000 |
Other gases | NA |
Sectors covered | Covered |
Energy | Yes |
Transport | Yes |
Industrial processes | Yes |
Agriculture | Yes |
LULUCF | Yes |
Waste | Yes |
Other (specify) | NA |
Abbreviations: LULUCF = land use, land-use change and forestry.
Table A3-4(CTF table 2c). Description of quantified economy-wide emission reduction target: global warming potential values (GWP)
Gases | GWP values |
|---|---|
CO2 | Fourth Assessment Report of the IPCC |
CH4 | Fourth Assessment Report of the IPCC |
N2O | Fourth Assessment Report of the IPCC |
HFCs | Fourth Assessment Report of the IPCC |
PFCs | Fourth Assessment Report of the IPCC |
SF6 | Fourth Assessment Report of the IPCC |
NF3 | Fourth Assessment Report of the IPCC |
Other gases | NA |
Abbreviation: GWP = global warming potential
Table A3-5(CTF table 2d). Description of quantified economy-wide emission reduction target: approach to counting emissions and removals from the LULUCF sector
LULUCF in base year level and target | Included in target year/period | |
|---|---|---|
Role of LULUCF | Contribution of LULUCF is calculated using | Activity-based approach with accounting rules as applied under the Kyoto Protocol |
Abbreviation: LULUCF = land use, land-use change and forestry.
Table A3-6(CTF table 2(e)I). Description of quantified economy-wide emission reduction target: market-based mechanisms under the Convention a
Possible scale of contributions (estimated kt CO2 equivalents) | 73 484 |
|---|---|
CERs | 8 905 |
ERUs | 738 |
AAUs b | 63 841 1 |
Carry-over units c | IE 2 |
Other mechanism units under the Convention (specify) d | NA |
Abbreviations: AAU = assigned amount unit, CER = certified emission reduction, ERU = emission reduction unit.
a Reporting by a developed country Party on the information specified in the common tabular format does not prejudge the position of other Parties with regard to the treatment of units from market-based mechanisms under the Convention or other market-based mechanisms towards achievement of quantified economy-wide emission reduction targets.
b AAUs issued to or purchased by a Party.
c Units carried over from the first to the second commitment periods of the Kyoto Protocol, as described in decision 13/CMP.1 and consistent with decision XX /CMP.8.
d As indicated in paragraph 5(e) of the guidelines contained in annex I of decision 2/CP.17.
1 The number of AAUs are in addition to the AAUs issued to Norway.
2 Carry-over units are included in CERs, ERU and AAUs. The carry-over includes 2.25 million CERs and 0.74 million ERUs to Norway’s party holding account and 5.98 million AAUs pertaining to a swap of CERs/ERUs used for compliance in the EU ETS in 2013–2014.
Table A3-7 (CTF table 2(e)II). Description of quantified economy-wide emission reduction target: other market-based mechanisms
Possible scale of contributions (estimated kt CO2 equivalents) | |
|---|---|
NA | Norway will not use other market mechanisms than those eligible for meeting Norway’s commitment under the Kyoto Protocol. |
Table A3-8(CTF table 2(f). Description of quantified economy-wide emission reduction target: any other information.
Target for 2020 under the Convention is made operational through the commitment to reduce emissions by 16 per cent for the period 2013–2020 (see BR chapter 4). |
4 Progress in achievement of quantified economy-wide emission reduction targets and relevant information
4.1 Mitigation actions and their effects
Norway has over the years introduced several policies and measures that have reduced the GHG emissions. Chapter 4 and section 5.3 of Norway’s eighth National Communication (NC8), to which this BR5 is annexed, describe these policies and measures and estimate the effects these have had or will have on the historical and projected emissions. The descriptions of individual policies and measures are not repeated in this BR5, but CTF table 3 is included (see table 4.1).
There are considerable methodological difficulties in calculating the effects of policies and measures ex post, including establishing a hypothetical baseline and obtaining relevant data. There is also uncertainty related to such estimates. Nevertheless, effects are estimated for a number of policies and measures. According to the estimates, the historical GHG emissions (without LULUCF) in 2020 would have been about 23.4 million tonnes of CO2 equivalents higher than observed, if these policies and measures had not been implemented. Similarly, projected GHG emissions (without LULUCF) would be about 34.9 million tonnes higher in 2030. The total estimates prepared for the NC8 are illustrated in Figure 4.1. The figure also shows the historical GHG emissions without LULUCF for 1990–2020 together with the projections in the with existing measures (WEM) scenario.
To arrive at a total, the estimated effects of each significant policy and measure are aggregated. The estimated and expected effects of the individual policies and measures which are addressed in chapter 4 of the NC8 are based on the work of several agencies and ministries. The effects for 1995, 2000, 2005, 2010 and 2015 are from the estimates in the seventh National Communication. The effects for 2020, 2025, 2030 and 2035 are from the estimates of the eighth National Communication.
Figure 4.1 also shows the potential emission reduction that can come as a result of proposed climate measures and policies and measures that are under consideration, see box 4.2 in the NC8. It is estimated that measures proposed in the budget in aggregate can reduce the ESR emissions by 9.3–9.9 million tonnes of CO2-equivalents in the period 2021–2030. The potential effect for 2025 and 2030 are about 1 and 1.7 million tonnes CO2 equivalents respectively and is illustrated by the green line in the figure. A further 10.4 to 11 million tonnes of CO2 equivalents in the period 2021–2030 can come from policies and measures that are under consideration. The potential effect for 2025 and 2030 are about 0.8 and 2.4 million tonnes CO2 equivalents respectively and the incremental effect of this is illustrated by the purple line in the figure. Estimates have only been considered up to 2030.
The UNFCCC biennial reporting guidelines call for information on mitigation actions, including the policies and measures that have been implemented or are planned to be implemented since the last national communication or biennial report. In CTF table 3, Norway therefore includes the policies and measures reported in the sectoral tables in chapter 4 of the NC8 and their estimated effects in 2020 and 2030. The policies and measures are organized by sector and by gas both in CTF table 3 and in the NC8. In order to avoid duplication, reference is made to the description of the mitigation actions in chapter 4 of the NC8.
For some of the policies and measures in CTF table 3 the impact in terms of GHG reductions are not estimated (NE). In chapter 4 of the NC8 the reasons are explained to the extent possible. Thus, although no numerical effect has been estimated, the various policies and measures are likely to have an impact in terms of GHG reductions. It should also be noted that as most of the stationary energy consumption in Norway is based on electricity and the electricity supply in Norway is almost entirely based on renewable energy, enhancing energy efficiency and encouraging the use of new renewable energy sources do not necessarily have an impact on domestic emissions.
Figure 10.1
Figure 10.2 Figure A3.2 Emissions with and without measures (mill. tonnes CO2 equivalents).
Sources: Statistics Norway, Norwegian Environment Agency and Ministry of Finance.
Table A3-9 (CTF table 3). Progress in achievement of the quantified economy-wide emission reduction target: information on mitigation actions and their effects
Name of mitigation actiona | Sector(s) affectedb | GHG(s) affected | Objective and/or activity affected | Type of instrumentc | Status of implementationd | Brief descriptione | Start year of implementation | Implementing entity or entities | Estimate of mitigation impact (not cumulative, in kt CO2 equivalents) | |
|---|---|---|---|---|---|---|---|---|---|---|
2020 | 2030 f | |||||||||
The Norwegian tax scheme on emissions of GHGs under the ESR (excluding road transport) (1)* | Cross-cutting | CO2, HFC | Cost-effective reductions of emissions | Fiscal | Implemented | CO2 taxes on mineral oil, petrol and emissions from petroleum extraction on the continental shelf were introduced in 1991 to cost-efficiently limit greenhouse gas emissions | 1991 | Ministry of Finance | 1 000.00 | 1 000.00 |
Tax on waste incineration* | Energy | CO2 | Cost-effective reductions of emissions | Fiscal | Implemented | Introduced in 2022. Incentivizes reduced inceneration of fossil materials, increased recycling of plastics and the implementation of CCS technology. | 2022 | Ministry of Finance | NA | IE |
Tax and reimbursement scheme on HFC and PFC* | Industry/industrial processes | HFC | Improved control of fugitive emissions from industrial processes | Economic | Implemented | Has resulted in better maintenance and improved routines during discharge of old equipment. | 2003 | Directorate of Customs and Excise, Norwegian Environmental Agency | IE | IE |
Emissions trading (2008–2012) onshore* | Industry/industrial processes, Energy | CO2, N2O | Reduce emissions | Economic | Implemented | Part of the EU Emissions Trading Scheme, see text for further details. | 2008 | Norwegian Environment Agency | 300.00 | 300.00 |
Emissions trading (2013-) onshore (2)* | Industrial processes, Energy | CO2, N2O, PFC | Reduce emissions | Economic | Implemented | Part of the EU Emissions Trading Scheme, see text for further details. | 2013 | Norwegian Environment Agency | IE | IE |
Regulation by the Pollution Control Act* | Industrial Processes; Energy | CO2, HFC, CH4, N2O, PFC, SF6 | Reduce pollution | Regulatory | Implemented | The Act lays down a general prohibition against pollution. Pollution is prohibited unless one has a specific permission. | 1983 | Norwegian Environment Agency | NE | NE |
The Planning and Building Act* | Cross-cutting | CO2 | Energy consumption | Regulatory | Implemented | State act regulating the management of land use in Norway. Planning pursuant to the act shall ensure sustainable development and take climate into account. The PaM “Energy requirements in the building code” follows the planning- and building act. | 1985 | Ministry of Local Government and Regional Development | NE | NE |
Enova* | Transport, Industry/industrial processes, Energy | CO2 | Efficiency improvements of buildings; Efficiency improvement in industrial end-use sectors; Demand management/reduction; Low carbon fuels; Electric road transport; Reduce emissions from international air or maritime transport; Installation of abatement technologies | Economic, Information | Implemented | Financial support to climate projects aiming for technology development or early market diffusion. | 2002 | Ministry of Climate and Environment | 959.00 | 2 629.00 |
Klimasats* | Cross-cutting | CO2, HFC, CH4, N2O, PFC, SF6 | Reduce emissions | Economic | Implemented | Reduce emissions at local level and contribute to the transition to a low carbon society. | 2016 | Norwegian Environment Agency | NE | NE |
The environmental technology scheme – Innovation Norway* | Cross-cutting | CO2 | Contribute to sustainable business development in Norway and realize Norway’s environmental goals | Research | Implemented | The Environmental Technology Scheme offers grants and other support for development and investments in pilot and demonstration projects for new Norwegian environmental technology. | 2010 | Norwegian Ministry of Trade, Industry and Fisheries | NE | NE |
Nysnø Klimainvesteringer AS (Nysnø)* | Cross-cutting | CO2 | Contribute to reducing greenhouse gas emissions through investments with such an effect directly or indirectly. | Economic | Implemented | Nysnø invests in non-listed companies and funds aimed at non-listed companies that have operations in Norway. It focuses on early-stage companies and invests primarily in the transition from technology development to commercialisation. | 2018 | Norwegian Ministry of Trade, Industry and Fisheries | NE | NE |
Climate policies that affect the petroleum sector* | Energy | CO2 | Reduce emissions | Regulatory | Implemented | Coverage and rates changed since 1991, see text for further details. | 1991 | Ministry of Finance, Norwegian Environment Agency | 7 000.00 | 10 000.00 |
Indirect CO2 emissions from offshore NMVOC regulation * | Energy | CO2, CH4 | Reduce indirect CO2 emissions from offshore oil and gas production | Regulatory | Implemented | Phase in of vapour recovery units technology, see text for further details. | 2002 | Norwegian Environment Agency | 96.00 | 104.00 |
Indirect CO2 emissions from onshore NMVOC regulation * | Energy | CO2, CH4 | Reduce indirect CO2 emissions from offshore oil and gas industries | Regulatory | Implemented | Installation of vapour recovery units. | 1996 | Norwegian Environment Agency | 55.00 | 55.00 |
Carbon capture and storage (CCS) (3)* | Industry/industrial processes, Waste management/waste | CO2 | Reduce emissions | Economic, Research | Adopted | CCS is a key tool for reducing global greenhouse gas emissions. Work in this field is focusing on the development of technology and ways of reducing costs. The government supports a full-scale CCS demonstration project, which consist of two capture sites in Norway, and transport and storage of CO2 at the continental shelf. | 2005 | Ministry of Petroleum and Energy | 0.00 | 800.00 |
Electricity tax * | Cross-cutting | CO2 | Reduce electricity consumption | Fiscal | Implemented | Tax on electricity consumption | 1951 | Ministry of Finance | NE | NE |
Base tax on mineral oils etc* | Cross-cutting | CO2 | Increase in renewable energy | Fiscal | Implemented | Excise duty on mineral oils | 2000 | Ministry of Finance | 40.00 | 40.00 |
Electricity Certificate Act* | Energy | CO2 | Increase in renewable energy | Economic | Implemented | Norway and Sweden will increase their renewable electricity generation by 28.4 TWh from 2012 to the end of 2020 (an average of 3.2 TWh yr.) | 2012 | Ministry of Petroleum and Energy | NE | NE |
Energy requirements in the building code* | Energy | CO2 | Efficiency improvements of buildings | Regulatory | Implemented | Energy requirements in buildings to ensure more energy efficient buildings. | 2007 | Ministry of Local Government and Regional Development | NE | NE |
Ban on the use of mineral oil for heating of buildings from 2020 and house construction sites from 2022* | Energy | CO2 | Efficiency improvements of buildings | Regulatory | Implemented | The ban covers the use of mineral oil for both main heating (base load) and additional heating (peak load), in residential buildings, public buildings, commercial buildings, and for temporary heating og drying of materials in buildings under construction or alteration. | 2020 | Ministry of Climate and Environment, Ministry of Petroleum and Energy | 400.00 | 380.00 |
Renewable Scheme* | Energy | CO2 | Replace fossil energy with bioenergy | Economic | Implemented | Monetary support schemes for converting to bioenergy. | 2003 | Ministry of Agriculture and Food | 100.00 | 175.00 |
Taxes and regulations on emissions from road transportation* | Transport | CO2 | Reduce emissions from road transport | See below | Implemented | Several policies affecting road traffic | See below | Ministry of Finance | 4 000.00 | 6 800.00 |
The Norwegian tax scheme on emissions of GHGs under the ESR (road transport only) (4)* | Transport | CO2 | Cost-effective reductions of emissions | Fiscal | Implemented | CO2 taxes on mineral oil, petrol and emissions from petroleum extraction on the continental shelf were introduced in 1991 to cost-efficiently limit greenhouse gas emissions | 1991 | Ministry of Finance | IE | IE |
Road usage tax * | Transport | CO2 | Besides creating revenue, the intention is to price the external costs of road transport, except emissions of CO2 | Fiscal | Implemented | The road usage tax applies to petrol, mineral oil, biodiesel, bioethanol, natural gas and LPG | 1931 | Ministry of Finance | IE | IE |
One-off registration tax based on CO2-emissions and with special rules for plug-in hybrid cars* | Transport | CO2 | Reduce emissions from new cars | Economic | Implemented | Registration tax is based on CO2 emissions, NOx emissions and weight. CO2 emissions included in 2007 – increasingly emphasised. Additional weight rebates for plug-in hybrids in the registration tax. | 2007 | Ministry of Finance | IE | IE |
Tax advantages for electric vehicles* | Transport | CO2 | Reduce emissions from new cars | Economic, regulatory | Implemented | Excemption from registration tax and VAT for EVs. Reduced rate in annual motor vehicle tax. Other user advantages as free or low charges for toll roads, ferries and public parking. | 2001 | Ministry of Finance | IE | IE |
Biofuel requirement in road transport* | Transport | CO2 | Reduce emissions from road transport | Regulatory | Implemented | From January 1st 2021, the requirement is that 24.5 % of total fuel sold to road traffic is biofuel, with a sub requirement that 9 % should be advanced biofuel. Advanced biofuel is double counted within the overall requirement. | 2009 | Ministry of Climate and Environment | IE | IE |
CO2 tax on domestic aviation (ETS)* | Transport | CO2 | Cost-effective reductions of emissions | Fiscal | Implemented | Mineral oil for domestic aviation under the ETS is also subject to the CO2-tax on mineral products. | 1999 | Ministry of Finance | 10.00 | 10.00 |
Blending mandate for advanced jet biofuel in aviation* | Transport | CO2 | Reduced emissions from aviation | Regulatory | Implemented | From January 1st 2020, 0.5 % of total fuel sales in aviation is required to be advanced biofuel. | 2020 | Ministry of Climate and Environment | 6.00 | 6.00 |
Pilot projects for fossil free construction sites* | Transport | CO2 | Reduces emissions from construction machinery | Economic | Implemented | Support scheme for increased use of zero emission equipment on construction sites for public transport infrastructure | 2022 | Ministry of transport and communication | NE | NE |
Urban growth agreements and reward scheemes for public transport* | Transport | CO2 | Modal shift to public transport or non-motorized transport, demand management/reduction | Economic, Voluntary Agreement | Implemented | The 9 largest urban areas either have urban environment agreements, urban growth agreements or a reward scheme for public transport, which all share the same common goal of zero growth in passenger traffic by car. | 2012 | Ministry of transport and communication | NE | 60.00 |
Maximum CO2-emissions from the coastal service Bergen-Kirkenes* | Transport | CO2 | Reduce emissions | Regulatory | Implemented | Requirements for maximum CO2-emissions from the coastal route Bergen to Kirkenes. | 2016 | Ministry of transport and communication | NE | 60.00 |
Requirements for zero and low-emission technology in tenders for public ferries* | Transport | CO2 | Reduce emissions from ferries | Economic, regulatory | Implemented, planned | Low- and zero emission criteria for ferries from 2023 where suitable | 2015 | Ministry of transport and communication | 100.00 | 200.00 |
Aid Scheme for Short Sea Shipping* | Transport | CO2 | Reduce emission from freight transport | Economic | Implemented, Planned | Shipowners may receive financial aid for operational costs or for investments costs over a three-year period in order to establish a sustainable maritime transport route. | 2017 | Ministry of Trade, Industry and Fisheries | 23.00 | 24.00 |
Green Shipping Programme* | Transport | CO2 | Reduce emission from freight transport | Economic | Implemented, Planned | The Green Shipping Programme (GSP) is a public-private partnership working to reduce barriers for the introduction of low and zero emission solutions within the maritime sector. The program has initiated 28 green pilot projects since its beginning in 2015, and completed 8 of them. Since 2019, the programme has had a special focus on fleet renewal within the short shipping segments. | 2019 | Ministry of Trade, Industry and Fisheries | NA | 360.00 |
Risk loan scheme for Norwegian short sea vessels* | Transport | CO2 | Reduce emission from freight transport | Economic | Implemented | The national risk loan scheme for short sea shipping and fisheries will contribute to a more climate and environmentally friendly short sea shipping and fishing fleet by providing loans for investments in low and zero emission vessels. | 2020 | Ministry of Trade, Industry and Fisheries | NE | NE |
Recycling scheme for Norwegian short sea vessels and offshore vessels* | Transport | CO2 | Reduce emission from freight transport | Economic | Implemented | Established with the aim of fomenting fleet renewal in a segment with little ability or incentives for green fleet renewal. | 2020 | Ministry of Trade, Industry and Fisheries | NE | NE |
High speed passenger ferries scheme* | Transport | CO2 | Reduce emission from freight transport | Economic | Implemented | Financial support scheme dedicated to projects in county councils aiming at reducing emissions for high speed passenger vessels. | 2019 | Ministry of Climate and Environment | NA | 12.00 |
Maritime Zero 2050* | Transport | CO2 | Reduce emission from freight transport | Economic | Implemented | Directed towards development of zero emission solutions for large ships sailing long distances. | 2022 | Ministry of Trade, Industry and Fisheries | NA | NE |
Investments in railways* | Transport | CO2 | Reduce emission from transport | Economic | Implemented, planned | 1) Investment in railway infrastructure in the larger capital area, the so called InterCity-project. 2) Investment in specific infrastructure measures for freight transport. | 2011 | Ministry of transport and communication | NE | 41.00 |
Grant funding to transport freight by rail* | Transport | CO2 | Reduce emission from freight transport | Economic | Implemented | To improve conditions for rail freight operators, and to facilitate a shift from road to rail. | 2019 | Ministry of transport and communication | NE | NE |
Arrangement to reduce emissions in the processing industry, 2004 (5)* | Industrial processes | CO2, HFC, CH4, N2O, PFC, SF6 | Reduce emissions | Voluntary/negotiated agreements | Implemented | The Ministry of Climate and Environment entered into an arrangement with the processing industry. | 2004 | Ministry of Climate and Environment | IE | IE |
Arrangement to reduce emissions in the processing industry, 2009* | Industrial processes | CO2, HFC, CH4, N2O, PFC, SF6 | Reduce emissions | Voluntary/negotiated agreements | Implemented | The Ministry of Climate and Environment entered into an agreement with the processing industry that was not covered by the EU ETS. | 2009 | Ministry of Climate and Environment | 200.00 | 200.00 |
CO2 compensation scheme* | Industrial processes | NA | Prevent carbon leakage | Voluntary | Implemented | The purpose of this compensation scheme is to prevent carbon leakage from Europe resulting from increased electricity prices due to the EU Emissions Trading System (EU ETS). | 2013 | Ministry of Climate and Environment | NA | NA |
Use of bio carbon in the production of cement and ferroalloys* | Industrial processes | CO2 | Reduce emissions | Voluntary/negotiated agreements | Implemented | The producers have voluntarily replaced some of the coal consumption with bio carbon | 1990s (cement), 2000 (ferroalloys) | 500.00 | 500.00 | |
N2O reduction, production and nitric acid* | Industrial processes | N2O | Reduce emissions | Voluntary/negotiated agreements | Implemented | The producers have voluntarily restructured production | 1992 | Ministry of Climate and Environment | 2 833.00 | 2 985.00 |
Agreement with the aluminium industry* | Industrial processes | PFC | Reduce emissions | Voluntary/negotiated agreements | Implemented | The major aluminium producers signed an agreement with the Ministry of Climate and Environment to reduce emissions. | 1997 | Ministry of Climate and Environment | 5 830.00 | 6 300.00 |
Agreement on SF6 reduction from use and production of GIS* | Industrial processes | SF6 | Reduce emissions | Voluntary/negotiated agreements | Implemented | Agreement between the Ministry of Climate and Environment and the business organisations representing most users of gas-insulated switchgear (GIS) and the single producer. | 2002 | Ministry of Climate and Environment | 56.00 | 67.00 |
F-gas regulation and the Kigali Amendment to the Montreal Protocol* | Industrial processes | HFC, SF6 | Reduce emissions | Regulatory | Implemented | Implementation of the revised EU regulation No. 517/2014 and the Kigali Amendment to the Montreal Protocol. | 2019 | Norwegian Environmental Agency | 154.00 | 600.00 |
Regional agri-environmental programme* | Agriculture, LULUCF | CO2, CH4, N2O | Reduce emissions and leaching from agriculture | Economic, regulatory | Implemented | Several support schemes. Differs between regions. No-autumn tillage implemented in 2003 will be strengthened in 2023. Environmentally friendly spreading of manure implemented in 2012. | 2003, 2012 | Ministry of Agriculture and Food | 13.00 | 13.00 |
Requirements and support for livestock on pasture* | Agriculture, LULUCF | CH4, N2O | Increase the time on pasture to improve resource use and animal welfare | Economic, regulatory | Implemented | Various requirements and support schemes differentiated between livestock category and pasture category. | 1990 | Ministry of Agriculture and Food | NE | NE |
Support scheme for Special Environmental Measures in Agriculture* | Agriculture | CH4, N2O | Improved animal waste management systems | Economic | Implemented | Several support schemes, of which storage of manure is mostly targeted to climate mitigation | 2017 | Ministry of Agriculture and Food | NE | NE |
Drainage of agricultural soils* | Agriculture | N2O | Improve the drainage of fields to improve productivity, climate adaptation and reduce emissions from soils | Economic | Implemented | National support scheme | 2013 | Ministry of Agriculture and Food | NE | NE |
Project Climate Smart Agriculture* | Agriculture, LULUCF | CO2, CH4, N2O | Data collection, councelling, sharing knowledge | Information | Implemented | Project to develop and maintain tools to quantify greenhouse gas emissions from farms | 2017 | Ministry of Agriculture and Food | NE | NE |
Climate and environment programme* | Agriculture, LULUCF | CO2, CH4, N2O | Develop knowledge | Information | Implemented | Develop knowledge which, among others, will contribute to reduced emissions on farm level | 2013 | Ministry of Agriculture and Food | NE | NE |
Delivery of manure for production of biogas* | Agriculture, Transport | CH4, N2O | Reduce emissons from storage of manure | Economic | Implemented | Support scheme for delivery of manure. The goal is to increase the utilization of livestock manure to biogas production. | 2015 | Ministry of Agriculture and Food | 0.90 | 0.90 |
Restrictions on cultivation of peatlands* | LULUCF, Agriculture | N2O | Reduce emissions from cultivated organic soils | Regulatory | Implemented | Avoid conversion of peatland into cropland | 2020 | Ministry of Agriculture and Food | 0.00 | 5.00 |
Higher seedling densities in existing areas of forest land* | LULUCF | CO2 | Enhancing production in existing forests | Economic | Implemented | Increase the number of plants to an optimum level from a climate perspective to enhance net carbon sequestration | 2016 | Ministry of Agriculture and Food | 0.00 | 0.00 |
Genetical improvement, plant breeding* | LULUCF | CO2 | Enhanced forest management | Economic | Implemented | Genetically improvement means to single out robust plants which can improve growth and quality. | 2016 | Ministry of Agriculture and Food | 0.00 | 100.00 |
Fertilization of forests as a climate mitigation measure * | LULUCF | CO2, CH4, N2O | Enhancing production in existing forests | Economic | Implemented | Fertilization can sustain or improve carbon sequestration where nitrogen scarcity in existing forest areas limits plant growth. | 2016 | Ministry of Agriculture and Food | 0.00 | 270.00 |
Afforestation | LULUCF | CO2 | Enhancing production in existing forests | Economic | Planned | Planting trees on new areas to increase the carbon uptake | Ministry of Climate and Environment | NA | 0.00 | |
Tending of juvenile stands | LULUCF | CO2 | Enhancing production in existing forests | Economic | Planned | Tending of young stands is to select the most adapted tree species and optimize growth. | Ministry of Agriculture and Food | NA | 500.00 | |
Measures to reduce damage from root-rot | LULUCF | CO2 | Enhancing production in existing forests | Economic | Planned | Treating stumbs after harvest to reduces the spread of tree rot to increase growth. | Ministry of Agriculture and Food | NA | 0.00 | |
Regeneration with proper tree-species | LULUCF | CO2 | Enhancing production in existing forests | Regulatory | Planned | Regeneration with the tree species that gives the highest growth | Ministry of Agriculture and Food | NA | 100.00 | |
Threshold for tree-stand age by harvesting | LULUCF | CO2 | Enhancing production in existing forests | Regulatory | Planned | Regulate the minimum harvesting age | Ministry of Agriculture and Food | NA | 300.00 | |
Reduced emissions from peatlands and bogs* | LULUCF | CO2 | Conservation of carbon in existing forests, prevention of drainage or rewetting of wetlands. | Regulatory | Implemented | Avoid conversion of peatland into cropland | 2020 | Ministry of Agriculture and Food | 4.00 | 60.00 |
Requirement to collect landfill gas* | Waste | CH4 | Reduce emissions from landfills | Regulatory | Implemented | All landfills with biodegradable waste must have a system for extracting landfill gas | 2002 | Ministry of Climate and Environment, Ministry of Agriculture and Food | 153.00 | 94.00 |
Ban on depositing biodegradable waste in landfills* | Waste | CH4 | Reduce emissions from landfills | Regulatory | Implemented | From 2002 landfilling of easy degradable organic waste was prohibited. This prohibition was replaced by the wider prohibition of depositing from 2009 that applies to all biodegradable waste | 2002 | Ministry of Climate and Environment, Ministry of Agriculture and Food | 461.00 | 699.00 |
Other measures in the waste sector* | Waste | CO2, CH4, N2O | Reduce emissions, increase recycling and reduce the quantities of waste | Regulatory, fiscal, voluntary | Implemented | Agreements primarily to ensure that waste is collected and sent to approved treatment. Waste regulations for a number of waste fractions and a tax on beverage packaging. Tax on incineration up to 2010 and for landfills up to 2015. | 1995 | Ministry of Finance and Ministry of Climate and Environment | NE | NE |
Note: The two final columns specify the year identified by the Party for estimating impacts (based on the status of the measure and whether an ex post or ex ante estimation is available).
Abbreviations: GHG = greenhouse gas; LULUCF = land use, land-use change and forestry.
a Parties should use an asterisk (*) to indicate that a mitigation action is included in the ‘with measures’ projection.
b To the extent possible, the following sectors should be used: energy, transport, industry/industrial processes, agriculture, forestry/LULUCF, waste management/waste, other sectors, cross-cutting, as appropriate.
c To the extent possible, the following types of instrument should be used: economic, fiscal, voluntary agreement, regulatory, information, education, research, other.
d To the extent possible, the following descriptive terms should be used to report on the status of implementation: implemented, adopted, planned.
e Additional information may be provided on the cost of the mitigation actions and the relevant timescale.
f Optional year or years deemed relevant by the Party.
Custom footnotes:
1. The effects of the taxes on HFCs and waste incineration are included in the effect of the Norwegian tax scheme on emissions of GHGs under the ESR.
2. The ETS may have contributed to some of the estimated effects reported for industry.
3. Under construction. Existing CCS-projects in the petroleum sector are included in the table for petroleum.
4. The effects of the Norwegian tax scheme on emissions of GHGs under the ESR (road transport only), road usage tax, one-off registration tax based on CO2 emissions and with special rules for plug-in hybrid cars, tax advantages for electric vehicles and biofuel requirement in road transport are included in the effects of taxes and regulations on emissions from road transportation.
5. The effect is included under N2O reduction, production of nitric acid.
4.2 Changes in domestic institutional arrangements
Chapters 4.1.3 and 4.2 of Norway’s eighth National Communication contains information relevant for the current domestic institutional arrangements. There have not been any significant changes to these arrangements since Norway reported its fourth Biennial Report.
4.3 Assessment of economic and social consequences of response measures
The UNFCCC biennial reporting guidelines encourage Parties to provide, to the extent possible, detailed information on the assessment of the economic and social consequences of response measures. This information is found in chapter 4.1.4 in the NC8.
4.4 Estimates of emission reductions and removals and the use of units from the market-based mechanisms and land use, land-use change and forestry activities
4.4.1 General Information
Chapter 4 of Norway’s eighth National Communication and CTF table 3 in this BR5 describe policies and measures that have reduced or will reduce Norway’s national emissions. Chapter 4.4.2 below describes how Norway will demonstrate achievement of its target under the Kyoto Protocol’s second commitment period (2013–2020).
4.4.2 The Kyoto Protocol’s second commitment period (2013–2020)
As explained in chapter 3 of this BR5, the 2020-target was made operational through the legally binding commitment for 2013–2020 under the Kyoto Protocol where average emissions in 2013–2020 shall not exceed 84 per cent of the 1990 level. Table 4.2 below (CTF Table 4) provides relevant information within the adopted reporting format on Norway’s progress made towards meeting its commitment under the Kyoto Protocol’s second commitment period. Since the reporting format does not properly reflect the implementation of the commitment, table 4.2 is supplemented by Table 4.3.
The annual emissions excluding LULUCF for the years 2013–2020 are shown in table 4.2 The contribution from LULUCF for the years 2013–2020 is in line with the information reported in CTF Table 4(a)II. The GHG emissions excluding LULUCF and the contribution from LULUCF are as reported to the UNFCCC in April 2022. Norway’s GHG inventory was subject to the technical expert review in the second half of 2022 and the review report is expected early 2023. The numbers for the use of market-based mechanisms under the Convention is explained further in relation to Table 4.5. Information for the years of 2010–2012 is not reported here, since they are not relevant for the Kyoto Protocol’s second commitment period and thus the Norwegian 2020 target.
Within the format of CTF table 4, it is not technically possible to present information on the issuance of AAUs. This is an essential aspect of the Kyoto Protocol, and a supplementary table is therefore necessary. Table 4.3 shows information for the period 2013–2020.
Table A3-10 (CTF table 4). Reporting on progressa
Total emissions excluding LULUCF (1) | Contribution from LULUCFd (2) | Quantity of units from market based mechanisms under the Convention | Quantity of units from other market based mechanisms | |||
|---|---|---|---|---|---|---|
Yearc | (kt CO2 eq) | (kt CO2 eq) | (number of units) | (kt CO2 eq) | (number of units) | (kt CO2 eq) |
Base year/period (1990) | 51 192.77* | NA | NA | NA | NA | NA |
2010 | NA | NA | NA | NA | NA | NA |
2011 | NA | NA | NA | NA | NA | NA |
2012 | NA | NA | NA | NA | NA | NA |
2013 | 53 671.56 | -94.89 | 9 962 919 | 9 963 | NA | NA |
2014 | 54 040.58 | -76.42 | 10 350 409 | 10 350 | NA | NA |
2015 | 54 488.25 | 406.35 | 11 280 852 | 11 281 | NA | NA |
2016 | 53 585.78 | 55.09 | 10 027 120 | 10 027 | NA | NA |
2017 | 52 840.35 | 76.99 | 9 303 592 | 9 304 | NA | NA |
2018 | 52 871.07 | 253.61 | 9 510 929 | 9 511 | NA | NA |
2019 | 51 086.03 | 216.96 | 7 689 242 | 7 689 | NA | NA |
2020 | 49 272.55 | -294.44 | 5 364 364 | 5 364 | NA | NA |
Abbreviation: GHG = greenhouse gas, LULUCF = land use, land-use change and forestry.
*1990 value as determined through the review of the initial report.
a For the base year, information reported on the emission reduction target shall include the following: (a) total GHG emissions, excluding emissions and removals from the LULUCF sector; (b) emissions and/or removals from the LULUCF sector based on the accounting approach applied taking into consideration any relevant decisions of the Conference of the Parties and the activities and/or land that will be accounted for; (c) total GHG emissions, including emissions and removals from the LULUCF sector. For each reported year, information reported on progress made towards the emission reduction targets shall include, in addition to the information noted in paragraphs 9(a–c) of the UNFCCC biennial reporting guidelines for developed country Parties, information on the use of units from market-based mechanisms.
Table A3-11 Achieving the commitment under the Kyoto Protocol’s second commitment period (mill. tonnes CO2 equivalents)
Year | GHG emissions excluding LULUCF a) (Mt CO2 eq) | Contribution of LULUCF b) (Mt CO2 eq) | Use of units from market-based mechanisms c) (Mt CO2 eq) | GHG emissions including LULUCF and marked-based mechanisms (Mt CO2 eq) |
|---|---|---|---|---|
1990 | 51.92 | NA | NA | NA |
2013 | 53.67 | -0.09 | 9.96 | 43.61 |
2014 | 54.04 | -0.08 | 10.35 | 43.61 |
2015 | 54.49 | 0.41 | 11.28 | 43.61 |
2016 | 53.59 | 0.06 | 10.03 | 43.61 |
2017 | 52.84 | 0.08 | 9.30 | 43.61 |
2018 | 52.87 | 0.25 | 9.51 | 43.61 |
2019 | 51.09 | 0.22 | 7.69 | 43.61 |
2020 | 49.27 | -0.29 | 5.36 | 43.61 |
Cumulative 2013–2020 | 421.86 | 0.54 | 73.49 | 348.91 |
Assigned amount units (emissions budget) 2013–2020 (Mt CO2 equivalents) | 348.91 | |||
Notes
a) 1990 value as determined through the review of the initial report.
b) For LULUCF, a positive number here means net emissions and a negative number means net removals.
c) Units have not actually been used (retired) in 2013–2020, but will be used when accounting for the target under the Kyoto Protocol.
Norway issued a total of 348.9 million assigned amount units (AAUs) for the period 2013–2020, or on average 43.61 million AAUs annually. The number of issued AAUs was determined through the review process of Norway’s initial report for the second commitment period.
The role of LULUCF
Pursuant to the accounting approach under the Kyoto Protocol, Norway uses an activity-based approach for the LULUCF sector through 2020. Norway accounts for all the activities under Article 3.3, and for forest management, cropland management and grazing land management activities under Article 3.4 at the end of the commitment period. Norway thus chose to account for the entire commitment period. CTF table 4(a)II is imported from the accounting table in the Common Reporting Format (CRF) table and is reported as part of the CTF tables. Table 4.4 below displays the contributions from the LULUCF sector as reported in CTF table 4(a)II and in tables 4.2 and 4.3 above.
Table A3-12 Contribution from the LULUCF (mill. tonnes CO2 equivalents)
Art. 3.3 AR | Art. 3.3 D | Art. 3.3 total | Art. 3.4 FM | Art. 3.4 CM | Art. 3.4 GL | Art. 3.4 total | Art. 3.3 and 3.4 total | |
|---|---|---|---|---|---|---|---|---|
2013 | -0.95 | 2.59 | 1.64 | -1.82 | -0.02 | 0.11 | -1.73 | -0.09 |
2014 | -0.98 | 2.64 | 1.66 | -1.82 | -0.02 | 0.11 | -1.73 | -0.08 |
2015 | -1.01 | 3.14 | 2.13 | -1.82 | -0.02 | 0.11 | -1.72 | 0.41 |
2016 | -1.07 | 2.85 | 1.78 | -1.82 | -0.03 | 0.12 | -1.73 | 0.06 |
2017 | -1.07 | 2.89 | 1.82 | -1.82 | -0.04 | 0.11 | -1.74 | 0.08 |
2018 | -1.08 | 3.08 | 2.00 | -1.82 | -0.05 | 0.12 | -1.74 | 0.25 |
2019 | -1.09 | 3.05 | 1.96 | -1.82 | -0.05 | 0.12 | -1.74 | 0.22 |
2020 | -1.11 | 2.58 | 1.46 | -1.82 | -0.05 | 0.11 | -1.76 | -0.29 |
Total | -8.38 | 22.82 | 14.44 | -14.54 | -0.28 | 0.92 | -13.90 | 0.54 |
Source: Norwegian Institute of Bioeconomy Research (NIBIO)
For LULUCF, a positive number here means net emissions and a negative number means net removals.
The emissions from deforestation (D) under Article 3.3 for the period 2013–2020 were about 22,8 mill tonnes CO2 equivalents and were higher than the removals of about 8.4 million tonnes CO2 equivalents from afforestation and reforestation (AR) under Article 3.3 in the same period. Activities under Article 3.3 therefore represent net emissions of about 14.4 million tonnes CO2 equivalents for the period 2013–2020. The removals that can be accounted105 from forest management (FM) is about 14.5 million tonnes CO2 equivalents for the period 2013–2020. Cropland management (CM) resulted in net removals of about 0.3 million tonnes CO2 equivalents as the reported emissions in the years 2013–2020 were lower than the base year value for the activity. Grazing land management (GM) results in net emissions of about 0.9 million tonnes CO2 equivalents as the reported removals in the years 2013–2020 were higher than the base year value for the activity. Article 3.4 activities resulted in removals of about 13,9 million tonnes CO2 equivalents As seen from table 4.4, activities under Article 3.3 and the volume that can be accounted for under 3.4 resulted in a figure showing net emissions of about 0.5 million tonnes CO2 for the period 2013–2020. This LULUCF figure will be used in the accounting for achieving Norway’s target.
CTF table 4(a)I is not relevant for Norway since an activity-based approach is used.
Market-based mechanisms under the Convention
Table 4.2 shows that Norway’s emissions for the period 2013–2020, including contributions from activities under Article 3.3 and 3.4, exceed the issuance of AAUs. Norway will therefore use the market-based mechanisms. The net contribution of units through the Kyoto mechanisms to comply with the commitment will be about 73.5 million tonnes for the whole 2013–2020 period.
Within the framework of the Kyoto Protocol, Norway has long experience of using flexibility mechanisms. The major pillar is cooperation with the European Union on International Emissions Trading to reflect underlying participation in the European Emissions Trading system. For 2013–2020 Norway also pursued project-based cooperation in developing countries under the Clean Development Mechanism (CDM) to ensure compliance with the commitments and thus the 2020 target. Since climate change is a global problem, it does not matter whether emissions are reduced in Norway or in other countries. What matters is the overall reduction in global emissions. By using these international mechanisms, Norway has been able to assume targets that are more ambitious than if it had to do all reductions domestically and so far more than met its commitments under the Kyoto Protocol.
The basis for the flow of Kyoto units between EU and Norway is the European registry regulation. For stationary installations in the EU ETS, the number of AAUs transferred from Europe to Norway for the period 2013–2020 was about 54.8 million units. An additional 3.1 million AAUs were acquired based on Norwegian companies’ participation in the aviation ETS. In total, the participation in the EU ETS resulted in a transfer of about 57.9 million AAUs from the EU to Norway. This leaves a volume of about 15.1 mill units to be covered from other acquisitions.
The Norwegian Carbon Credit Procurement Program was set up in 2007 to ensure that Norway would be able to meet its target in the first commitment period of the Kyoto Protocol (2008–2012) and eventually overachievement of 10 percentage points. The responsibility for the program was initially assigned to the Ministry of Finance, but was transferred to the Ministry of Climate and Environment on 1 January 2014. In the second commitment period, the Ministry has had a mandate to procure CERs from new, not yet commissioned, projects and from vulnerable projects. Vulnerable projects are registered and commissioned projects that are either stranded or on the verge of shutting down due to the lack of revenues from the sales of emissions reductions. Norway has also, in line with restrictions in the EU ETS, refrained from purchasing units from so-called industrial HFC projects. Furthermore, Norway has had a policy to refrain from purchasing units from coal-based energy production without carbon capture and storage. A small part of the portfolio is procured from the UN Adaptation Fund. The remaining volume contracted was contracted directly from the Ministry of Climate and Environment.
The procurement programme for Kyoto units for the second commitment period was early on authorized to acquire up to 60 million CERs under the CDM for the period 2013–2020. For details see www.carbonneutralnorway.no. Norway has had a contract volume close to 60 Mt under the procurement program. Of these 60 million CERs, some 29 Mt were contracted through the Nordic Environment Facility Cooperation (NEFCO) However, the actual volume delivered is significantly lower. The amount delivered as of 2022 was about 46 million units, including carry-over of 3 million. By the end of 2022, around 23 Mt were delivered through NEFCO. In addition, the use of CERs and ERUs by the ETS installations in 2013 and 2014 has resulted in another 6 million units that have been swapped with AAUs. Consequently, Norway has acquired more than enough units to cover its commitments under the Kyoto Protocol and thus meet the 2020 target.
In CTF Table 4(b), Parties are asked to report on the amounts of units surrendered that have not been previously surrendered by that or any other Party. For this BR5, the years to be reported are 2019 and 2020. Norway’s accounting for the whole 2013–2020 period is likely to be finalized in 2023 following ia. completion of the review process. Consequently, no units have so far been surrendered pursuant to our commitment under the Kyoto Protocol. In table 4.5 (CTF Table 4b) Norway has therefore chosen to present estimates for the net use of units from the Kyoto mechanisms for 2019 and 2020 consistent with tables 4.3 and 4.4. A split between AAUs and CERs for individual years within the commitment period has not been carried out as Norway will account for the whole period 2013–2020. The total number of units from the various Kyoto Protocol mechanisms are reported in CTF table 2 (e)I.
The additional period for fulfilling commitments for the second commitment period (the true-up period) is foreseen to occur in 2023. During this true-up period, Norway will transfer a sufficient number of units to the retirement account to meet the commitment. Norway already has more than sufficient number of units in its registry and this will be shown through the reporting of the Standard Electronic Format (SEF) tables in April 2023. Upon expiration of the true-up period, Norway will provide a report containing the information required to be reported upon the expiration of the additional period and this report will then undergo a review.
Box 10.1 Projects for KP2 compliance under the Norwegian Carbon Credit Programme
Destruction of methane from landfill gas projects constitute more than half of the KP2 portfolio. Small scale programmes, like cook stoves and water purification, is the second largest group. The majority of the small-scale programmes are located in Africa, whereas the majority of the landfill projects are located in Latin America, especially in Brazil. Altogether, the Norwegian procurement program is involved in 62 projects in 25 countries (bilaterally and through carbon funds).
A vulnerable project is defined as at risk of closing down due to the lack of revenues to cover operational cost. With the help of revenues from Norway’s purchase of emission reductions (CERs) the project has been upgraded from a flaring only project (left picture) to a project generating electricity from 21 generators with a total installed capacity of 29.4 MW. The project is expected to deliver more than 6 mill. CERs to Norway.
UN 0171 Caieiras landfill gas emission reduction project (Sao Paulo area):
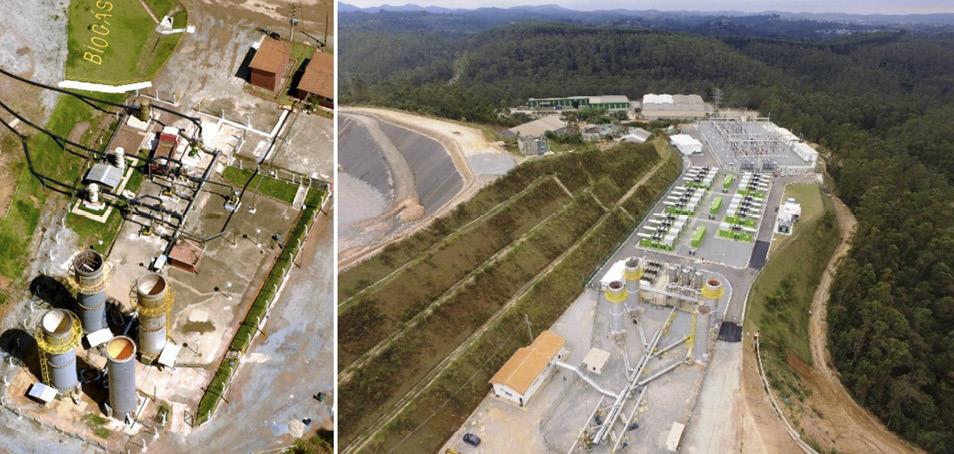
UN 7997 Improved cook stove programme (Kenya, Uganda and India):
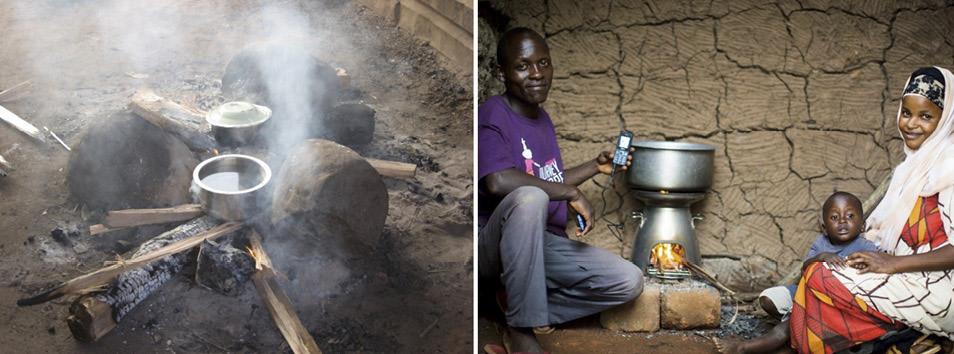
A relatively advanced cook stove where the heat from the flame is converted into electricity through a thermoelectric generator. This electricity powers an internal fan, which force-feeds oxygen into the flame, eliminating the smoke, and leading to the near complete and clean combustion of the fuel. The stove generates surplus electricity – enough to charge a mobile phone and provide an evening’s worth of LED light. Compared to a traditional “three stone” stove (left picture) this cook stove reduces the use of firewood by 50 per cent. This is the basis for crediting of emission reductions. Important co-benefits include the reduction of smoke by 90 per cent (particular matters and carbon monoxide), health benefits and reduced deforestation. The programme is expected to deliver up to 1.75 mill emissions reductions (CERs) to Norway.
Table A3-13 (CTF table 4(b)). Reporting on progress. a, b, c
Units of market based mechanisms | Year | |||
|---|---|---|---|---|
2019 | 2020 | |||
Kyoto Protocol unitsd | Kyoto Protocol units | (number of units) | 7 689 242 | 5 364 364 |
(kt CO2 equivalents) | 7 689 | 5 364 | ||
AAUs | (number of units) | NE | NE | |
(kt CO2 equivalents) | NE | NE | ||
ERUs | (number of units) | NE | NE | |
(kt CO2 equivalents) | NE | NE | ||
CERs | (number of units) | NE | NE | |
(kt CO2 equivalents) | NE | NE | ||
tCERs | (number of units) | NE | NE | |
(kt CO2 equivalents) | NE | NE | ||
lCERs | (number of units) | NE | NE | |
(kt CO2 equivalents) | NE | NE | ||
Other units d | Units from market-based mechanisms under the Convention | (number of units) | NA | NA |
(kt CO2 equivalents) | NA | NA | ||
(number of units) | NA | NA | ||
(kt CO2 equivalents) | NA | N | ||
Units from other market-based mechanisms | (number of units) | NA | NA | |
(kt CO2 equivalents) | NA | NA | ||
(number of units) | NA | NA | ||
(kt CO2 equivalents) | NA | NA | ||
Total | (number of units) | 7 689 242 | 5 364 364 | |
(kt CO2 equivalents) | 7 689 | 5 364 | ||
Abbreviations: AAUs = assigned amount units, CERs = certified emission reductions, ERUs = emission reduction units, lCERs = long-term certified emission reductions, tCERs = temporary certified emission reductions.
a Reporting by a developed country Party on the information specified in the common tabular format does not prejudge the position of other Parties with regard to the treatment of units from market-based mechanisms under the Convention or other market-based mechanisms towards achievement of quantified economy-wide emission reduction targets.
b For each reported year, information reported on progress made towards the emission reduction target shall include, in addition to the information noted in paragraphs 9(a-c) of the reporting guidelines, on the use of units from market-based mechanisms.
c Parties may include this information, as appropriate and if relevant to their target.
d Units surrendered by that Party for that year that have not been previously surrendered by that or any other Party.
5 Projections
5.1 Introduction
Since the fourth Biennial Report (BR4) was reported, new projections have been prepared for the years 2025, 2030 and 2035. In line with the UNFCCC reporting guidelines for National Communications and Biennial Report, it is a “with measures” (WEM) projection, based on policies and measures implemented as of midyear 2022. The WEM projections are shown in figure 4.1. The projections, methodologies and assumptions for the projections, changes since the previously reported projections are presented in detail in chapter of Norway’s eighth National Communication (NC8). Since the BR and NC overlap, only a brief summary is presented in this chapter.
Greenhouse gas emissions are estimated to decline from 49.1 million tonnes CO2 equivalents in 2021 to 33.8 million tonnes in 2035. Emissions will in such case be close to 15 million tonnes of CO2 equivalents lower in 2035 than in 2021. A little more than half of the reduction is expected to occur in the ESR sectors. About half of this reduction is expected within road traffic – mostly due to a strong increase in the share of zero-emission vehicles.
New projections of removals and emissions from the LULUCF sector were published by the Norwegian Institute of Bioeconomy Research (NIBIO) in October 2022. The projections cover removals and emissions of all greenhouse gases in the LULUCF sector from 2021 to 2100 based on the Climate Convention and the LULUCF regulation under the EU climate and energy 2030 framework, respectively. The projections show that the total sink is expected to be reduced in the period 2021–2030. The projections indicate that the carbon sink capacity of the current forest stock has reached a peak. This is primarily due to a skewed age class structure of the Norwegian forest with 43 per cent mature stands. Due to ageing forests and higher harvesting rates, the annual increment and removals will inevitably decline between 2030 and 2050.
Table 10.3
Table A3-14 CTF Table 6(a): Information on updated greenhouse gas projections.
GHG emissions and removalsb | GHG emission projections | |||||||||||
|---|---|---|---|---|---|---|---|---|---|---|---|---|
(kt CO2 equivalents) | (kt CO2 equivalents) | |||||||||||
Base year (1990) | 1990 | 1995 | 2000 | 2005 | 2010 | 2015 | 2019 | 2020 | 2025 | 2030 | 2035 | |
Sectord,e | ||||||||||||
Energy | 18 785 | 18 785 | 21 142 | 23 098 | 23 912 | 25 647 | 24 648 | 23 203 | 22 258 | 19 778 | 15 937 | 13 438 |
Transport | 10 056 | 10 056 | 10 999 | 11 951 | 12 998 | 14 041 | 14 343 | 12 724 | 11 929 | 10 628 | 8 591 | 6 735 |
Industry/industrial processes | 15 377 | 15 377 | 12 436 | 13 220 | 11 669 | 9 102 | 9 317 | 9 259 | 9 224 | 8 749 | 8 469 | 8 166 |
Agriculture | 4 812 | 4 812 | 4 749 | 4 586 | 4 569 | 4 361 | 4 538 | 4 518 | 4 510 | 4 599 | 4 711 | 4 733 |
Forestry/LULUCF | -10 542 | -10 542 | -15 444 | -18 641 | -20 329 | -23 716 | -13 101 | -16 436 | -20 332 | -15 876 | -16 540 | -13 605 |
Waste management/waste | 2 403 | 2 403 | 2 306 | 2 066 | 1 797 | 1 788 | 1 642 | 1 382 | 1 351 | 1 005 | 865 | 758 |
Other (specify) | ||||||||||||
Gas | ||||||||||||
CO2 emissions including net CO2 from LULUCF | 24 148 | 24 148 | 22 655 | 23 085 | 22 585 | 21 536 | 32 049 | 25 903 | 20 418 | 20 829 | 14 344 | 12 777 |
CO2 emissions excluding net CO2 from LULUCF | 35 097 | 35 097 | 38 508 | 42 149 | 43 342 | 45 691 | 45 590 | 42 785 | 41 197 | 37 111 | 31 294 | 26 805 |
CH4 emissions including CH4 from LULUCF | 6 405 | 6 405 | 6 588 | 6 351 | 5 919 | 5 757 | 5 403 | 4 922 | 4 899 | 4 622 | 4 440 | 4 266 |
CH4 emissions excluding CH4 from LULUCF | 6 236 | 6 236 | 6 420 | 6 176 | 5 741 | 5 576 | 5 219 | 4 735 | 4 712 | 4 452 | 4 271 | 4 091 |
N2O emissions including N2O from LULUCF | 4 343 | 4 343 | 3 952 | 4 067 | 4 312 | 2 729 | 2 759 | 2 648 | 2 579 | 2 610 | 2 636 | 2 639 |
N2O emissions excluding N2O from LULUCF | 4 106 | 4 106 | 3 712 | 3 819 | 4 062 | 2 471 | 2 502 | 2 390 | 2 319 | 2 373 | 2 395 | 2 391 |
HFCs | 0 | 0 | 98 | 369 | 549 | 894 | 963 | 934 | 810 | 587 | 364 | 329 |
PFCs | 3 895 | 3 895 | 2 314 | 1 518 | 955 | 238 | 146 | 175 | 161 | 173 | 175 | 173 |
SF6 | 2 099 | 2 099 | 580 | 891 | 297 | 69 | 68 | 68 | 74 | 63 | 74 | 42 |
NF3 | ||||||||||||
Other (specify) | ||||||||||||
Total with LULUCFf | 40 890 | 40 890 | 36 188 | 36 281 | 34 616 | 31 223 | 41 387 | 34 650 | 28 940 | 28 883 | 22 032 | 20 225 |
Total without LULUCF | 51 432 | 51 432 | 51 631 | 54 922 | 54 945 | 54 939 | 54 488 | 51 086 | 49 273 | 44 759 | 38 572 | 33 830 |
Sources: Statistics Norway, Norwegian Environment Agency, NIBIO and Ministry of Finance.
Note that the table above is consistent with the projections table in chapter 5 of the National Communication. The actual CTF-table 6a does only allow projections for the year 2030 and the numbers reported for 2020 in CTF table 6a and in the table above are historical values. For full set of footnotes, see below CTF table 5. Also note that indirect CO2 emissions are included in the historical GHG emissions and in the GHG emission projections.
Table A3-15 Greenhouse gas emissions in Norway by EU-ETS and ESR. Million tonnes CO2 equivalents.
1990 | 2005 | 2021 | 2025 | 2030 | 2035 | |
|---|---|---|---|---|---|---|
GHG emissions in Norway | 51.4 | 54.9 | 49.1 | 44.8 | 38.6 | 33.8 |
EU-ETS emissions | 23.2 | 27.7 | 23.8 | 22.2 | 19.0 | 16.6 |
– Oil and gas extraction | 7.2 | 12.9 | 11.5 | 10.8 | 8.0 | 6.3 |
– Manufacturing industries and mining | 15.3 | 13.7 | 10.7 | 10.2 | 9.8 | 9.1 |
– Other sources1 | 0.7 | 1.1 | 1.5 | 1.2 | 1.2 | 1.2 |
ESR emissions | 28.2 | 27.2 | 25.4 | 22.6 | 19.5 | 17.2 |
– Transport2 | 12.0 | 15.0 | 15.4 | 13.5 | 10.9 | 8.9 |
Of this. road traffic | 7.4 | 9.5 | 8.7 | 7.1 | 5.3 | 3.9 |
– Agriculture | 4.8 | 4.6 | 4.6 | 4.6 | 4.7 | 4.7 |
– Other sources3 | 11.4 | 7.6 | 5.4 | 4.8 | 3.9 | 3.6 |
LULUCF | -10.5 | -20.3 | -14.0 | -15.9 | -16.5 | -13.6 |
Emissions including LULUCF | 40.9 | 34.6 | 35.1 | 28.9 | 22.1 | 20.2 |
Mainland Norway | 43.2 | 40.9 | 37.0 | 33.3 | 30.0 | 27.1 |
1 Includes ETS emissions from energy supply and aviation.
2 Includes non-ETS emissions from road transport, navigation, fishing, non-ETS aviation, motor equipment etc.
3 Includes non-ETS emissions from manufacturing industries, oil and gas extraction and energy supply, and emissions form heating and other sources.
Sources: Statistics Norway, Norwegian Environment Agency, NIBIO and Ministry of Finance.
The projections of emissions (not for LULUCF) use Statistics Norway’s general equilibrium model SNOW and table 5.3 lists the key macroeconomic projections underpinning the Norwegian emission projections. Table 5.5 and chapter 5.1.5 in the NC8 summarises the historic and projected emissions of fuel sold to ships and aircraft engaged in international transport. These emissions are reported separately and are not included in previous totals.
For the methods and assumptions for the projections of the LULUCF sector, see chapter 5.4 of the NC8.
Table A3-16 (CTF Table 5). Summary of key variables and assumptions used in the projections analysis a
Key underlying assumptions | Historicalb | Projected | |||||||||
|---|---|---|---|---|---|---|---|---|---|---|---|
Assumption | Unit | 1990 | 1995 | 2000 | 2005 | 2010 | 2015 | 2020 | 2025 | 2030 | 2035 |
Gross domestic product | billion NOK. Fixed 2015-prices | 1 701.4 | 2 044.2 | 2 442.3 | 2 723.0 | 2 855.6 | 3 111.2 | 3 254.3 | 3 682.7 | 3 885.1 | 4 059.5 |
Of which mainland Norway | billion NOK. Fixed 2015-prices | 1 303.0 | 1 492.9 | 1 790.4 | 2 059.7 | 2 331.9 | 2 614.1 | 2 740.5 | 3 101.9 | 3 399.2 | 3 661.1 |
Of which petroleum activities and ocean transport | Billion NOK. Fixed 2015-prices | 398.3 | 551.3 | 651.9 | 663.4 | 523.7 | 497.1 | 513.8 | 580.8 | 485.9 | 398.4 |
Consumption | billion NOK. Fixed 2015-prices | 609.2 | 697.5 | 849.8 | 1 016.3 | 1 186.0 | 1 354.3 | 1 343.3 | 1 568.5 | 1 756.7 | 1 970.4 |
Gross fixed capital formation | billion NOK. Fixed 2015-prices | 329.6 | 368.1 | 477.0 | 585.0 | 630.2 | 741.5 | 835.6 | 898.5 | 961.7 | 1 031.0 |
Of which mainland Norway | billion NOK. Fixed 2015-prices | 235.0 | 262.5 | 349.9 | 441.1 | 464.7 | 540.7 | 655.0 | 728.1 | 817.1 | 833.1 |
Of which petroluem activities and ocean transport | billion NOK. Fixed 2015-prices | 94.6 | 105.5 | 127.1 | 143.9 | 165.6 | 200.8 | 180.6 | 170.4 | 144.6 | 197.8 |
Population | Thousands | 4 249.8 | 4 370.0 | 4 503.4 | 4 640.2 | 4 920.3 | 5 214.0 | 5 391.4 | 5 559.8 | 5 685.5 | 5 803.5 |
Number of persons employed | Thousands | 2 047.8 | 2 112.4 | 2 314.9 | 2 319.3 | 2 552.3 | 2 709.6 | 2 792.4 | 2 949.2 | 2 994.9 | 3 003.1 |
Oil price * | USD per barrel | 23.7 | 17.0 | 26.2 | 55.1 | 80.3 | 53.4 | 43.4 | |||
Gas price | USD per MMBtu | 2.3 | 2.3 | 3.0 | 5.1 | 6.9 | 6.3 | 3.0 | |||
Sources: Statistics Norway and Ministry of Finance.
For the full set of footnotes, see below CTF table 5.
Custom footnote. Prices for oil and gas for 2025, 2030 and 2035 are equal to those used in National budget 2023. But since these assumptions are not published in the budget proposal it is not appropriate to publish them here either.
6 Provision of financial, technological and capacity-building support to developing country parties
6.1 Introduction
The impacts of climate change are increasingly visible and felt around the world, especially in developing countries who are the most severely affected and the least equipped to respond to its consequences. The poorest and most vulnerable communities are experiencing the effects of climate change through extreme weather events such as floods, drought, hurricanes and sea level rise. Climate change has the potential to reverse significant development gains made in developing countries. Norway recognises the critical need for support to developing countries with respect to both climate mitigation and adaptation. In the period 2019–2020 Norway has continued to provide a wide range of financial, technological, and capacity-building support to developing country Parties in order to build their capacity to reduce carbon emissions and to support adaptation to take action against the negative effects of climate change.
Table 10.4 Table A3-17 Provision of public financial support, 2019–2020.
2019 | 2020 | |||
|---|---|---|---|---|
Type of assistance | NOK mill | USD mill | NOK mill | USD mill |
Earmarked contributions | ||||
Adaptation only | 464 | 53 | 626 | 67 |
Mitigation only | 4 205 | 478 | 3 513 | 373 |
Cross-cutting | 453 | 51 | 468 | 50 |
Total earmarked contributions | 5 122 | 582 | 4 607 | 489 |
Imputed multilateral contributions | 1 337 | 152 | 2 039 | 217 |
Total | 6 459 | 734 | 6 646 | 706 |
Table A3-17 presents total figures of Norwegian public climate finance. The Norwegian public climate finance amounted to USD 734 million (NOK 6 459 million) in 2019 and USD 706 million (NOK 6 646 million) in 2020.
The majority of Norwegian climate finance is earmarked support, including bilateral contributions and earmarked contributions through multilateral institutions. The earmarked contributions amounted to USD 582 million (NOK 5 122 million) in 2019 and USD 489 million (NOK 4 607 million) in 2020. The estimated climate specific share of core support to multilateral organisations (imputed multilateral core contributions) amounted to USD 152 million (NOK 1 337 million) and USD 217 million (NOK 2 039 million) in 2019 and 2020, respectively.
The earmarked contributions targeting climate change are separated into three categories: adaptation (only), mitigation (only) and cross-cutting (both adaptation and mitigation). In 2020, USD 67 million (NOK 626 million) was targeting climate change adaptation only (14 per cent of total earmarked support), USD 373 million (NOK 3 513 million) targeting climate change mitigation only (76 per cent of total earmarked support), and USD 50 million (NOK 468 million) was cross-cutting support (10 per cent of total earmarked support).
In addition to the public climate financing, these interventions mobilised private climate relevant investments in developing countries. The private finance mobilised amounted to USD 16 million (NOK 145 million) in 2019 and USD 33 million (NOK 313 million) in 2020.
Table A3-18 (CTF table 7). Provision of public financial support: summary information in 2019.
Allocation channels | 2019 | ||||||||||
|---|---|---|---|---|---|---|---|---|---|---|---|
Norwegian krone – NOK | USD | ||||||||||
Core/general | Climate-specific | Core/general | Climate-specific | ||||||||
Mitigation | Adaptation | Cross-cutting | Other | Mitigation | Adaptation | Cross-cutting | Other | ||||
Total contributions through multilateral channels: | 1 336 682 352,02 | 151 919 890,89 | |||||||||
Multilateral climate change funds | 609 829 338,80 | 69 309 815,06 | |||||||||
Other multilateral climate change funds | 32 711 438,80 | 3 717 800,42 | |||||||||
Multilateral financial institutions, including regional development banks | 647 089 865,97 | 73 544 639,60 | |||||||||
Specialised United Nations bodies | 79 763 147,25 | 9 065 436,23 | |||||||||
Total contributions through bilateral, regional and other channels | 4 205 445 674,32 | 464 034 043,06 | 452 616 194,54 | 477 967 594,20 | 52 739 531,64 | 51 441 842,40 | |||||
Total | 4 205 445 674,32 | 464 034 043,06 | 452 616 194,54 | 1 336 682 352,02 | 477 967 594,20 | 52 739 531,64 | 51 441 842,40 | 151 919 890,89 | |||
Table 10.5
Table A3-19 (CTF table 7). Provision of public financial support: summary information in 2020.
Allocation channels | 2020 | ||||||||||
|---|---|---|---|---|---|---|---|---|---|---|---|
Norwegian krone – NOK | USD | ||||||||||
Core/ general | Climate-specific | Core/ general | Climate-specific | ||||||||
Mitigation | Adaptation | Cross-cutting | Other | Mitigation | Adaptation | Cross-cutting | Other | ||||
Total contributions through multilateral channels: | 2 039 302 466,66 | 216 642 849,05 | |||||||||
Multilateral climate change funds | 1 187 376 171,58 | 126 139 481,96 | |||||||||
Other multilateral climate change funds | 28 417 971,58 | 3 018 949,09 | |||||||||
Multilateral financial institutions, including regional development banks | 796 646 055,62 | 84 630 737,22 | |||||||||
Specialised United Nations bodies | 55 280 239,46 | 5 872 629,87 | |||||||||
Total contributions through bilateral, regional and other channels | 3 513 000 570,15 | 626 078 852,43 | 468 014 627,46 | 373 199 397,67 | 66 510 735,18 | 49 718 972,02 | |||||
Total | 3 513 000 570,15 | 626 078 852,43 | 468 014 627,46 | 2 039 302 466,66 | 373 199 397,67 | 66 510 735,18 | 49 718 972,02 | 216 642 849,05 | |||
6.2 National approach to tracking and reporting provision of support
6.2.1 Measuring public climate finance
The monitoring of Norwegian development finance targeting the objectives of the United Nations framework convention for climate change (UNFCCC) is based on the OECD Development Assistance Committee’s (DAC) reporting system (CRS). We use DAC purpose codes for sector classifications. Norwegian development climate finance includes climate-related official development assistance (ODA) and other official flows (OOF).
The OOF activities are interventions by Norfund providing equity, loans and guarantees to companies operating in challenging markets in developing countries. Norfund’s outflows are reported to the OECD DAC as OOF to avoid double counting as the funding that Norfund receives through the State budget is reported as ODA, in accordance with the institutional approach for ODA reporting of private sector instruments.
The tracking of Norwegian development finance targeting climate change is separated into earmarked contributions and imputed multilateral core contributions. Below, we describe these methodologies as well as the tracking of private climate finance mobilised by official development interventions.
The amounts reported are gross disbursements during the year reported for, meaning that inflows (e.g. repayments, sales) are not reported as negative disbursements. These negative disbursements amounted to USD 16.5 million in 2019 and USD 22.9 million in 2020. The amounts are reported in NOK and USD based on average exchange rates (NOK-USD): 2019: 8.7986 and 2020: 9.4132.
Earmarked contributions
Earmarked contributions are support through bilateral and multilateral channels. Norway monitors earmarked climate specific activities using the OECD DAC Rio Markers Climate change adaptation and Climate change mitigation. The Rio Markers identify development activities targeting climate change (adaptation and/or mitigation), and whether targeting climate change is a principal or significant objective.
Contributions to activities targeting climate change as a principal objective are reported as 100 per cent climate finance, and the full amount disbursed counted. As a conservative estimate, and in line with other major donors, 40 per cent of the support to activities with a significant climate change objective is reported as climate finance. Contributions to cross-cutting activities targeting both climate change adaptation and mitigation are reported as 40 per cent climate finance if neither adaptation nor mitigation are principal project objectives. Consequently, the earmarked contributions targeting climate change objectives are approximations.
All earmarked climate financing is reported in table A3-22 and A3-23, including earmarked contributions through multilateral institutions. The earmarked contributions through multilateral institutions are included in Table A3-22 and A3-23 (instead of Table A3-20 and A3-21) for transparency, as these contributions can be disaggregated by region/country and/or sector.
In table A3-22 and A3-23, we report aggregates by the type of support (adaptation/mitigation/cross-cutting) for each recipient country/region to limit the table sizes printed in the report. The information on financial instruments is grouped into grants and PSI (a group of different types of private sector instruments). However, in the online CTF submission we report granular information for each in activity (including financial instrument), and we include the OECD CRS ID in the Additional information column to ensure full transparency on the connection between each development finance intervention reported to the OECD DAC and the reported public climate finance.
Norwegian climate-specific ODA to Ukraine is excluded from the reporting as Ukraine is an Annex 1 country.
When referring to support for specific programmes, partners and activities (outside the standardised tables), the amounts are total disbursements regardless of climate relevance (if not specified).
Imputed multilateral core contributions
We report estimates of Norwegian climate specific core contributions to multilateral institutions. These estimates – imputed climate-specific multilateral ODA – are calculated and published by the OECD. This methodology makes it possible to impute multilateral aid outflows targeting climate change back to the donors of multilateral core contributions. By using this methodology, only the estimated climate-specific shares of multilateral core contributions are reported as climate finance.
The OECD methodology for calculating imputed multilateral core support for climate change is a two-step procedure: 1) The percentage of each multilateral agency’s total annual commitments to climate change objectives is calculated. This calculation is carried out only in respect of agencies’ commitments of grants or concessional (ODA) loans from core resources only. 2) The calculated climate specific percentage is applied to the donor’s core contribution in the same year to organization to estimate the imputed climate specific core contribution.
The imputed multilateral core contributions targeting climate change are not disaggregated by the type of support: adaptation, mitigation and cross-cutting. Therefore, the imputed multilateral core contributions are reported as Type of support = Other in Table A3-18 and A3-19. In table A3-20 and A3-21, these estimates are included in the column climate-specific, not in column core/general, as the estimate includes only the climate specific share of core contributions.
Imputed multilateral core support is not calculated for all multilateral institutions receiving core support, but for about 20 multilateral institutions per year. These agencies account for around 90 per cent of donor countries’ multilateral core contributions. Core contributions to other multilateral institutions are not included in the reporting as there are no official climate shares available.
Private sector mobilisation
The OECD DAC is modernizing its statistical framework to better reflect the current development co-operation landscape in support of the 2030 agenda, including climate action. Over the last years, the OECD DAC has been working to establish an international standard for measuring resources mobilised from the private sector by official development finance interventions. Methodologies have been developed for a broad range of instruments: guarantees, syndicated loans, equity shares in collective investment vehicles, direct investment in companies, credit lines, simple co-financing arrangements and project finance schemes. The data collection is implemented on the activity level.
The methodologies follow several principles underpinning an international statistical system. In order to be realistic, feasible and to avoid double-counting, they strive to be conservative in terms of causality, fair in terms of attribution and pragmatic in terms of the point of measurement and data availability. The term “mobilisation” in this context refers to the direct mobilisation effect of official development finance interventions.
This OECD reporting framework is consistent with the outcome agreed by all countries of the UNFCCC COP 24 as regards the modalities for the accounting of financial resources provided and mobilised through public intervention.
6.2.2 New and additional finance
The overall objective of Norwegian development cooperation is to fight poverty, save lives and alleviate suffering, in accordance with the humanitarian imperative. The strong inter-linkages between climate change and development have been emphasised.
Norwegian total ODA has exceeded 0.7 per cent of Gross National Income (GNI) for many years, and oscillated around 1 per cent. All our climate finance from the ODA budget can be counted beyond the 0.7 per cent threshold. Moreover, Norway has steadily increased the volume of its ODA budget, as the economy has been growing.
6.3 Core contributions to multilateral institutions
Table A3-20 and A3-21 provides OECD estimates of Norwegian climate specific core contributions to multilateral institutions, in total USD 152 million (NOK 1 337 million) in in 2019 and USD 217 million (NOK 2 039 million) in 2020.
As described in methodology section 6.2.1, the imputed climate-specific core contributions reported does not give the total overview of Norwegian climate-specific core funding, as there are multilateral institutions where the climate-specific share of the core contributions is unknown. Examples of such multilateral institutions receiving core contributions from Norway are CGIAR (NOK 230 million in core contributions in 2019–2020), UNEP (NOK 27 million in core contributions in 2019–2020) and UNDP (NOK 1 110 million in core contributions in 2019–2020). Core contributions to these multilateral institutions are not included as climate financing. In table A3-20 and A3-21, we have included the World Bank Group in the predefined category World bank, except for the IFC reported in the predefined category IFC.
Table A3-22 and A3-23 provides a summary of public earmarked climate finance, in total NOK 5 112 million in 2019 and NOK 4 607 million in 2020. The methodology section 6.2.1 describes in detail the figures reported.
Table A3-20 (CTF table 7(a)). Provision of public financial support: contribution through multilateral channels in 2019.
Donor funding | Total amount | Status | Funding source | Financial instrument | Type of support | Sector | |||
|---|---|---|---|---|---|---|---|---|---|
Core/general | Climate-specific | ||||||||
Norwegian krone – NOK | USD | Norwegian krone – NOK | USD | ||||||
Total contributions through multilateral channels | 1 336 682 352,02 | 151 919 890,89 | |||||||
Multilateral climate change funds | 609 829 338,80 | 69 309 815,06 | |||||||
1. Global Environment Facility | 108 293 900,00 | 12 308 083,10 | Disbursed | ODA | Grant | Other | Not applicable | ||
2. Least Developed Countries Fund | |||||||||
3. Special Climate Change Fund | |||||||||
4. Adaptation Fund | 90 000 000,00 | 10 228 900,05 | Disbursed | ODA | Grant | Other | Not applicable | ||
5. Green Climate Fund | 378 824 000,00 | 43 055 031,48 | Disbursed | ODA | Grant | Other | Not applicable | ||
6. UNFCCC Trust Fund for Supplementary Activities | |||||||||
7. Other multilateral climate change funds | 32 711 438,80 | 3 717 800,42 | |||||||
SCF – Strategic Climate Fund | |||||||||
GGGI – Global Green Growth Institute | 14 516 902,80 | 1 649 910,53 | Disbursed | ODA | Grant | Other | Not applicable | ||
Multilateral Fund for the Implementation of the Montreal Protocol | 18 194 536,00 | 2 067 889,89 | Disbursed | ODA | Grant | Other | Not applicable | ||
Multilateral financial institutions, including regional development banks | 647 089 865,97 | 73 544 639,60 | |||||||
1. World Bank | 354 002 720,00 | 40 233 982,68 | Disbursed | ODA | Grant | Other | Not applicable | ||
2. International Finance Corporation | |||||||||
3. African Development Bank | 552 759,50 | 62 823,57 | Disbursed | ODA | Grant | Other | Not applicable | ||
4. Asian Development Bank | |||||||||
5. European Bank for Reconstruction and Development | |||||||||
6. Inter-American Development Bank | |||||||||
7. Other | 292 534 386,47 | 33 247 833,34 | |||||||
AFDF – African Development Fund | 231 036 560,69 | 26 258 332,09 | Disbursed | ODA | Grant | Other | Not applicable | ||
AIIB – Asian Infrastructure Investment Bank | 58 098 870,38 | 6 603 194,87 | Disbursed | ODA | Grant | Other | Not applicable | ||
IDB Invest | 3 398 955,40 | 386 306,39 | Disbursed | ODA | Grant | Other | Not applicable | ||
Specialised United Nations bodies | 79 763 147,25 | 9 065 436,23 | |||||||
1. United Nations Development Program | |||||||||
2. United Nations Environment Program | |||||||||
3. Other | 79 763 147,25 | 9 065 436,23 | |||||||
IFAD – International Fund for Agricultural Development | 44 295 600,00 | 5 034 391,84 | Disbursed | ODA | Grant | Other | Not applicable | ||
FAO – Food and Agriculture Organization | 19 267 547,25 | 2 189 842,39 | Disbursed | ODA | Grant | Other | Not applicable | ||
UNFCCC – United Nations Framework Convention on Climate Change | 16 200 000,00 | 1 841 202,01 | Disbursed | ODA | Grant | Other | Not applicable | ||
IPCC – Intergovernmental Panel on Climate Change | |||||||||
Table 10.6
Table A3-21 (CTF table 7(a)). Provision of public financial support: contribution through multilateral channels in 2020.
Donor funding | Total amount | Status | Funding source | Financial instrument | Type of support | Sector | |||
|---|---|---|---|---|---|---|---|---|---|
Core/general | Climate-specific | ||||||||
Norwegian krone – NOK | USD | Norwegian krone – NOK | USD | ||||||
Total contributions through multilateral channels | 2 039 302 466,66 | 216 642 849,05 | |||||||
Multilateral climate change funds | 1 187 376 171,58 | 126 139 481,96 | |||||||
1. Global Environment Facility | 108 958 200,00 | 11 575 043,56 | Disbursed | ODA | Grant | Other | Not applicable | ||
2. Least Developed Countries Fund | |||||||||
3. Special Climate Change Fund | |||||||||
4. Adaptation Fund | 50 000 000,00 | 5 311 689,97 | Disbursed | ODA | Grant | Other | Not applicable | ||
5. Green Climate Fund | 1 000 000 000,00 | 106 233 799,35 | Disbursed | ODA | Grant | Other | Not applicable | ||
6. UNFCCC Trust Fund for Supplementary Activities | |||||||||
7. Other multilateral climate change funds | 28 417 971,58 | 3 018 949,09 | |||||||
SCF – Strategic Climate Fund | |||||||||
GGGI – Global Green Growth Institute | 9 865 472,70 | 1 048 046,65 | Disbursed | ODA | Grant | Other | Not applicable | ||
Multilateral Fund for the Implementation of the Montreal Protocol | 18 552 498,88 | 1 970 902,44 | Disbursed | ODA | Grant | Other | Not applicable | ||
Multilateral financial institutions, including regional development banks | 796 646 055,62 | 84 630 737,22 | |||||||
1. World Bank | 450 968 810,60 | 47 908 130,14 | Disbursed | ODA | Grant | Other | Not applicable | ||
2. International Finance Corporation | 19 090 560,00 | 2 028 062,72 | Disbursed | ODA | Grant | Other | Not applicable | ||
3. African Development Bank | 31 614 682,33 | 3 358 547,82 | Disbursed | ODA | Grant | Other | Not applicable | ||
4. Asian Development Bank | |||||||||
5. European Bank for Reconstruction and Development | |||||||||
6. Inter-American Development Bank | |||||||||
7. Other | 294 972 002,69 | 31 335 996,55 | |||||||
AFDF – African Development Fund | 254 741 196,10 | 27 062 125,11 | Disbursed | ODA | Grant | Other | Not applicable | ||
AIIB – Asian Infrastructure Investment Bank | 35 337 840,66 | 3 754 073,07 | Disbursed | ODA | Grant | Other | Not applicable | ||
IDB Invest | 4 892 965,93 | 519 798,36 | Disbursed | ODA | Grant | Other | Not applicable | ||
Specialised United Nations bodies | 55 280 239,46 | 5 872 629,87 | |||||||
1. United Nations Development Program | |||||||||
2. United Nations Environment Program | |||||||||
3. Other | 55 280 239,46 | 5 872 629,87 | |||||||
IFAD – International Fund for Agricultural Development | 43 714 800,00 | 4 643 989,29 | Disbursed | ODA | Grant | Other | Not applicable | ||
FAO – Food and Agriculture Organization | |||||||||
UNFCCC – United Nations Framework Convention on Climate Change | 11 065 439,46 | 1 175 523,68 | Disbursed | ODA | Grant | Other | Not applicable | ||
IPCC – Intergovernmental Panel on Climate Change | 500 000,00 | 53 116,90 | Disbursed | ODA | Grant | Other | Not applicable | ||
6.4 Earmarked contributions
Table A3-22 and A3-23 provide a summary of public earmarked climate finance, in total USD 582 million in (NOK 5 122 million) 2019 and USD 489 million (NOK 4 607 million) in 2020. The methodology section 6.2.1 describes the methodology and figures included in the tables.
Table A3-22 (CTF table 7(b)). Provision of public financial support: contribution through bilateral, regional and other channels in 2019.
Recipient country/region | Total amount (NOK) | Status | Funding source | Financial instrument | Type of support | Sector | |
|---|---|---|---|---|---|---|---|
Climate-specific | |||||||
Norwegian krone | USD | ||||||
Total | 5 122 095 911,92 | 582 148 968,24 | |||||
Angola | 3 323 250,00 | 377 702,13 | Disbursed | ODA | Grants | Adaptation | 140 – Water and sanitation (1.02 NOK mill.); 151 – Government and civil society, general (0.64 NOK mill.); 430 – Other multisector (1.66 NOK mill.) |
Angola | 644 007,60 | 73 194,33 | Disbursed | ODA | Grants | Mitigation | 231 – Energy Policy |
Burundi | 2 402 753,96 | 273 083,67 | Disbursed | ODA | Grants | Adaptation | 311 – Agriculture (2.3 NOK mill.); 321 – Industry (0.11 NOK mill.) |
Burundi | 1 604 999,97 | 182 415,38 | Disbursed | ODA | Grants | Cross-cutting | 311 – Agriculture |
Cameroon | 1 123 333,20 | 127 671,81 | Disbursed | ODA | Grants | Mitigation | 410 – General environmental protection |
Cameroon | 566 024,67 | 64 331,22 | Disbursed | ODA | Grants | Cross-cutting | 151 – Government and civil society, general (0.12 NOK mill.); 410 – General environmental protection (0.45 NOK mill.) |
Congo, Dem. Rep. | 3 895 331,00 | 442 721,68 | Disbursed | ODA | Grants | Adaptation | 114 – Post-secondary education (1.03 NOK mill.); 311 – Agriculture (0.6 NOK mill.); 430 – Other multisector (2.26 NOK mill.) |
Congo, Dem. Rep. | 27 347 681,66 | 3 108 185,58 | Disbursed | ODA | Grants | Mitigation | 151 – Government and civil society, general (3.68 NOK mill.); 312 – Forestry (5.14 NOK mill.); 410 – General environmental protection (18.53 NOK mill.) |
Congo, Dem. Rep. | 885 046,00 | 100 589,41 | Disbursed | ODA | Grants | Cross-cutting | 410 – General environmental protection |
Congo, Rep. | 840 000,00 | 95 469,73 | Disbursed | ODA | Grants | Mitigation | 410 – General environmental protection |
Egypt | 22 901 628,00 | 2 602 871,82 | Disbursed | OOF | PSI | Mitigation | 232 – Energy generation, renewable sources |
Ethiopia | 99 866 038,64 | 11 350 219,20 | Disbursed | ODA | Grants | Adaptation | 112 – Basic education (0.77 NOK mill.); 114 – Post-secondary education (0.29 NOK mill.); 140 – Water and sanitation (3.66 NOK mill.); 151 – Government and civil society, general (0.12 NOK mill.); 240 – Banking and financial services (3.59 NOK mill.); 311 – Agriculture (6.77 NOK mill.); 410 – General environmental protection (0.25 NOK mill.); 430 – Other multisector (84.41 NOK mill.) |
Ethiopia | 215 386 654,60 | 24 479 650,69 | Disbursed | ODA | Grants | Mitigation | 231 – Energy Policy (0.02 NOK mill.); 410 – General environmental protection (215.37 NOK mill.) |
Ethiopia | 51 583 911,94 | 5 862 740,88 | Disbursed | ODA | Grants | Cross-cutting | 114 – Post-secondary education (4.17 NOK mill.); 410 – General environmental protection (31.97 NOK mill.); 430 – Other multisector (15.44 NOK mill.) |
Gabon | 763 333,20 | 86 756,21 | Disbursed | ODA | Grants | Mitigation | 410 – General environmental protection |
Ghana | 2 455 706,40 | 279 101,95 | Disbursed | ODA | Grants | Mitigation | 151 – Government and civil society, general (0.32 NOK mill.); 410 – General environmental protection (2.14 NOK mill.) |
Ghana | 114 279,60 | 12 988,38 | Disbursed | ODA | Grants | Cross-cutting | 321 – Industry |
Kenya | 6 691 861,20 | 760 559,77 | Disbursed | ODA | Grants | Adaptation | 311 – Agriculture (0.01 NOK mill.); 313 – Fishing (3.59 NOK mill.); 410 – General environmental protection (3.09 NOK mill.) |
Kenya | 92 950 289,60 | 10 564 213,58 | Disbursed | ODA (2.85 NOK mill.); OOF (90.1 NOK mill.) | Grants (2.85 NOK mill.); PSI (90.1 NOK mill.) | Mitigation | 140 – Water and sanitation (0.22 NOK mill.); 232 – Energy generation, renewable sources (90.1 NOK mill.); 321 – Industry (2.62 NOK mill.) |
Kenya | 3 008 841,52 | 341 968,21 | Disbursed | ODA | Grants | Cross-cutting | 311 – Agriculture |
Liberia | 468 552,42 | 53 253,07 | Disbursed | ODA | Grants | Adaptation | 111 – Education, level unspecified |
Liberia | 12 666 720,11 | 1 439 629,04 | Disbursed | ODA | Grants | Mitigation | 232 – Energy generation, renewable sources (0.44 NOK mill.); 410 – General environmental protection (12.23 NOK mill.) |
Madagascar | 637 825,20 | 72 491,67 | Disbursed | ODA | Grants | Adaptation | 311 – Agriculture (0.03 NOK mill.); 313 – Fishing (0.61 NOK mill.) |
Madagascar | 222 374,00 | 25 273,79 | Disbursed | ODA | Grants | Mitigation | 140 – Water and sanitation |
Madagascar | 6 070 177,03 | 689 902,60 | Disbursed | ODA | Grants | Cross-cutting | 311 – Agriculture (0.41 NOK mill.); 410 – General environmental protection (5.66 NOK mill.) |
Malawi | 9 468 024,15 | 1 076 083,03 | Disbursed | ODA | Grants | Adaptation | 111 – Education, level unspecified (0.24 NOK mill.); 311 – Agriculture (4.5 NOK mill.); 430 – Other multisector (4.73 NOK mill.) |
Malawi | 3 035 660,00 | 345 016,25 | Disbursed | ODA | Grants | Mitigation | 232 – Energy generation, renewable sources (1.12 NOK mill.); 311 – Agriculture (1.92 NOK mill.) |
Malawi | 16 475 274,85 | 1 872 488,22 | Disbursed | ODA | Grants | Cross-cutting | 311 – Agriculture |
Mali | 30 148 187,26 | 3 426 475,49 | Disbursed | ODA | Grants | Adaptation | 151 – Government and civil society, general (1.42 NOK mill.); 311 – Agriculture (26.59 NOK mill.); 410 – General environmental protection (2.14 NOK mill.) |
Mali | 684 478,80 | 77 794,06 | Disbursed | ODA | Grants | Mitigation | 232 – Energy generation, renewable sources |
Mali | 30 000 000,00 | 3 409 633,35 | Disbursed | ODA | Grants | Cross-cutting | 430 – Other multisector |
Mozambique | 26 817 988,78 | 3 047 983,63 | Disbursed | ODA | Grants | Adaptation | 160 – Other social infrastructure and services (19 NOK mill.); 311 – Agriculture (7.19 NOK mill.); 430 – Other multisector (0.63 NOK mill.) |
Mozambique | 23 186 994,60 | 2 635 305,00 | Disbursed | ODA | Grants | Mitigation | 231 – Energy Policy (22.33 NOK mill.); 321 – Industry (0.86 NOK mill.) |
Mozambique | 2 889 444,00 | 328 398,15 | Disbursed | ODA | Grants | Cross-cutting | 231 – Energy Policy |
Niger | 35 400 000,00 | 4 023 367,35 | Disbursed | ODA | Grants | Adaptation | 311 – Agriculture (14 NOK mill.); 430 – Other multisector (21.4 NOK mill.) |
Niger | 1 441 543,00 | 163 837,77 | Disbursed | ODA | Grants | Cross-cutting | 410 – General environmental protection |
Nigeria | 41 558 664,00 | 4 723 326,89 | Disbursed | OOF | PSI | Mitigation | 232 – Energy generation, renewable sources |
Nigeria | 22 296 502,00 | 2 534 096,56 | Disbursed | ODA | Grants | Cross-cutting | 231 – Energy Policy (1.3 NOK mill.); 311 – Agriculture (21 NOK mill.) |
Somalia | 13 999 980,66 | 1 591 160,03 | Disbursed | ODA | Grants | Adaptation | 140 – Water and sanitation (1 NOK mill.); 430 – Other multisector (9 NOK mill.); 720 – Emergency Response (4 NOK mill.) |
South Africa | 1 646 400,00 | 187 120,68 | Disbursed | ODA | Grants | Adaptation | 410 – General environmental protection |
South Africa | 35 505 771,00 | 4 035 388,70 | Disbursed | OOF | PSI | Mitigation | 232 – Energy generation, renewable sources |
South Sudan | 2 662 916,40 | 302 652,29 | Disbursed | ODA | Grants | Mitigation | 114 – Post-secondary education |
Sudan | 520 000,00 | 59 100,31 | Disbursed | ODA | Grants | Adaptation | 152 – Conflict prevention and resolution, peace and security |
Sudan | 1 605 000,00 | 182 415,38 | Disbursed | ODA | Grants | Mitigation | 140 – Water and sanitation |
Tanzania | 14 028 270,93 | 1 594 375,35 | Disbursed | ODA | Grants | Adaptation | 114 – Post-secondary education (2.64 NOK mill.); 311 – Agriculture (8.01 NOK mill.); 410 – General environmental protection (3.38 NOK mill.) |
Tanzania | 5 021 333,13 | 570 696,83 | Disbursed | ODA | Grants | Mitigation | 232 – Energy generation, renewable sources (4.61 NOK mill.); 410 – General environmental protection (0.41 NOK mill.) |
Tanzania | 7 676 135,90 | 872 426,97 | Disbursed | ODA | Grants | Cross-cutting | 311 – Agriculture (6.82 NOK mill.); 410 – General environmental protection (0.86 NOK mill.) |
Togo | 2 189 053,00 | 248 795,60 | Disbursed | ODA | Grants | Cross-cutting | 231 – Energy Policy |
Uganda | 3 549 489,20 | 403 415,23 | Disbursed | ODA | Grants | Adaptation | 114 – Post-secondary education (2.82 NOK mill.); 311 – Agriculture (0.73 NOK mill.) |
Uganda | 38 828 065,44 | 4 412 982,23 | Disbursed | ODA | Grants | Mitigation | 151 – Government and civil society, general (16 NOK mill.); 231 – Energy Policy (7.21 NOK mill.); 232 – Energy generation, renewable sources (8.36 NOK mill.); 236 – Heating, cooling and energy distribution (6.85 NOK mill.); 311 – Agriculture (0.18 NOK mill.); 410 – General environmental protection (0.23 NOK mill.) |
Uganda | 8 287 062,16 | 941 861,45 | Disbursed | ODA | Grants | Cross-cutting | 114 – Post-secondary education (4.86 NOK mill.); 311 – Agriculture (2.53 NOK mill.); 410 – General environmental protection (0.9 NOK mill.) |
Zambia | 511 584,60 | 58 143,86 | Disbursed | ODA | Grants | Adaptation | 311 – Agriculture (0.26 NOK mill.); 410 – General environmental protection (0.25 NOK mill.) |
Zambia | 3 478 241,60 | 395 317,62 | Disbursed | ODA (0.24 NOK mill.); OOF (3.24 NOK mill.) | Grants (0.24 NOK mill.); PSI (3.24 NOK mill.) | Mitigation | 232 – Energy generation, renewable sources (0.24 NOK mill.); 232 – Energy generation, renewable sources (3.24 NOK mill.) |
Zambia | 1 163 648,00 | 132 253,77 | Disbursed | ODA | Grants | Cross-cutting | 311 – Agriculture |
Zimbabwe | 683 072,40 | 77 634,21 | Disbursed | ODA | Grants | Cross-cutting | 311 – Agriculture |
Bolivia | 895 084,12 | 101 730,29 | Disbursed | ODA | Grants | Adaptation | 311 – Agriculture (0.63 NOK mill.); 410 – General environmental protection (0.26 NOK mill.) |
Brazil | 74 120 425,44 | 8 424 115,82 | Disbursed | ODA | Grants | Mitigation | 140 – Water and sanitation (0.28 NOK mill.); 151 – Government and civil society, general (7.23 NOK mill.); 410 – General environmental protection (66.61 NOK mill.) |
Brazil | 1 058 193,24 | 120 268,36 | Disbursed | ODA | Grants | Cross-cutting | 410 – General environmental protection |
Colombia | 226 026,00 | 25 688,86 | Disbursed | ODA | Grants | Adaptation | 313 – Fishing (0.08 NOK mill.); 410 – General environmental protection (0.1 NOK mill.); 430 – Other multisector (0.05 NOK mill.) |
Colombia | 221 382 797,83 | 25 161 139,02 | Disbursed | ODA | Grants | Mitigation | 410 – General environmental protection |
Colombia | 6 836 964,75 | 777 051,43 | Disbursed | ODA | Grants | Cross-cutting | 151 – Government and civil society, general (1.55 NOK mill.); 410 – General environmental protection (5.29 NOK mill.) |
Ecuador | 113 428 711,00 | 12 891 677,20 | Disbursed | ODA | Grants | Mitigation | 410 – General environmental protection |
Ecuador | 35 000,00 | 3 977,91 | Disbursed | ODA | Grants | Cross-cutting | 151 – Government and civil society, general |
Guatemala | 6 999 999,76 | 795 581,09 | Disbursed | ODA | Grants | Adaptation | 430 – Other multisector |
Guyana | 415 164 974,66 | 47 185 344,79 | Disbursed | ODA | Grants | Mitigation | 410 – General environmental protection |
Haiti | 1 006 010,00 | 114 337,51 | Disbursed | ODA | Grants | Adaptation | 140 – Water and sanitation |
Honduras | 133 155 449,00 | 15 133 708,66 | Disbursed | OOF | PSI | Mitigation | 232 – Energy generation, renewable sources |
Jamaica | 19 200,00 | 2 182,17 | Disbursed | ODA | Grants | Cross-cutting | 410 – General environmental protection |
Nicaragua | 1 018 432,00 | 115 749,32 | Disbursed | ODA | Grants | Adaptation | 113 – Secondary education |
Panama | 1 451 296,00 | 164 946,24 | Disbursed | OOF | PSI | Mitigation | 232 – Energy generation, renewable sources |
Paraguay | 232 000,00 | 26 367,83 | Disbursed | ODA | Grants | Mitigation | 151 – Government and civil society, general |
Peru | 55 271 189,56 | 6 281 816,38 | Disbursed | ODA | Grants | Mitigation | 151 – Government and civil society, general (6.33 NOK mill.); 410 – General environmental protection (48.94 NOK mill.) |
Peru | 9 000 000,00 | 1 022 890,01 | Disbursed | ODA | Grants | Cross-cutting | 410 – General environmental protection |
Afghanistan | 1 711 999,97 | 194 576,41 | Disbursed | ODA | Grants | Adaptation | 140 – Water and sanitation |
Afghanistan | 2 637 643,65 | 299 779,93 | Disbursed | ODA | Grants | Cross-cutting | 311 – Agriculture |
Bangladesh | 189 104,80 | 21 492,60 | Disbursed | ODA | Grants | Adaptation | 250 – Business and other services (0.18 NOK mill.); 311 – Agriculture (0.01 NOK mill.) |
Bangladesh | 211 201,20 | 24 003,95 | Disbursed | ODA | Grants | Mitigation | 122 – Basic health (0.15 NOK mill.); 311 – Agriculture (0.06 NOK mill.) |
Bangladesh | 96 774,40 | 10 998,84 | Disbursed | ODA | Grants | Cross-cutting | 112 – Basic education |
Cambodia | 761 209,64 | 86 514,86 | Disbursed | ODA | Grants | Adaptation | 140 – Water and sanitation (0.05 NOK mill.); 311 – Agriculture (0.64 NOK mill.); 430 – Other multisector (0.07 NOK mill.) |
Cambodia | 801 905,02 | 91 140,07 | Disbursed | ODA | Grants | Mitigation | 151 – Government and civil society, general (0.08 NOK mill.); 152 – Conflict prevention and resolution, peace and security (0.08 NOK mill.); 311 – Agriculture (0.46 NOK mill.); 410 – General environmental protection (0.19 NOK mill.) |
China | 1 923 142,80 | 218 573,73 | Disbursed | ODA | Grants | Adaptation | 313 – Fishing (0.81 NOK mill.); 410 – General environmental protection (1.11 NOK mill.) |
China | 29 015 582,88 | 3 297 749,97 | Disbursed | ODA | Grants | Mitigation | 160 – Other social infrastructure and services (0.92 NOK mill.); 231 – Energy Policy (0.2 NOK mill.); 250 – Business and other services (0.61 NOK mill.); 410 – General environmental protection (15.26 NOK mill.); 430 – Other multisector (12.02 NOK mill.) |
China | 2 062 960,00 | 234 464,57 | Disbursed | ODA | Grants | Cross-cutting | 410 – General environmental protection |
Georgia | 12 853 134,96 | 1 460 815,92 | Disbursed | ODA | Grants | Mitigation | 231 – Energy Policy (11 NOK mill.); 232 – Energy generation, renewable sources (1.85 NOK mill.) |
India | 6 216 895,45 | 706 577,80 | Disbursed | ODA | Grants | Adaptation | 250 – Business and other services (0.15 NOK mill.); 311 – Agriculture (0.08 NOK mill.); 410 – General environmental protection (5.8 NOK mill.); 430 – Other multisector (0.18 NOK mill.) |
India | 9 544 715,40 | 1 084 799,33 | Disbursed | ODA | Grants | Mitigation | 410 – General environmental protection |
India | 31 033 821,06 | 3 527 131,71 | Disbursed | ODA | Grants | Cross-cutting | 151 – Government and civil society, general (0.31 NOK mill.); 321 – Industry (0.71 NOK mill.); 410 – General environmental protection (1.02 NOK mill.); 430 – Other multisector (29 NOK mill.) |
Indonesia | 335 002 954,75 | 38 074 574,90 | Disbursed | ODA | Grants | Mitigation | 151 – Government and civil society, general (7.42 NOK mill.); 232 – Energy generation, renewable sources (0.68 NOK mill.); 410 – General environmental protection (326.91 NOK mill.) |
Indonesia | 7 546 472,80 | 857 690,18 | Disbursed | ODA | Grants | Cross-cutting | 410 – General environmental protection |
Laos | 943 402,00 | 107 221,83 | Disbursed | ODA (0.11 NOK mill.); OOF (0.83 NOK mill.) | Grants (0.11 NOK mill.); PSI (0.83 NOK mill.) | Mitigation | 232 – Energy generation, renewable sources (0.83 NOK mill.); 410 – General environmental protection (0.11 NOK mill.) |
Malaysia | 110 000,00 | 12 501,99 | Disbursed | ODA | Grants | Mitigation | 410 – General environmental protection |
Myanmar | 104 879,00 | 11 919,96 | Disbursed | ODA | Grants | Adaptation | 232 – Energy generation, renewable sources |
Myanmar | 31 809 918,86 | 3 615 338,67 | Disbursed | ODA (20.58 NOK mill.); OOF (11.23 NOK mill.) | Grants (20.58 NOK mill.); PSI (11.23 NOK mill.) | Mitigation | 151 – Government and civil society, general (0.71 NOK mill.); 231 – Energy Policy (6.01 NOK mill.); 232 – Energy generation, renewable sources (11.23 NOK mill.); 410 – General environmental protection (13.86 NOK mill.) |
Nepal | 9 841 855,29 | 1 118 570,60 | Disbursed | ODA | Grants | Adaptation | 114 – Post-secondary education (0.74 NOK mill.); 151 – Government and civil society, general (1.67 NOK mill.); 311 – Agriculture (0.82 NOK mill.); 430 – Other multisector (6.61 NOK mill.) |
Nepal | 28 335 883,20 | 3 220 499,08 | Disbursed | ODA | Grants | Mitigation | 231 – Energy Policy (7.2 NOK mill.); 232 – Energy generation, renewable sources (0.86 NOK mill.); 236 – Heating, cooling and energy distribution (20.28 NOK mill.) |
Pakistan | 1 230 499,98 | 139 851,79 | Disbursed | ODA | Grants | Adaptation | 140 – Water and sanitation |
Sri Lanka | 1 009 082,80 | 114 686,75 | Disbursed | ODA | Grants | Adaptation | 151 – Government and civil society, general (0.25 NOK mill.); 313 – Fishing (0.06 NOK mill.); 430 – Other multisector (0.7 NOK mill.) |
Sri Lanka | 1 978 917,28 | 224 912,75 | Disbursed | ODA | Grants | Mitigation | 231 – Energy Policy (1.18 NOK mill.); 232 – Energy generation, renewable sources (0.8 NOK mill.) |
Thailand | 106 666,80 | 12 123,16 | Disbursed | ODA | Grants | Mitigation | 410 – General environmental protection |
Viet Nam | 5 436 058,44 | 617 832,21 | Disbursed | ODA | Grants | Adaptation | 111 – Education, level unspecified (0.58 NOK mill.); 114 – Post-secondary education (2.25 NOK mill.); 410 – General environmental protection (2.6 NOK mill.) |
Viet Nam | 4 902 401,39 | 557 179,71 | Disbursed | ODA | Grants | Mitigation | 232 – Energy generation, renewable sources (0.68 NOK mill.); 240 – Banking and financial services (0.27 NOK mill.); 311 – Agriculture (0.8 NOK mill.); 410 – General environmental protection (3.16 NOK mill.) |
Global Unspecified | 110 454 989,25 | 12 553 700,50 | Disbursed | ODA | Grants | Adaptation | 140 – Water and sanitation (1.6 NOK mill.); 311 – Agriculture (15.2 NOK mill.); 313 – Fishing (12.54 NOK mill.); 410 – General environmental protection (20.4 NOK mill.); 430 – Other multisector (60.2 NOK mill.); 740 – Disaster prevention and preparedness (0.51 NOK mill.) |
Global Unspecified | 1 547 763 469,24 | 175 910 198,13 | Disbursed | ODA (1340.66 NOK mill.); OOF (207.1 NOK mill.) | Grants (1340.66 NOK mill.); PSI (207.1 NOK mill.) | Mitigation | 140 – Water and sanitation (0.11 NOK mill.); 151 – Government and civil society, general (27.64 NOK mill.); 231 – Energy Policy (272.76 NOK mill.); 231 – Energy Policy (37.93 NOK mill.); 232 – Energy generation, renewable sources (70.75 NOK mill.); 232 – Energy generation, renewable sources (169.17 NOK mill.); 321 – Industry (0.56 NOK mill.); 322 – Mineral resources/ mining (0.01 NOK mill.); 410 – General environmental protection (964.63 NOK mill.); 430 – Other multisector (1.6 NOK mill.); 998 – Unallocated/unspecified (2.6 NOK mill.) |
Global Unspecified | 219 031 531,87 | 24 893 907,20 | Disbursed | ODA | Grants | Cross-cutting | 112 – Basic education (0.56 NOK mill.); 151 – Government and civil society, general (2.89 NOK mill.); 312 – Forestry (0.58 NOK mill.); 410 – General environmental protection (214.79 NOK mill.); 720 – Emergency Response (0.21 NOK mill.) |
Papua New Guinea | 9 608 000,00 | 1 091 991,91 | Disbursed | ODA | Grants | Mitigation | 151 – Government and civil society, general (4.38 NOK mill.); 410 – General environmental protection (5.22 NOK mill.) |
Jordan | 1 449 000,00 | 164 685,29 | Disbursed | ODA | Grants | Mitigation | 410 – General environmental protection |
Lebanon | 1 520 000,00 | 172 754,76 | Disbursed | ODA | Grants | Mitigation | 313 – Fishing |
Palestine | 8 000 000,00 | 909 235,56 | Disbursed | ODA | Grants | Mitigation | 232 – Energy generation, renewable sources |
Africa Regional | 26 150 000,00 | 2 972 063,74 | Disbursed | ODA | Grants | Adaptation | 111 – Education, level unspecified (1.55 NOK mill.); 430 – Other multisector (24.6 NOK mill.) |
Africa Regional | 64 505 319,00 | 7 331 316,23 | Disbursed | ODA (62 NOK mill.); OOF (2.51 NOK mill.) | Grants (62 NOK mill.); PSI (2.51 NOK mill.) | Mitigation | 232 – Energy generation, renewable sources (62 NOK mill.); 232 – Energy generation, renewable sources (2.51 NOK mill.) |
Eastern Africa, regional | 1 488 000,00 | 169 117,81 | Disbursed | ODA | Grants | Adaptation | 311 – Agriculture |
Eastern Africa, regional | 44 000 000,00 | 5 000 795,58 | Disbursed | ODA | Grants | Mitigation | 236 – Heating, cooling and energy distribution |
Middle Africa regional | 400 000 000,00 | 45 461 778,01 | Disbursed | ODA | Grants | Mitigation | 410 – General environmental protection |
South of Sahara Regional | 12 628 595,76 | 1 435 296,04 | Disbursed | ODA | Grants | Adaptation | 430 – Other multisector (4.63 NOK mill.); 740 – Disaster prevention and preparedness (8 NOK mill.) |
South of Sahara Regional | 45 447 776,00 | 5 165 341,76 | Disbursed | ODA (0.55 NOK mill.); OOF (44.9 NOK mill.) | Grants (0.55 NOK mill.); PSI (44.9 NOK mill.) | Mitigation | 231 – Energy Policy (10.92 NOK mill.); 232 – Energy generation, renewable sources (0.55 NOK mill.); 232 – Energy generation, renewable sources (31.49 NOK mill.); 250 – Business and other services (2.49 NOK mill.) |
South of Sahara Regional | 1 743 269,06 | 198 130,28 | Disbursed | ODA | Grants | Cross-cutting | 311 – Agriculture |
Western Africa regional | 7 416 667,00 | 842 937,17 | Disbursed | ODA | Grants | Mitigation | 311 – Agriculture (7 NOK mill.); 410 – General environmental protection (0.42 NOK mill.) |
America Regional | 1 690 576,00 | 192 141,48 | Disbursed | ODA | Grants | Mitigation | 410 – General environmental protection |
America Regional | 110 000,00 | 12 501,99 | Disbursed | ODA | Grants | Cross-cutting | 410 – General environmental protection |
Caribbean & Central America, regional | 10 000 000,00 | 1 136 544,45 | Disbursed | ODA | Grants | Adaptation | 740 – Disaster prevention and preparedness |
Caribbean & Central America, regional | 3 662 802,00 | 416 293,73 | Disbursed | OOF | PSI | Mitigation | 232 – Energy generation, renewable sources |
South America Regional | 15 559 527,70 | 1 768 409,49 | Disbursed | ODA | Grants | Mitigation | 410 – General environmental protection |
Asia Regional | 11 366 640,00 | 1 291 869,16 | Disbursed | ODA | Grants | Adaptation | 430 – Other multisector |
Asia Regional | 40 777 015,00 | 4 634 489,01 | Disbursed | ODA | Grants | Mitigation | 231 – Energy Policy (0.81 NOK mill.); 232 – Energy generation, renewable sources (30 NOK mill.); 410 – General environmental protection (9.96 NOK mill.) |
Asia Regional | 10 136 941,27 | 1 152 108,43 | Disbursed | ODA | Grants | Cross-cutting | 410 – General environmental protection |
Central Asia Regional | 3 800 000,00 | 431 886,89 | Disbursed | ODA | Grants | Cross-cutting | 160 – Other social infrastructure and services |
Far East Asia Regional | 5 310 395,84 | 603 550,09 | Disbursed | ODA | Grants | Mitigation | 151 – Government and civil society, general |
South Asia Regional | 532 406,40 | 60 510,35 | Disbursed | ODA | Grants | Cross-cutting | 410 – General environmental protection |
Europe Regional | 1 042 746,00 | 118 512,72 | Disbursed | ODA | Grants | Mitigation | 151 – Government and civil society, general |
Oceania Regional | 5 000 000,00 | 568 272,23 | Disbursed | ODA | Grants | Mitigation | 231 – Energy Policy |
Table 10.7 Table A3-23 (CTF table 7(b)). Provision of public financial support: contribution through bilateral, regional and other channels in 2020.
Recipient country/region | Total amount (NOK) | Status | Funding source | Financial instrument | Type of support | Sector | |
|---|---|---|---|---|---|---|---|
Climate-specific | |||||||
Norwegian krone | USD | ||||||
Total | 4 607 094 050,04 | 489 429 104,88 | |||||
Angola | 4 012 500,00 | 426 263,12 | Disbursed | ODA | Grants | Adaptation | 410 – General environmental protection |
Angola | 132 252,80 | 14 049,72 | Disbursed | ODA | Grants | Mitigation | 231 – Energy Policy |
Cameroon | 594 921,25 | 63 200,74 | Disbursed | ODA | Grants | Mitigation | 410 – General environmental protection |
Cameroon | 522 118,48 | 55 466,63 | Disbursed | ODA | Grants | Cross-cutting | 151 – Government and civil society, general (0.11 NOK mill.); 410 – General environmental protection (0.41 NOK mill.) |
Congo, Dem. Rep. | 7 524 946,52 | 799 403,66 | Disbursed | ODA | Grants | Adaptation | 114 – Post-secondary education (0.71 NOK mill.); 140 – Water and sanitation (4 NOK mill.); 311 – Agriculture (0.54 NOK mill.); 430 – Other multisector (2.28 NOK mill.) |
Congo, Dem. Rep. | 22 098 786,44 | 2 347 638,04 | Disbursed | ODA | Grants | Mitigation | 151 – Government and civil society, general (2.88 NOK mill.); 312 – Forestry (4.86 NOK mill.); 410 – General environmental protection (14.36 NOK mill.) |
Congo, Dem. Rep. | 938 969,49 | 99 750,30 | Disbursed | ODA | Grants | Cross-cutting | 410 – General environmental protection |
Congo, Rep. | 1 055 998,76 | 112 182,76 | Disbursed | ODA | Grants | Mitigation | 410 – General environmental protection |
Egypt | 924 151,00 | 98 176,07 | Disbursed | OOF | PSI | Mitigation | 232 – Energy generation, renewable sources |
Ethiopia | 116 293 217,94 | 12 354 270,38 | Disbursed | ODA | Grants | Adaptation | 112 – Basic education (1.64 NOK mill.); 114 – Post-secondary education (0.81 NOK mill.); 140 – Water and sanitation (0.18 NOK mill.); 151 – Government and civil society, general (0.11 NOK mill.); 240 – Banking and financial services (3.56 NOK mill.); 311 – Agriculture (10.73 NOK mill.); 410 – General environmental protection (0.22 NOK mill.); 430 – Other multisector (99.06 NOK mill.) |
Ethiopia | 171 412 563,00 | 18 209 807,82 | Disbursed | ODA | Grants | Mitigation | 410 – General environmental protection |
Ethiopia | 51 854 953,73 | 5 508 748,75 | Disbursed | ODA | Grants | Cross-cutting | 114 – Post-secondary education (3 NOK mill.); 410 – General environmental protection (37.61 NOK mill.); 430 – Other multisector (11.24 NOK mill.) |
Gabon | 659 895,12 | 70 103,17 | Disbursed | ODA | Grants | Mitigation | 410 – General environmental protection |
Ghana | 1 265 909,60 | 134 482,39 | Disbursed | ODA | Grants | Mitigation | 410 – General environmental protection |
Ghana | 354 252,00 | 37 633,54 | Disbursed | ODA | Grants | Cross-cutting | 321 – Industry |
Kenya | 4 130 817,73 | 438 832,46 | Disbursed | ODA | Grants | Adaptation | 313 – Fishing (1.04 NOK mill.); 410 – General environmental protection (3.09 NOK mill.) |
Kenya | 54 341 441,60 | 5 772 897,80 | Disbursed | ODA (0.89 NOK mill.); OOF (53.46 NOK mill.) | Grants (0.89 NOK mill.); PSI (53.46 NOK mill.) | Mitigation | 232 – Energy generation, renewable sources (53.46 NOK mill.); 321 – Industry (0.89 NOK mill.) |
Kenya | 3 056 352,16 | 324 687,90 | Disbursed | ODA | Grants | Cross-cutting | 311 – Agriculture (2.73 NOK mill.); 410 – General environmental protection (0.33 NOK mill.) |
Liberia | 115 091 257,78 | 12 226 581,59 | Disbursed | ODA | Grants | Mitigation | 232 – Energy generation, renewable sources (0.56 NOK mill.); 410 – General environmental protection (114.53 NOK mill.) |
Madagascar | 1 462 863,60 | 155 405,56 | Disbursed | ODA | Grants | Adaptation | 313 – Fishing |
Madagascar | 5 840 517,20 | 620 460,33 | Disbursed | ODA | Grants | Cross-cutting | 311 – Agriculture (0.31 NOK mill.); 410 – General environmental protection (5.53 NOK mill.) |
Malawi | 31 609 693,61 | 3 358 017,85 | Disbursed | ODA | Grants | Adaptation | 311 – Agriculture (18.9 NOK mill.); 430 – Other multisector (12.71 NOK mill.) |
Malawi | 4 175 032,00 | 443 529,51 | Disbursed | ODA | Grants | Mitigation | 232 – Energy generation, renewable sources (0.58 NOK mill.); 311 – Agriculture (3.6 NOK mill.) |
Mali | 28 592 845,02 | 3 037 526,56 | Disbursed | ODA | Grants | Adaptation | 311 – Agriculture (26.07 NOK mill.); 410 – General environmental protection (2.52 NOK mill.) |
Mali | 939 273,60 | 99 782,60 | Disbursed | ODA | Grants | Mitigation | 232 – Energy generation, renewable sources |
Mali | 7 312 317,00 | 776 815,22 | Disbursed | ODA | Grants | Cross-cutting | 430 – Other multisector |
Mozambique | 28 405 434,01 | 3 017 617,18 | Disbursed | ODA | Grants | Adaptation | 151 – Government and civil society, general (3.87 NOK mill.); 311 – Agriculture (13.91 NOK mill.); 430 – Other multisector (10.62 NOK mill.) |
Mozambique | 3 236 923,60 | 343 870,69 | Disbursed | ODA | Grants | Mitigation | 231 – Energy Policy (1.91 NOK mill.); 321 – Industry (1.1 NOK mill.); 410 – General environmental protection (0.23 NOK mill.) |
Mozambique | 2 940 511,54 | 312 381,71 | Disbursed | ODA | Grants | Cross-cutting | 231 – Energy Policy |
Niger | 42 934 792,80 | 4 561 126,16 | Disbursed | ODA | Grants | Adaptation | 151 – Government and civil society, general (5.93 NOK mill.); 311 – Agriculture (14 NOK mill.); 430 – Other multisector (23 NOK mill.) |
Niger | 1 365 474,42 | 145 059,54 | Disbursed | ODA | Grants | Cross-cutting | 410 – General environmental protection |
Nigeria | 8 837 850,00 | 938 878,38 | Disbursed | OOF | PSI | Mitigation | 232 – Energy generation, renewable sources |
Nigeria | 22 279 374,80 | 2 366 822,63 | Disbursed | ODA | Grants | Cross-cutting | 231 – Energy Policy (1.28 NOK mill.); 311 – Agriculture (21 NOK mill.) |
Somalia | 11 266 597,93 | 1 196 893,50 | Disbursed | ODA | Grants | Adaptation | 140 – Water and sanitation (2.6 NOK mill.); 430 – Other multisector (8.66 NOK mill.) |
South Africa | 612 280,00 | 65 044,83 | Disbursed | ODA | Grants | Adaptation | 410 – General environmental protection |
South Africa | 18 491 132,00 | 1 964 383,21 | Disbursed | OOF | PSI | Mitigation | 232 – Energy generation, renewable sources |
South Sudan | 12 000 000,00 | 1 274 805,59 | Disbursed | ODA | Grants | Adaptation | 311 – Agriculture |
South Sudan | 320 875,60 | 34 087,83 | Disbursed | ODA | Grants | Mitigation | 114 – Post-secondary education |
Tanzania | 11 781 647,80 | 1 251 609,21 | Disbursed | ODA | Grants | Adaptation | 114 – Post-secondary education (0.36 NOK mill.); 311 – Agriculture (9.42 NOK mill.); 410 – General environmental protection (2 NOK mill.) |
Tanzania | 1 647 408,28 | 175 010,44 | Disbursed | ODA | Grants | Mitigation | 232 – Energy generation, renewable sources |
Tanzania | 9 400 150,14 | 998 613,66 | Disbursed | ODA | Grants | Cross-cutting | 240 – Banking and financial services (0.07 NOK mill.); 311 – Agriculture (3.97 NOK mill.); 312 – Forestry (0.31 NOK mill.); 410 – General environmental protection (5.05 NOK mill.) |
Togo | 2 155 113,66 | 228 945,91 | Disbursed | ODA | Grants | Cross-cutting | 231 – Energy Policy |
Uganda | 9 354 787,40 | 993 794,61 | Disbursed | ODA | Grants | Adaptation | 114 – Post-secondary education (0.63 NOK mill.); 151 – Government and civil society, general (8 NOK mill.); 311 – Agriculture (0.72 NOK mill.) |
Uganda | 12 249 533,20 | 1 301 314,45 | Disbursed | ODA | Grants | Mitigation | 231 – Energy Policy (7.21 NOK mill.); 232 – Energy generation, renewable sources (4.02 NOK mill.); 236 – Heating, cooling and energy distribution (0.74 NOK mill.); 410 – General environmental protection (0.27 NOK mill.) |
Uganda | 9 182 444,03 | 975 485,92 | Disbursed | ODA | Grants | Cross-cutting | 114 – Post-secondary education (5.19 NOK mill.); 311 – Agriculture (2.83 NOK mill.); 410 – General environmental protection (1.16 NOK mill.) |
Zambia | 818 880,00 | 86 992,73 | Disbursed | ODA | Grants | Adaptation | 311 – Agriculture (0.62 NOK mill.); 410 – General environmental protection (0.2 NOK mill.) |
Zambia | 635 604,00 | 67 522,63 | Disbursed | OOF | PSI | Mitigation | 232 – Energy generation, renewable sources |
Zambia | 989 577,48 | 105 126,57 | Disbursed | ODA | Grants | Cross-cutting | 311 – Agriculture |
Zimbabwe | 194 580,00 | 20 670,97 | Disbursed | ODA | Grants | Cross-cutting | 311 – Agriculture |
Bolivia | 590 868,44 | 62 770,20 | Disbursed | ODA | Grants | Adaptation | 311 – Agriculture (0.42 NOK mill.); 410 – General environmental protection (0.17 NOK mill.) |
Brazil | 104 841 571,26 | 11 137 718,44 | Disbursed | ODA | Grants | Mitigation | 140 – Water and sanitation (0.21 NOK mill.); 151 – Government and civil society, general (21.94 NOK mill.); 410 – General environmental protection (82.69 NOK mill.) |
Brazil | 685 861,45 | 72 861,67 | Disbursed | ODA | Grants | Cross-cutting | 410 – General environmental protection |
Colombia | 213 748,73 | 22 707,34 | Disbursed | ODA | Grants | Adaptation | 313 – Fishing (0.07 NOK mill.); 410 – General environmental protection (0.09 NOK mill.); 430 – Other multisector (0.05 NOK mill.) |
Colombia | 90 345 097,15 | 9 597 702,92 | Disbursed | ODA | Grants | Mitigation | 312 – Forestry (4.68 NOK mill.); 410 – General environmental protection (85.67 NOK mill.) |
Colombia | 29 601 007,20 | 3 144 627,46 | Disbursed | ODA | Grants | Cross-cutting | 151 – Government and civil society, general (1.6 NOK mill.); 410 – General environmental protection (28 NOK mill.) |
Ecuador | 1 069 974,00 | 113 667,40 | Disbursed | ODA | Grants | Mitigation | 410 – General environmental protection |
Guatemala | 6 969 664,67 | 740 413,96 | Disbursed | ODA | Grants | Adaptation | 430 – Other multisector |
Guyana | 22 566 046,12 | 2 397 276,82 | Disbursed | ODA | Grants | Mitigation | 410 – General environmental protection |
Haiti | 10 496 950,80 | 1 115 130,97 | Disbursed | ODA | Grants | Adaptation | 140 – Water and sanitation (1.5 NOK mill.); 430 – Other multisector (9 NOK mill.) |
Haiti | 7 120 000,00 | 756 384,65 | Disbursed | ODA | Grants | Mitigation | 232 – Energy generation, renewable sources (1.52 NOK mill.); 410 – General environmental protection (5.6 NOK mill.) |
Nicaragua | 1 009 025,60 | 107 192,62 | Disbursed | ODA | Grants | Adaptation | 113 – Secondary education |
Panama | 1 451 296,00 | 154 176,69 | Disbursed | OOF | PSI | Mitigation | 232 – Energy generation, renewable sources |
Peru | 57 502 055,06 | 6 108 661,78 | Disbursed | ODA | Grants | Mitigation | 151 – Government and civil society, general (10.08 NOK mill.); 410 – General environmental protection (47.42 NOK mill.) |
Peru | 12 481 892,40 | 1 325 998,85 | Disbursed | ODA | Grants | Cross-cutting | 312 – Forestry |
Afghanistan | 12 972 262,80 | 1 378 092,76 | Disbursed | ODA | Grants | Adaptation | 140 – Water and sanitation (10.37 NOK mill.); 152 – Conflict prevention and resolution, peace and security (2.6 NOK mill.) |
Afghanistan | 594 309,60 | 63 135,77 | Disbursed | ODA | Grants | Mitigation | 311 – Agriculture |
Afghanistan | 3 763 838,00 | 399 846,81 | Disbursed | ODA | Grants | Cross-cutting | 311 – Agriculture |
Armenia | 2 000 000,00 | 212 467,60 | Disbursed | ODA | Grants | Mitigation | 231 – Energy Policy |
Azerbaijan | 2 000 000,00 | 212 467,60 | Disbursed | ODA | Grants | Mitigation | 231 – Energy Policy |
Bangladesh | 6 014 991,20 | 638 995,37 | Disbursed | ODA | Grants | Mitigation | 232 – Energy generation, renewable sources |
Cambodia | 444 281,06 | 47 197,66 | Disbursed | ODA | Grants | Adaptation | 140 – Water and sanitation (0.06 NOK mill.); 311 – Agriculture (0.39 NOK mill.) |
Cambodia | 821 705,73 | 87 292,92 | Disbursed | ODA | Grants | Mitigation | 151 – Government and civil society, general (0.08 NOK mill.); 152 – Conflict prevention and resolution, peace and security (0.08 NOK mill.); 311 – Agriculture (0.46 NOK mill.); 410 – General environmental protection (0.2 NOK mill.) |
China | 955 939,20 | 101 553,05 | Disbursed | ODA | Grants | Adaptation | 313 – Fishing |
China | 39 348 277,62 | 4 180 117,03 | Disbursed | ODA | Grants | Mitigation | 160 – Other social infrastructure and services (0.81 NOK mill.); 231 – Energy Policy (1.12 NOK mill.); 410 – General environmental protection (25.69 NOK mill.); 430 – Other multisector (11.72 NOK mill.) |
China | 1 598 578,00 | 169 823,01 | Disbursed | ODA | Grants | Cross-cutting | 410 – General environmental protection |
Georgia | 2 289 325,22 | 243 203,72 | Disbursed | ODA | Grants | Mitigation | 232 – Energy generation, renewable sources |
India | 6 860 178,80 | 728 782,86 | Disbursed | ODA | Grants | Adaptation | 410 – General environmental protection (6.67 NOK mill.); 430 – Other multisector (0.19 NOK mill.) |
India | 3 641 996,40 | 386 903,11 | Disbursed | ODA | Grants | Mitigation | 410 – General environmental protection |
India | 8 804 290,97 | 935 313,28 | Disbursed | ODA | Grants | Cross-cutting | 151 – Government and civil society, general (0.24 NOK mill.); 321 – Industry (0.55 NOK mill.); 410 – General environmental protection (0.79 NOK mill.); 430 – Other multisector (7.22 NOK mill.) |
Indonesia | 127 825,74 | 13 579,41 | Disbursed | ODA | Grants | Adaptation | 430 – Other multisector |
Indonesia | 450 872 175,10 | 47 897 864,18 | Disbursed | ODA | Grants | Mitigation | 151 – Government and civil society, general (9.54 NOK mill.); 232 – Energy generation, renewable sources (0.38 NOK mill.); 410 – General environmental protection (440.94 NOK mill.) |
Indonesia | 26 088 742,40 | 2 771 506,23 | Disbursed | ODA | Grants | Cross-cutting | 410 – General environmental protection |
Laos | 1 953 993,00 | 207 580,10 | Disbursed | ODA (0.72 NOK mill.); OOF (1.23 NOK mill.) | Grants (0.72 NOK mill.); PSI (1.23 NOK mill.) | Mitigation | 232 – Energy generation, renewable sources (1.23 NOK mill.); 410 – General environmental protection (0.72 NOK mill.) |
Malaysia | 594 921,25 | 63 200,74 | Disbursed | ODA | Grants | Mitigation | 410 – General environmental protection |
Myanmar | 47 965 734,89 | 5 095 582,26 | Disbursed | ODA (24.6 NOK mill.); OOF (23.36 NOK mill.) | Grants (24.6 NOK mill.); PSI (23.36 NOK mill.) | Mitigation | 151 – Government and civil society, general (1.5 NOK mill.); 231 – Energy Policy (5.48 NOK mill.); 232 – Energy generation, renewable sources (23.36 NOK mill.); 410 – General environmental protection (17.63 NOK mill.) |
Myanmar | 5 822 923,00 | 618 591,23 | Disbursed | ODA | Grants | Cross-cutting | 410 – General environmental protection |
Nepal | 9 273 549,03 | 985 164,35 | Disbursed | ODA | Grants | Adaptation | 114 – Post-secondary education (0.31 NOK mill.); 151 – Government and civil society, general (1.67 NOK mill.); 311 – Agriculture (0.71 NOK mill.); 430 – Other multisector (6.58 NOK mill.) |
Nepal | 27 494 755,60 | 2 920 872,35 | Disbursed | ODA | Grants | Mitigation | 231 – Energy Policy (1.23 NOK mill.); 236 – Heating, cooling and energy distribution (26.26 NOK mill.) |
Pakistan | 3 719 503,40 | 395 136,98 | Disbursed | ODA | Grants | Adaptation | 140 – Water and sanitation (1.68 NOK mill.); 152 – Conflict prevention and resolution, peace and security (1.61 NOK mill.); 430 – Other multisector (0.43 NOK mill.) |
Pakistan | 74 219,20 | 7 884,59 | Disbursed | ODA | Grants | Cross-cutting | 140 – Water and sanitation |
Sri Lanka | 930 389,59 | 98 838,82 | Disbursed | ODA | Grants | Adaptation | 151 – Government and civil society, general (0.28 NOK mill.); 313 – Fishing (0.45 NOK mill.); 430 – Other multisector (0.2 NOK mill.) |
Sri Lanka | 1 101 306,23 | 116 995,95 | Disbursed | ODA | Grants | Mitigation | 231 – Energy Policy |
Tajikistan | 7 621 038,40 | 809 611,86 | Disbursed | ODA | Grants | Mitigation | 236 – Heating, cooling and energy distribution |
Thailand | 366 599,49 | 38 945,26 | Disbursed | ODA | Grants | Mitigation | 410 – General environmental protection |
Viet Nam | 369 765,00 | 39 281,54 | Disbursed | ODA | Grants | Adaptation | 114 – Post-secondary education |
Viet Nam | 6 308 937,21 | 670 222,37 | Disbursed | ODA | Grants | Mitigation | 232 – Energy generation, renewable sources (3.42 NOK mill.); 240 – Banking and financial services (0.22 NOK mill.); 311 – Agriculture (0.57 NOK mill.); 410 – General environmental protection (2.1 NOK mill.) |
Global Unspecified | 208 606 392,40 | 22 161 049,63 | Disbursed | ODA | Grants | Adaptation | 121 – Health, general (13.6 NOK mill.); 151 – Government and civil society, general (0.7 NOK mill.); 311 – Agriculture (32 NOK mill.); 313 – Fishing (8.03 NOK mill.); 410 – General environmental protection (19.75 NOK mill.); 430 – Other multisector (128.94 NOK mill.); 720 – Emergency Response (0.1 NOK mill.); 740 – Disaster prevention and preparedness (5.5 NOK mill.) |
Global Unspecified | 1 427 373 251,12 | 151 635 283,55 | Disbursed | ODA (1180.52 NOK mill.); OOF (246.85 NOK mill.) | Grants (1180.52 NOK mill.); PSI (246.85 NOK mill.) | Mitigation | 151 – Government and civil society, general (36.08 NOK mill.); 231 – Energy Policy (172.08 NOK mill.); 231 – Energy Policy (40.61 NOK mill.); 232 – Energy generation, renewable sources (40 NOK mill.); 232 – Energy generation, renewable sources (206.24 NOK mill.); 321 – Industry (0.56 NOK mill.); 322 – Mineral resources/ mining (1.16 NOK mill.); 410 – General environmental protection (925.65 NOK mill.); 720 – Emergency Response (2.4 NOK mill.); 998 – Unallocated/unspecified (2.6 NOK mill.) |
Global Unspecified | 246 110 222,10 | 26 145 223,95 | Disbursed | ODA | Grants | Cross-cutting | 151 – Government and civil society, general (2.78 NOK mill.); 250 – Business and other services (0.2 NOK mill.); 410 – General environmental protection (200.94 NOK mill.); 720 – Emergency Response (42.2 NOK mill.) |
Papua New Guinea | 8 538 201,59 | 907 045,59 | Disbursed | ODA | Grants | Mitigation | 151 – Government and civil society, general (3.86 NOK mill.); 410 – General environmental protection (4.68 NOK mill.) |
Jordan | 2 000 000,00 | 212 467,60 | Disbursed | ODA | Grants | Mitigation | 410 – General environmental protection |
Lebanon | 1 280 000,00 | 135 979,26 | Disbursed | ODA | Grants | Mitigation | 313 – Fishing |
Africa Regional | 27 454 427,60 | 2 916 588,15 | Disbursed | ODA | Grants | Adaptation | 111 – Education, level unspecified (4.93 NOK mill.); 430 – Other multisector (22.52 NOK mill.) |
Africa Regional | 131 405 958,00 | 13 959 754,17 | Disbursed | ODA (40 NOK mill.); OOF (91.41 NOK mill.) | Grants (40 NOK mill.); PSI (91.41 NOK mill.) | Mitigation | 231 – Energy Policy (10.69 NOK mill.); 232 – Energy generation, renewable sources (40 NOK mill.); 232 – Energy generation, renewable sources (80.71 NOK mill.) |
Africa Regional | 120 466,05 | 12 797,57 | Disbursed | ODA | Grants | Cross-cutting | 410 – General environmental protection |
Eastern Africa, regional | 4 720 069,20 | 501 430,88 | Disbursed | ODA | Grants | Adaptation | 250 – Business and other services (0.03 NOK mill.); 311 – Agriculture (4.69 NOK mill.) |
Eastern Africa, regional | 25 910 716,40 | 2 752 593,85 | Disbursed | ODA | Grants | Mitigation | 140 – Water and sanitation (0.91 NOK mill.); 236 – Heating, cooling and energy distribution (25 NOK mill.) |
Middle Africa regional | 400 000 000,00 | 42 493 519,74 | Disbursed | ODA | Grants | Mitigation | 410 – General environmental protection |
South of Sahara Regional | 12 980 917,00 | 1 379 012,13 | Disbursed | ODA | Grants | Adaptation | 430 – Other multisector (3.78 NOK mill.); 720 – Emergency Response (3.2 NOK mill.); 740 – Disaster prevention and preparedness (6 NOK mill.) |
South of Sahara Regional | 50 418 973,00 | 5 356 199,06 | Disbursed | OOF | PSI | Mitigation | 231 – Energy Policy (7.59 NOK mill.); 232 – Energy generation, renewable sources (42.83 NOK mill.) |
South of Sahara Regional | 1 158 560,50 | 123 078,28 | Disbursed | ODA | Grants | Cross-cutting | 311 – Agriculture |
Western Africa regional | 8 352 806,56 | 887 350,38 | Disbursed | ODA | Grants | Mitigation | 311 – Agriculture (8.31 NOK mill.); 410 – General environmental protection (0.05 NOK mill.) |
America Regional | 1 573 691,00 | 167 179,17 | Disbursed | ODA | Grants | Mitigation | 410 – General environmental protection |
Caribbean & Central America, regional | 2 651 818,00 | 281 712,70 | Disbursed | OOF | PSI | Mitigation | 232 – Energy generation, renewable sources |
South America Regional | 6 552 536,94 | 696 100,89 | Disbursed | ODA | Grants | Mitigation | 410 – General environmental protection |
Asia Regional | 6 015 373,00 | 639 035,93 | Disbursed | ODA | Grants | Adaptation | 311 – Agriculture (0.02 NOK mill.); 313 – Fishing (4 NOK mill.); 430 – Other multisector (2 NOK mill.) |
Asia Regional | 50 229 232,00 | 5 336 042,15 | Disbursed | ODA | Grants | Mitigation | 231 – Energy Policy (2.04 NOK mill.); 232 – Energy generation, renewable sources (2 NOK mill.); 410 – General environmental protection (46.19 NOK mill.) |
Asia Regional | 10 124 170,40 | 1 075 529,09 | Disbursed | ODA | Grants | Cross-cutting | 410 – General environmental protection |
Far East Asia Regional | 5 801 329,00 | 616 297,22 | Disbursed | ODA | Grants | Mitigation | 151 – Government and civil society, general |
South & Central Asia Regional | 81 401 370,00 | 8 647 576,81 | Disbursed | OOF | PSI | Mitigation | 231 – Energy Policy |
South Asia Regional | 566 416,00 | 60 172,52 | Disbursed | ODA | Grants | Adaptation | 250 – Business and other services (0.43 NOK mill.); 311 – Agriculture (0.14 NOK mill.) |
South Asia Regional | 193 149,67 | 20 519,02 | Disbursed | ODA | Grants | Cross-cutting | 410 – General environmental protection |
Europe Regional | 513 770,40 | 54 579,78 | Disbursed | ODA | Grants | Mitigation | 151 – Government and civil society, general |
Oceania Regional | 5 000 000,00 | 531 169,00 | Disbursed | ODA | Grants | Mitigation | 231 – Energy Policy |
Oceania Regional | 3 000 000,00 | 318 701,40 | Disbursed | ODA | Grants | Cross-cutting | 114 – Post-secondary education |
6.5 Norwegian contributions in main areas
6.5.1 Norway’s International Climate and Forest Initiative
Norway’s International Climate and Forest Initiative (NICFI) has since 2008 supported global efforts that reduce greenhouse gas emissions from deforestation and forest degradation in developing countries (REDD+). Forest and land use emissions are a necessary part of the solution of the ambitious target of the Paris Agreement of limiting the global warming to well below 2 degrees Celsius. This is also among the most cost-effective ways to mitigate climate change, and contributes to most of the sustainable development goals.
The funds through NICFI are used to pay for verified emission reductions in partner countries, to finance efforts to build up global and national REDD frameworks, to support and create incentives for deforestation free supply chains, build satellite technology to monitor global forests, and to support civil society and indigenous peoples around the world.
Norway has taken steps to support development and enhancement of endogenous capacities and technologies of developing countries. For example, Norway supported the rights of indigenous peoples and forest-dependent communities to manage tropical forests in the order of USD 100 million between 2016 and 2020. A similar suite of country programming, support to indigenous peoples’ organizations, supportive civil society organizations and specialized instruments is being scaled up to USD 150 million from 2021–2025. Examples include support for indigenous communes and a training programme on territorial management based on traditional knowledge in Colombia, land titling in in Peru, payment for indigenous peoples and forest dependent communities’ forest management through Ecuador’s Socio Bosque Programme, and a long-running programme for direct support to indigenous peoples in Brazil is being scaled up to more than USD 40 million towards 2025. The programme supports territorial management by indigenous peoples, the establishment of funds managed by indigenous peoples, and support to youth and inter-generational transfer of knowledge with the aim of reactivating traditional knowledge and cultural pride.
In Africa and Asia, support is provided through CSOs to map indigenous peoples’ land tenure rights through community forestry in DRC and Indonesia. Norway also support specialised instruments to engender land use reforms such as the International Forest and Land Tenure Facility, in the order of USD 18 million towards 2025. Norway also supports the full and effective participation of indigenous peoples and local communities in the proceedings of the UNFCCC, through a platform established by decision 1/CP.21 adopting the Paris Agreement. Perhaps most importantly, Norway cooperates closely with other bilateral donors and a host of philanthropic foundations to follow up on the Forest and Tenure Pledge from COP 26 in Glasgow, in close dialogue with the Global Alliance of Territorial Communities, in order to enable more direct support, establish mutual accountability and recognize the forest guardianship of indigenous peoples and local communities.
Bilateral partnerships (USD 152 million in 2019 and USD 97 million in 2020):
At the climate summit in Paris in 2015, Germany, Norway and the UK announced a partnership with Colombia, to protect Colombia’s rainforest. At the climate summit in Glasgow it was extended up to 2025. In 2019 Norway paid for 1.9 mill. tons reduced CO2e in Colombia (USD 10 million). In 2019 Norway paid Guyana USD 45,5 million for 10.9 mill. CO2e. The disbursement was the last under the partnership agreement, as it fulfilled the Norwegian pledge of paying Guyana NOK 1.5 billion (about USD 200 million). Through the REDD Early Movers program Norway disbursed USD 12.8 million to Ecuador in 2019, paying for 2.4 mill. CO2e. For several of Norway’s bilateral forest partnerships payments were not for results (verified emissions reductions) in 2019–2020, but program support for REDD+ phase II investments. These include Indonesia (USD 33.3 million in 2019 and USD 43.6 million in 2020), Ethiopia (USD 27.2 million in 2019 and USD 21.5 million in 2020), Peru (USD 4.2 million in 2019 and USD 3.8 million in 2020), Liberia (USD 11.2 million in 2020) and Tanzania (USD 0.7 million in 2019–2020).
Multilateral support (USD 89.4 million in 2019 and USD 90.7 million in 2020):
The Congo basin is the world’s second largest rainforest. Central African Forest Initiative (CAFI) was established in 2015. In 2019 and 2020 Norway disbursed USD 45 million to CAFI each year. The UN-REDD Programme is the United Nations Collaborative Initiative on Reducing Emissions from Deforestation and forest Degradation (REDD+) in developing countries. In 2019 Norway supported UN REDD with USD 9 million and in 2020 with USD 14.5 million. The World Bank’s Forest Carbon Partnership Facility (FCPF) pays for verified emission reductions through the Carbon Fund. Norway disbursed USD 27.8 million to the Carbon Fund in 2019, and thereby concluded the Norwegian contribution to the fund. Norway contributed with USD 5.1 million to the World Bank’s BioCarbon Fund in 2019 and with USD 32 million to the World Bank’s Green Climate fund in 2020.
Other support (USD 115 million in 2019 and USD 139 million in 2020):
Since 2009 NICFI has contributed to a technology revolution that provides completely new opportunities for monitoring the forest. Satellite pictures have improved massively, and pictures are made available more frequently. The Global Forest Watch website is developed with support from Norway, providing forest countries with free data on forests, deforestation over time, forest fires etc. It is also a key priority to support the countries’ own forest monitoring systems, so that they can better manage their resources. Access to information otherwise has increased and improved the framework conditions for civil society and indigenous peoples organisations. With the support of NICFI, they can report on illegalities, thus imposing responsibility for both authorities and private actors.
NICFIs targets of reduced deforestation cannot be reached if the market pressure on the tropical forests is not reduced. NICFI supports civil society, private sector initiatives, institutions and governments in their efforts to contribute to deforestation-free production of commodities.
6.5.2 Norwegian assistance to renewable energy
Norway has been supporting renewable energy projects in developing countries for many years. The funds are primarily used to support the generation of renewable energy, access to energy, including clean cooking, building of transmission and distribution systems, establishment of power pools and strengthening of institutions and increased capacity in the energy sector.
In 2020, Norwegian support to renewable energy amounted to USD 150 million (NOK 1 409 million), of which USD 77 million (NOK 729 million) was ODA and USD 72 million (NOK 680 million) was Norfund’s investments (Other official flows). Renewable energy support reported as climate financing amounted to USD 101 million (NOK 952 million). Africa received 43 per cent and Asia 22 per cent, whereas 34 per cent was distributed globally through multilateral and regional organisations and initiatives, civil society, and commercial development. Furthermore, Norfund – which serves as the commercial investment instrument of Norway’s development policy – invested NOK 680 million in renewable energy in 2020. Not all these projects are climate specific.
The focus in Norway’s development cooperation on renewable energy has been measures that facilitate private and commercial investments, especially in generation of renewable energy. Key areas are policy dialogue and cooperation on reform, legislation, institution-building, planning and regional cooperation. Based on the private investments in new generation, access to electricity has been supported through development support to the extension of the grid as well as support to off grid solutions and clean cooking. Norfund is the primary vehicle to support large-scale projects for generation of renewable energy.
The only way to overcome the major challenges of ensuring global access to electricity services is to accelerate investment in long-term solutions making use of the renewable energy resources available in each country. Norway aims at leveraging funds for the reduction of energy poverty. Public and donor funds are not alone able to finance the significant amounts needed to boost energy sector development; thus Norwegian assistance for clean energy uses public sources to mobilise and incentivise commercial investments that lead to increased energy access and energy efficiency. Only by including the private sector is it realistic for renewable energy to become an important tool in the fight against global climate change.
6.5.3 Norwegian assistance to climate change adaptation
In 2020, USD 67 million in earmarked support was targeting climate change adaptation only (14 per cent of total earmarked support), and USD 50 million was cross-cutting support (10 per cent of total earmarked support). When focusing on total earmarked adaptation financing106 (without excluding cross-cutting support), earmarked adaptation support amounted to USD 96 million in 2019 and USD 107 million in 2020.
This earmarked support for adaptation includes climate smart agriculture and food security, strengthening resilience and early warning systems. In 2020, the four largest areas for our earmarked climate adaptation support was Other multisector (NOK 363 million), General environmental protection (NOK 309 million), Agriculture (NOK 182 million) and Government and civil society (NOK 24 million).
Africa received the largest share of this support, about 46 per cent of the total adaptation budget in 2020. Among countries, Ethiopia, Niger and Mali received the highest amount of funding for climate change adaptation in 2020.
A large part of Norway’s support for adaptation, however, is core support to multilateral institutions, amongst others the Adaptation fund and the GCF. As specified in section 6.2.1. we do not report climate specific multilateral core support to adaption. In line with the mandate of the GCF, about half of Norway’s support to the GCF, NOK 1 400 million in the period 2019–2020, will go to adaptation with a floor of 50 per cent of the adaptation allocation for particularly vulnerable countries. Support to the GEF and United Nations Environment Programme (UNEP) also includes adaptation to climate change.
While a large part of total Norwegian climate finance is allocated to REDD+ and renewable energy programmes, both of which are classified as mitigation, several REDD projects may have strong adaptation components, since forest conservation in many cases will increase climate change resilience. Further, renewable energy projects may promote climate change adaptation.
6.6 Private finance mobilised
The private sector has a critical role in achieving the scale needed to transition to low-emissions and climate-resilient economies. Tracking climaterelated private finance and investment is an important element to measure progress towards climate-related objectives and goals.
Under the UNFCCC, developed countries have committed to a collective goal of mobilising USD 100 billion per year by 2020 for climate action in developing countries. These funds are to come from a mix of public and private sources. Besides tracking public climate finance, making an assessment of progress towards this commitment also requires the measurement of private finance mobilised by developed countries’ public interventions.
The private finance mobilised amounted by Norfund’s interventions amounted to USD 16 million in 2019 and USD 33 million in 2020.
6.7 Activities related to transfer of technology and capacity building
Many of the elements already reported in this chapter also facilitate transfer of technology and capacity building. Transfer of technology and expertise in order to promote development, availability and efficiency of clean energy constitutes an important element of Norwegian ODA and has significant environmental co-benefits that are consistent with the promotion of the UNFCCC. In addition, Norway supports a wide range of other technology transfer efforts, of which a few are described in more detail below and in table A3-24 and A3-25.
With regards to how support responds to the existing and emerging capacity-building needs identified by non-Annex I Parties, an assessment is made of the relevance of the project or programme to the recipient country and/or the priorities and plans of the cooperation partner. This is based on the official guidance for the preparation and approval of Norwegian support. If the cooperation partner is not an authority of the grant recipient country, the guidance underlines that it might be relevant to assess the project’s relevance to the target group and the needs of the recipient country. This procedure is also mandatory for capacity-building support.
6.7.1 Systemic change
The digital revolution is increasing access to information and services in all areas of society and is creating new opportunities for social development and economic growth. Digital capacity building is therefore essential and has since 2016 been seen as an integral part of all Norwegian development efforts (White paper 24 (2016–2017) Common Responsibility for Common Future). Norway’s policy to integrate digitalisation in development policy to meet demands in developing countries was presented in a white paper on digitalisation and development policy in 2019 (White paper 11 (2019–2020). Norway promotes the use of digital technology and new means of communication both in long-term development cooperation and in humanitarian crises, including in interventions based on capacity development and technology transfer for climate mitigation and adaptation efforts. Norway has co-founded the Digital Public Goods Alliance, which collects, certifies and makes available digital solutions to support the SDGs. The Digital Public Good Registry now has 30 different open technologies with SDG 13 as their primary target SDG in various stages of certification and implementation.
6.7.2 The private sector
The private sector is a driver of development, innovation and deployment of technology. A well-functioning business sector is decisive for job creation and green growth and has been one of five priorities for Norwegian development assistance for the report period. The energy sector is the sector where Norway has traditionally had its largest and most important involvement in poor countries, both in the form of aid and through Norwegian business. Private Finance Advisory Network (PFAN), see the table below, is an example of how support to small and medium sized technology companies in developing countries contributes to innovation of endogenous technology and capacity.
6.7.3 The Knowledge bank
In many countries today there is greater demand for transfer of technology and knowledge than for aid funds. Revitalising and strengthening technical cooperation is therefore an important part of any forward-looking development policy. This is also vital for easing the transition from a relationship based on aid to more equal bilateral ties. In 2018, a Knowledge Bank was established to strengthen and coordinate the Norwegian technical cooperation. Norway has a long tradition of technical assistance and institutional cooperation, particularly in the energy sector. Public institutions such as The Norwegian Water Resources and Energy Directorate and the Norwegian Environmental Agency have been engaged in development cooperation for a number of years.
6.7.4 Examples of activities that Norway supports
The Climate Technology Centre and Network (CTCN) is the operational arm of the technology mechanism under the UNFCCC and serving the Paris Agreement. Norway has since the establishment of the CTCN been a major donor. Since the establishment of the CTCN, Norway has contributed financially to the CTCN with USD 9 488 850. Norway has also been a member of the Advisory Board of the CTCN in the period 2016–2019.
Norway is a member of the Clean Energy Ministerial (CEM). CEM is a high-level global forum for promotion of policies and programmes that advance clean energy technology, for sharing lessons learned and best practices, and for encouraging the transition to a global clean energy economy. Norway has co-funded the Secretariat of the CEM with approximately USD 333 333 (NOK 3 000 000), and the secretariat of the CCUS initiative under the CEM with USD 100 000 for the period 2018–2022, and EUR 20 000 for the Hydrogen Initiative.
Norway has participated in Mission Innovation since the start of the initiative in November 2015. Today, 22 countries and the European Union participate in the initiative. Mission Innovation aims to reinvigorate and accelerate public and private global clean energy innovation with the objective to make clean energy widely affordable. Each participating country will seek to double its governmental and/or state-directed clean energy R&D investment over five years. Mission Innovation is an example of an initiative that will put the world on a faster route to the point where we can secure energy access for all, while at the same time curbing global emissions of greenhouse gases.
As an example of what works in the field of capacity building and renewable energy, Norway would like to highlight our cooperation with Germany, the UK and the EU in supporting GET FIT (Global Energy Transfer Feed-in Tariff) Program pilot in Uganda. Capacity building and regulatory changes facilitated by GET FiT have played a key role in attracting private investment to the energy sector in Uganda. The program started in 2010 and the last payment from Norway was in 2015. We are now harvesting results. By end of 2020, Get Fit Uganda has contributed to 122.4 MW renewable energy (commissioned projects). The corresponding energy generation was 380 GWh. The robust and conducive regulatory environment, supported by GET FiT, is being recognised internationally – in 2020 Uganda was ranked number one on the Electricity Regulatory Index for Africa by the African Development Bank – for the third time in a row.
Support to standardisation of legal documents such as bankable Power Purchase Agreements and Implementation Agreements have been particularly important in attracting investments. Norway considers the Global Energy Transfer Feed-in Tariff pilot programme to be a success story related to technology transfer.
Norway has no information to report on failure stories related to technology transfer.
Table A3-24 (CTF table 8). Provision of technology development and transfer support a, b
Recipient country and/or region | Targeted area | Measures and activities related to technology transfer | Sector c | Source of the funding for technology transfer | Activities undertaken by | Status | Additional information d |
|---|---|---|---|---|---|---|---|
Angola, Bhutan, Haiti, Liberia, Mozambique, Myanmar, Nepal, Palestine, China, Tanzania, Uganda | Mitigation | The Norwegian Clean Energy for Development Initiative supports development of low-carbon and energy sector strategies, strengthen technical and institutional capacity to support private sector investment in developing countries, and contributes to the international transfer of energy-related technology. Norway further supports investment in infrastructure and clean energy production capacity in the energy sector of developing countries. Such investment support is frequently supplemented by institutional and human resource development measures that improve the technological expertise of the recipient country (e.g. support to HydroLab in Nepal). | Renewable energy, Energy access, Energy efficiency | Public | Public | Implemented | |
Focus on non-Annex 1 countries | Mitigation and adaptation | Norfund – Renewable Energy. Norfund is the development finance institution that serves as the commercial investment instrument of Norway’s development policy. Through investment in profitable companies and the transfer of knowledge and technology, it contributes to reducing poverty and to economic progress in poor countries. | Clean energy, Energy efficiency, Energy access, Industry, Transport | Private and public | Private and public | Implemented | |
Focus on non-Annex 1 countries | Mitigation | Norway is one of the contributors to the partnership Energising Development (EnDev). EnDev – is an impact-oriented initiative between the Netherlands, Germany, Norway, Australia, the United Kingdom and Switzerland. EnDev promotes the supply of modern energy technologies to households and small-scale businesses. The Partnership cooperates with 24 countries in Africa, Latin America and Asia. Since its start in 2005, EnDev has taken a leading role in promoting access to sustainable energy for all. | Renewable energy, Energy efficiency, Energy access, Industry | Public | Private and public | Implemented | |
Non-Annex I | Mitigation | Norway has been an active supporter of the International Renewable Energy Agency (IRENA) since the early planning stage, and signed the statutes in January 2009. We strive to involve our private sector companies and our technological institutions as much as possible in the endeavour to promote the widespread use of renewable energy. Norway has contributed to the Global Renewable Energy Atlas and Renewable Energy Roadmap, as well as a range of other products and resources IRENA is developing to support developing countries develop their own renewable energy resources and industries. | Renewable energy, Energy Access | Public | Private and public | Implemented | |
Both Annex-I and non-Annex-I | Mitigation | Norway is a member of the Clean Energy Ministerial (CEM). CEM is a high-level global forum to promote policies and programmes that advance clean energy technology, to share lessons learned and best practices, and to encourage the transition to a global clean energy economy. Initiatives are based on areas of common interest among participating governments and other stakeholders. | Renewable energy, Energy efficiency, Energy access | Public | Public and Private | Implemented | The CEM is focused on three global climate and energy policy goals: i) Improve energy efficiency worldwide, ii) Enhance clean energy supply, iii) Expand clean energy access. The main objective is improving policies and enhanced deployment of clean energy technologies. |
Non Annex-I | Mitigation and adaptation | Private Finance Advisory Network, UNIDO. The Private Financing Advisory Network (PFAN) is a multilateral public private partnership initiated by the Climate Technology Initiative and the United Nations Framework Convention on Climate Change (UNFCCC). It identifies and nurtures promising, innovative clean and renewable energy projects by bridging the gap between investors, clean energy entrepreneurs and project developers. | Renewable energy, Energy efficiency, Energy access | Private and Public | Private and public | Implemented | Capacitate small and medium sized businesses to develop bankable projects. |
Non Annex-I | Mitigation and adaptation | Clean Technology Center and Network. The Climate Technology Centre and Network facilitates the provision of information, training and support to build and/or strengthen the capacity of developing countries to identify technology options, make technology choices and operate, maintain and adapt technology. | Renewable energy, Energy efficiency, Energy access | Public | Private and public | Implemented | |
All | Mitigation | The Global Carbon Capture and Storage Institute: The Global Carbon Capture and Storage Institute (GCCSI) was established at the initiative of the Australian authorities. The aim of the institute is to contribute to a more rapid international dissemination of CO2 capture and storage technologies. The Norwegian state enterprise Gassnova is a member of the institute | Energy, Industry | Public and private | Public and private | Implemented | |
All | Mitigation | The technology centre for CO2 capture at Mongstad (TCM) is the world’s largest facility for testing and improving CO2 capture. TCM is an arena for targeted development, testing and qualification of CO2 capture technologies. International dissemination of the centre’s experiences and results is important to reduce the costs and risks associated with large-scale CO2 capture. Knowledge gained will prepare the ground for CO2 capture initiatives to combat climate change. TCM is a joint venture between the Norwegian state, Equinor, Shell and Total. | Energy, Industry | Private and Public | Private and public | Implemented | |
Non-Annex I | Mitigation | GEEREF is an innovative fund that aims to mobilise private sector finance. By providing new risk-sharing and contributing to co-financing options, GEEREF plays a role in increasing the uptake of renewables and energy efficiency in developing countries. The approach is demand-driven in markets that need more risk capital to evolve. GEEREF’s support to regional sub-funds tailored to regional needs and conditions stimulates these markets. | Renewable energy, Energy efficiency | Public | Public | Implemented | Norway participated in the establishment of the Global Energy Efficiency and Renewable Energy Fund (GEEREF) in 2008 together with the European Commission and Germany. |
Tanzania, Malawi | Adaptation | Global Framework for Climate Services (GFCS) Adaptation Programme in Africa. Enhanced capacity of National Meteorological and Hydrological Services to provide climate services, and enhanced capacity of the health, agriculture/food security and DRR sectors to use climate services in decision-making processes. | Agriculture/food security, Health, DRR | Public | Public | Implemented | |
Regional Africa | Adaptation | Global Framework for Climate Services (GFCS) – Adaptation and disaster risk reduction in Africa. Building capacity for the prediction of severe weather events in Africa. Support to meteorological services. | Agriculture/food security, Health, DRR, energy, water (GFCS priority sectors) | Public | Public | Implemented | Support through WMO to regional meteorological offices and to the GFCS secretariat in Genève. |
Regional Africa | Adaptation | Strengthening the capacity of climate services in Africa through expert deployments | Agriculture/food Security, health, DRR | Public | Public | Implemented | Support through Norwegian Refugee Council, in coordination with GFCS and its partners. |
Bangladesh, Myanmar, Vietnam | Adaptation | Meteorological services in Bangladesh, Myanmar and Vietnam 2017- 2019 | Agriculture/food Security, fisheries, health, DRR | Public | Public | Implemented | Support from Norwegian NMHS to partner institutions |
Malawi, Tanzania | Adaptation | Weather and Climate Services in Tanzania and Malawi as Digital Public Goods | Agriculture/food Security, health, DRR | Public | Public | Delayed due to Covid-19 | Pilot project |
Non-Annex I | Core support | Agricultural Research through the Consultative Group on International Agricultural Research (CGIAR). The research focusses on reducing poverty, improving food and nutrition security for health and improved natural resource systems and ecosystem services. This includes adaptation to a changing climate. Research in partnership with national and international institutions. National ownership including training, is central. | Agriculture, Fisheries, forestry, Food Security | Public | Public | Implemented | NOK 100 mill contributed in 2018. NOK 130 mill contributed in 2019. |
Non-Annex I | Adaptation | Agricultural Research through the Global Crop Diversity Trust on Crop Wild Relatives to collect crop genetic material amongst crop wild relatives which show a specific tolerance to various climate stresses. The collected genetic material is used in pre-breeding programmes to breed the climate stress tolerant genetic traits into the domesticated crops. | Agriculture, Food Security | Public | Public | Implemented | New agreement signed in 2017. NOK 6.7 million in the period 2017–2020. |
Non-Annex I | Adaptation | Climate adaptation in agriculture and food production. A number of projects are supported through NGO’s, the Rome based UN agencies (FAO, WFP and IFAD) and national/regional institutions with the aim to contribute to climate change adaptation, especially among small scale farmers and fishermen in developing countries. | Agriculture/ fisheries/ food production/ food security | Public | Public | Implemented |
Table A3-25 (CTF table 9). Provision of capacity-building support a
Recipient country / region | Targeted area | Programme or project title | Description of programme or project b,c |
|---|---|---|---|
Various REDD+ partner countries | Mitigation | The UN-REDD Programme | The UN-REDD Programme is a collaborative partnership bringing together the expertise of the UN Food and Agricultural Organization (FAO), the UN Development Program (UNDP) and the UN Environment Program (UNEP). The Programme has over 60 partner countries. Through its global activities UN-REDD contributes to the development of methodology and building of capacity within areas such as REDD+ governance, MRV, biodiversity and green economic development. |
Various REDD+ partner countries | Mitigation | The Forest Investment Program (FIP) | The Forest Investment Program (FIP) under the CIF provides financing at scale to a limited number of pilot countries to support the implementation of their national REDD+ strategies. Over time, the intention is to help countries access larger and more sustainable results-based REDD+ payments. |
Various REDD+ partner countries | Mitigation | Forest Carbon Partnership Facility (FCPF) | The Forest Carbon Partnership Facility is a global partnership of governments, businesses, civil society, and Indigenous Peoples focused on reducing emissions from deforestation and forest degradation. The objective is to pilot a performance-based payment system for REDD+ activities and to test ways to sustain or enhance livelihoods of local communities and to conserve biodiversity. |
Various REDD+ partner countries | Mitigation | BioCarbon Fund Initiative for Sustainable Forest Landscapes (BioCF ISFL) | Norway is a contributor to the ISFL, managed by the World Bank. It promotes reducing greenhouse gas emissions from the land sector, from deforestation and forest degradation in developing countries (REDD+), and from sustainable agriculture, as well as smarter land-use planning, policies and practices. ISFL aims to support economic development by protecting forests, restoring degraded lands, enhancing agricultural productivity, and by improving livelihoods and local environments. The fund provides technical assistance that impact multiple sectors of the economy and result-based payments to incentivize and sustain program activities. |
Global | Mitigation | NORWEP (Norwegian Energy Partners) | NORWEP is a public-private partnership between three Government Ministries and Norwegian energy companies. The aim is to promote Norwegian energy competence in international markets, which also implies capacity-building in developing countries. |
Both Annex-I and non-Annex-I | Mitigation, Adaptation, Technology development and transfer | The International Centre for Hydropower (ICH) | The International Centre for Hydropower (ICH) is based in Norway and has members from the hydropower industry as well as Norwegian public institutions. Its aim is promoting hydropower and power market competence in emerging markets and developing countries. Institutional frameworks and capacity building as well as technological transfer are central in ICH’s programmes. |
Both Annex-I and non-Annex-I | Mitigation, Technology development and transfer | The Carbon Sequestration Leadership Forum | The Carbon Sequestration Leadership Forum (CSLF) has 26 member states. It is a Ministerial-level international climate change initiative that is focused on the development of improved cost-effective technologies for carbon capture and storage (CCS). It also promotes awareness and champions legal, regulatory, financial, and institutional environments conducive to such technologies. |
Both Annex-I and non-Annex-I | Mitigation | Sustainable Energy for All (SE4All) | Norway has supported the SE4All initiative since its launch in Oslo in 2011. |
Coastal developing countries south of Sahara through FAO | Adaptation | EAF Nansen Project | The EAF Nansen Programme and the research vessel Dr. Fridtjof Nansen has since 1975 assisted developing countries in collecting marine research data. The vessel is an integral part of the Nansen programme. The programme is run by the Food and Agriculture Organization (FAO) and funded by Norway. The vessel is operated by Norway’s Institute of Marine Research (IMR), who also provide the scientific services. From 2010 to 2015 Norway supported the project “Climate effects on biodiversity, abundance and distribution of marine organisms in the Benguela Current (NansClim)”. The objective was to identify and describe possible trends in ocean climate and corresponding changes in marine biodiversity and fisheries in the region, using data collected through the “Nansen Programme” together with relevant available data. Based on the results from NansClim it was decided that in the new phase of the Nansen Programme starting in 2017, climate change issues should be incorporated to a larger degree. A science plan has been developed for the new phase of the Programme, where one of three main categories is “understanding the impacts of climate change on fish stocks and ecosystems, including setting up monitoring systems.” This is reflected in the research topics and the title of the new programme: “Supporting the Application of the Ecosystem Approach to Fisheries Management considering Climate and Pollution Impacts”. The new state of the art vessel has larger capacity and a laboratory specifically designed for climate studies. |
Tanzania | Adaptation | Tanzania Agricultural Partnership (TAP) phase II | The overall Project goal is the establishment of a public-private sector platform that provides commercial and developmental support to sustainable and profitable small-holder agriculture in Tanzania. |
Malawi | Adaptation | AIIC – Malawi Agriculture Partnership (MAP) II | The overall Project goal is the establishment of a public-private sector platform that provides commercial and developmental support to sustainable and profitable small-holder agriculture in Malawi. |
Zambia | Adaptation, Food Security, Capacity Building | Conservation agriculture programme (CAP) phase II | Support to the CFU Zambia programme to scale up conservation agriculture in Zambia. The programme is implemented in collaboration with the Ministry of Agriculture |
Non-Annex I | Adaptation | GCDT – Genetic Resources – Crop Wild Relatives Project | Global Crop Diversity Trust- Crop Wild Relatives – CWR- work with the wild relatives of 29 major food crops. The project collects the wild plants (crop relatives); evaluates them for the useful traits; makes the resulting information widely available; provides them to gene banks for conservation; and prepares them (‘pre-breeding’) for use in breeding crops for new climates. Pre-bred material is fed into ongoing, active breeding initiatives in developing countries. The project was concluded in 2020. |
Global | Adaptation | Climate Change, Fisheries and Aquaculture. Adaptation and mitigation. | The project aims at testing methods for vulnerability analyses related to climate, and adaptation strategies within fisheries and fish farming in various regions. |
Global | Mitigation Technology Development and transfer | Energy Sector Management Assistance Programme – ESMAP | ESMAP is a partnership between the World Bank Group and 18 partners to help low and middle-income countries reduce poverty and boost growth, through environmentally sustainable energy solutions. ESMAP’s analytical and advisory services are integrated within the WBG’s country financing and policy dialogue in the energy sector. Through the WBG, ESMAP works to accelerate the energy transition required to achieve Sustainable Development Goal 7 (SDG7) to ensure access to affordable, reliable, sustainable and modern energy for all. Norway provides core funding to the ESMAP Multi-Donor Trust Fund hosted in the World Bank. |
Global | Mitigation Technology development and transfer | Clean Cooking Alliance | The Clean Cooking Alliance works with a global network of partners to build an inclusive industry that makes clean cooking accessible to the three billion people who live each day without it. Achieving universal access to clean cooking solutions requires scaling up a range of technologies and business models. The Alliance’s work is built around three core pillars: Driving consumer demand for cleaner, more modern stoves and fuels by supporting behaviour change and awareness-raising interventions; Mobilizing investment to build a pipeline of scalable businesses capable of delivering affordable, appropriate, high-quality clean cooking products; and fostering an enabling environment for industry growth by advocating for effective and predictable policies, providing trusted, relevant data, and serving as the convener and champion of the clean cooking sector. Norway provides core funding to the Alliance. |
7 Other reporting matters
7.1 Process of self-assessment
The UNFCCC biennial reporting guidelines encourages Parties to report to the extent possible, on the domestic arrangements established for the process of the self-assessment of compliance with emission reductions in comparison with emission reduction commitments or the level of emission reduction that is required by science. Norway has had a quantitative emission reduction commitment for the Kyoto Protocol’s first commitment period and has taken a quantitative emission reduction commitment for the Kyoto Protocol’s second commitment period. Through its annual submissions of its GHG inventory and the review of these inventories, Norway has a sound knowledge of its emissions and removals. Norway has implemented a broad range of policies and measures that reduced emissions and enhance removals. Moreover, this BR5 explains how Norway plans to fulfil its commitment for the second commitment period of the Kyoto Protocol (2013–2020). In accordance with the Climate Change Act the Government annually submits to the Parliament updated information on status and progress in achieving the climate targets under the law. This ensures broad political ownership of the target and transparency while progressing towards the achievement of the target.
7.2 National rules for taking local action against domestic non-compliance
The UNFCCC biennial reporting guidelines encourages Parties to report, to the extent possible, on the progress made in the establishment of national rules for taking local action against domestic non-compliance with emission reduction targets. In Norway’s environmental legislation, there are provisions for enforcement of different obligations and decisions made in accordance with the law. Through the climate agreement with the EU, Norway will take part in EUs climate legislation from 2021 to 2030. This legislation provides legally binding climate targets for Norway (see chapter 4 of NC8). The EFTA Surveillance Authority (ESA) is responsible for monitoring and enforcing compliance. For more information about the Pollution Control Act, the Greenhouse Gas Emissions Trading Act and the Climate Change Act, see chapter 4 of NC8.
7.3 Other matters
The UNFCCC biennial reporting guidelines encourages Parties to report any other information that the Party considers relevant to the achievement of the objective of the Convention and suitable for inclusion in its biennial report. Norway does not have any other information to report on this matter in this BR5.