3 Greenhouse gas inventory information, including information on national systems and national registries
3.1 Summary tables
The Norwegian National Inventory Report (NIR) has been prepared in accordance with the UNFCCC Reporting Guidelines on Annual Inventories, and the estimation methods generally follow the Guidelines for National Greenhouse Gas Inventories published by the Intergovernmental Panel on Climate Change (IPCC). The latest inventory with the NIR and Common Reporting Format (CRF) covering the years 1990–2020 was submitted to the UNFCCC Secretariat on April 8th, 2022. Annex 1 contains the summary tables for Norway for the years 1990–2020 and the tables are drawn from the annual submission under the Climate Convention and the Kyoto Protocol. The summary tables are also reported as CTF table 1 together with Norway’s fifth Biennial Report,
The NIR covers emissions of carbon dioxide (CO2), methane (CH4), nitrous oxide (N2O), perfluorcarbons (PFCs), sulphur hexafluoride (SF6) and hydrofluorocarbons (HFCs) from 1990 to 2020. NF3 emissions do not occur in Norway. Norway’s inventory includes indirect emissions of CO2 from non-combustion sources originating from the fossil part of CH4 and NMVOC. See chapter 9 of the NIR for more details.
3.2 Descriptive summary
3.2.1 Overview
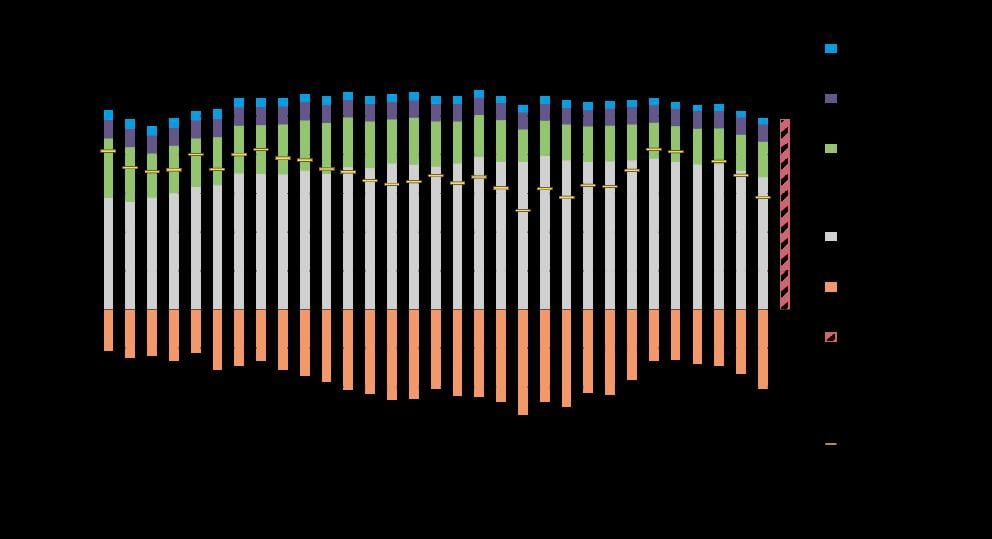
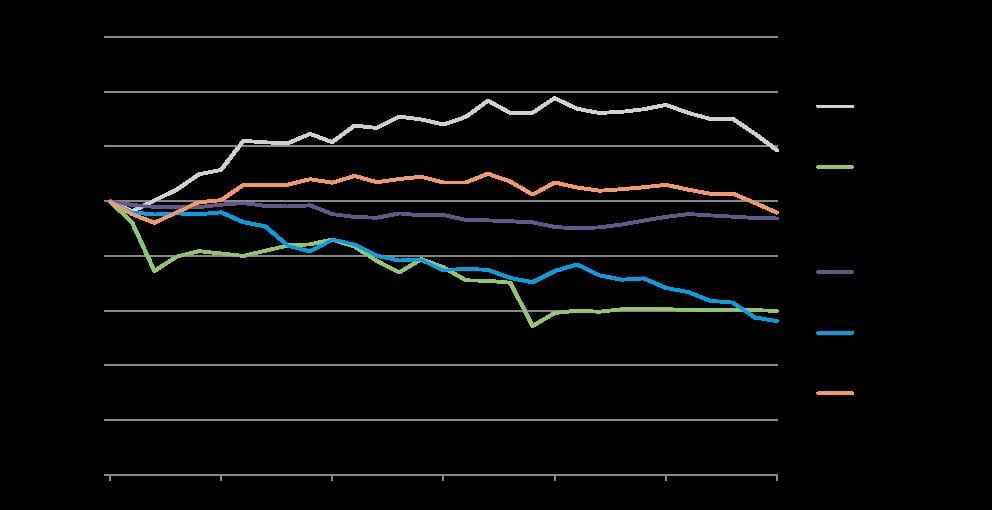
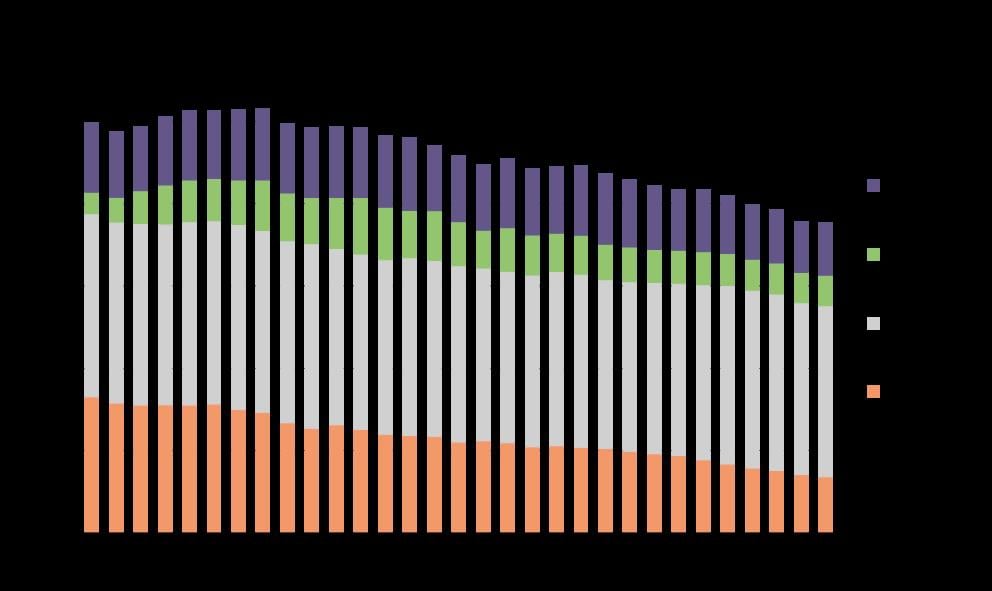
Table 3.1 presents emission figures for all greenhouse gases, expressed in absolute emission figures and total CO2 equivalents using GWP-100 values from the IPCC’s fourth Assessment report. Between 1990 and 2020 the total greenhouse gas emissions decreased by 2.2 million tonnes, or by 4.2 per cent. Preliminary figures for 2021 show a total of 48.9 Mt. Between 1996 and 2011, emissions exceeded 54 million tonnes CO2 equivalents in all years except in 2009, which was a special year as the economy was set back by the financial crisis. Emissions peaked at 56.6 million tonnes in 2007. Since 2009, emissions have stayed below 55 million tonnes CO2 equivalents. The net greenhouse gas emissions including all sources and sinks amounted to 28.9 million tonnes in 2020. The total contribution from different sources from 1990 to 2020 is illustrated in Figure 3.1. Figure 3.2 illustrates the development of emissions of greenhouse gases from various sources (excluding LULUCF) relative to the emission level in 1990. The increases in emissions of greenhouse gases from 1990 were caused by increased activity in the energy sector. The increase was slowed by the reduced emissions from waste handling and industrial processes. Since 2015, total emissions have gone down, mainly caused by decreased emissions in the energy sector, especially within the transport and oil and gas sector. Much of this reduction is due to a 18.5 per cent reduction in road transport emissions from 2015 to 2020. The reduction in road transport emissions can be explained by more efficient vehicles, more electric vehicles, and increased use of biofuels.
In 2020, the net greenhouse gas removals in the LULUCF sector was 20.3 million tonnes CO2 equivalents, which corresponds to about 41 per cent of the national greenhouse gas emissions (from all other sectors than LULUCF) that year. The average annual net sequestration from the LULUCF sector was about 18.0 million tonnes of CO2 equivalents for the period 1990–2020. The calculated changes in carbon depend upon several factors such as growing conditions, harvest levels, management practices and land use changes. In particular, variations in annual harvest will in the short term directly influence the variations in changes in carbon stocks and dead organic matter. For more information on the annual variation in CO2 removals on forested land, please see chapter 6.1.1 of the Norwegian National Inventory Report 2020.
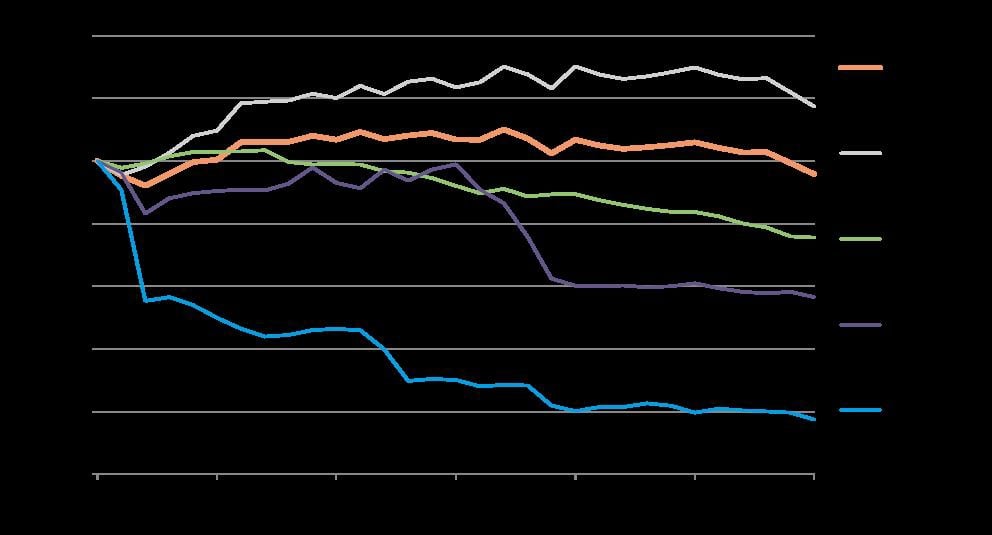
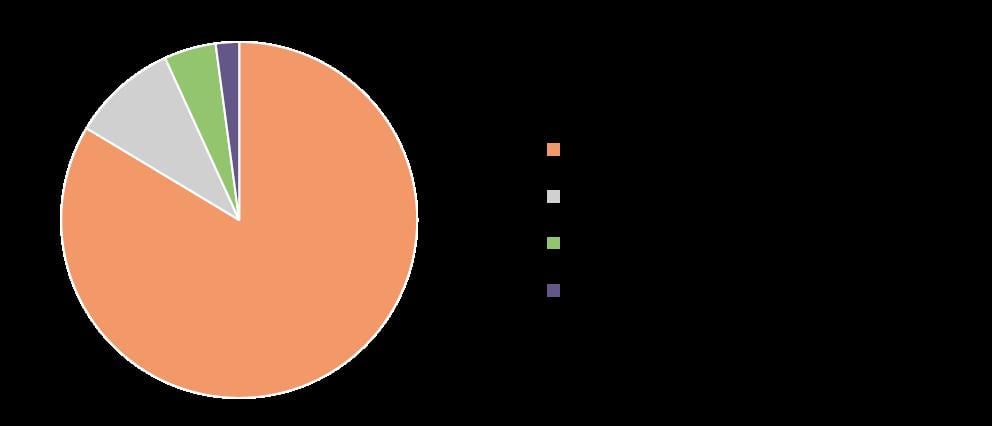
Total emissions increased in the 1990s, but have, since the turn of the century, been more or less stable, and declined in recent years (9.6 per cent since 2015), cf. Figure 3.1. While emissions of CO2 from most sources have increased, emissions of other greenhouse gases have decreased (cf. Figure 3.3). Since 1990 Norway has experienced strong economic and population growth as well as expansion of petroleum extraction. These factors have led to increased use of fossil fuels, and consequently higher CO2 emissions. However, the overall growth in CO2 has been partly offset by reductions in other gases and sectors. In 2020, emissions decreased by 3.5 per cent, and were 4.2 per cent lower than in 1990. Emissions in 2020 are illustrated by gases in Figure 3.4.
Table 3.1 Emissions of greenhouse gases in Norway, 1990–2020. Units: CO2 in Mtonnes (Mt) and other gases in ktonnes (kt).
Gas | CO2 | CH4 | N2O | PFC | SF6 | HFC |
|---|---|---|---|---|---|---|
Year | Mt | kt | kt CO2 equivalents | |||
1990 | 35.1 | 249.4 | 13.8 | 3 894.8 | 2 098.5 | 0.04 |
1995 | 38.5 | 256.8 | 12.5 | 2 314.0 | 579.8 | 97.8 |
2000 | 42.1 | 247.0 | 12.8 | 1 518.5 | 891.3 | 369.3 |
2005 | 43.3 | 229.6 | 13.6 | 955.3 | 296.9 | 548.7 |
2010 | 45.7 | 223.0 | 8.3 | 238.4 | 68.5 | 894.2 |
2011 | 44.8 | 218.2 | 8.3 | 262.6 | 53.6 | 965.8 |
2012 | 44.3 | 214.5 | 8.3 | 200.5 | 52.6 | 1 028.3 |
2013 | 44.6 | 211.2 | 8.2 | 181.0 | 55.4 | 1 118.1 |
2014 | 45.0 | 208.9 | 8.3 | 178.9 | 48.8 | 1 081.1 |
2015 | 45.6 | 208.8 | 8.4 | 146.4 | 67.6 | 963.3 |
2016 | 44.8 | 205.3 | 8.2 | 186.2 | 61.2 | 1 005.5 |
2017 | 44.2 | 199.6 | 8.0 | 131.0 | 56.3 | 1 029.2 |
2018 | 44.4 | 196.5 | 7.9 | 148.1 | 53.9 | 996.5 |
2019 | 42.8 | 189.4 | 8.0 | 175.1 | 68.0 | 934.0 |
2020 | 41.2 | 188.5 | 7.8 | 161.4 | 73.7 | 810.0 |
Source: Statistics Norway/ Norwegian Environment Agency
Figure 3.1 Total emissions of greenhouse gases by sources and removals from LULUCF in Norway, 1990–2020 (million tonnes CO2 equivalents), and preliminary emissions estimates for 2021
Source: Statistics Norway/Norwegian Environment Agency/Norwegian Institute of Bioeconomy Research
Figure 3.2 Changes in emissions of greenhouse gases, relative to 1990, illustrated by UNFCCC source categories, 1990–2020. Index 1990 = 1.
Source: Statistics Norway/Norwegian Environment Agency
Figure 3.3 Changes in emissions of greenhouse gases, relative to 1990, by gas, 1990–2020. Index 1990 = 1.
Source: Statistics Norway/Norwegian Environment Agency
Figure 3.4 Distribution of emissions of greenhouse gases in Norway by gas, 2020
Source: Statistics Norway/Norwegian Environment Agency
Figure 3.5
Figure 3.6 Distribution of CO2 emissions in Norway by sub-categories in 2020

Source: Statistics Norway/ Norwegian Environment Agency
3.2.1.1 Emissions of carbon dioxide (CO2 )
In 2020, CO2 emissions amounted to 41.2 million tonnes. These emissions originated mainly from the source categories energy (80 per cent) and industrial processes and products use (19 per cent). The source category energy includes sub-categories such as oil and gas extraction, transport and stationary combustion. During the period 1990–2020, the total emissions of CO2 increased by 17 per cent, or by 6 million tonnes. This is mainly due to increases in emissions from oil and gas extraction and from transport, particularly from road traffic, civil aviation, coastal traffic and fishing. On the other hand, emissions from stationary combustion have decreased by 2.0 million tonnes CO2 since 1990 and by 2.7 million tonnes CO2 since 2010. The CO2 emissions from the category industrial processes have increased by 0.6 million tonnes of CO2 since 1990.
The Norwegian electricity production is dominated by hydroelectric power. Thus, emissions from energy industries origin almost completely from fuel combustion in oil and gas extraction and related activities.
Table 3.2
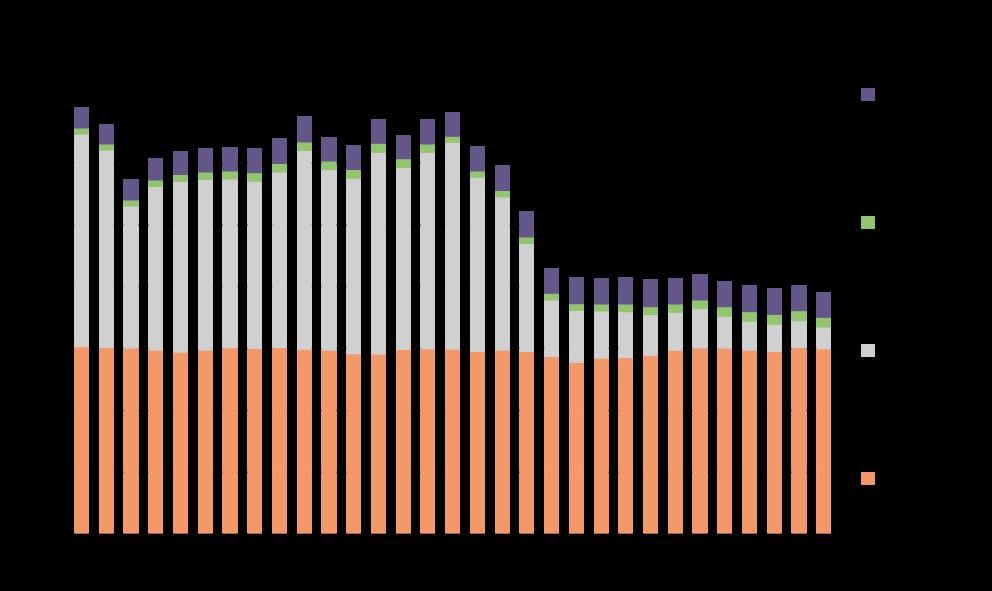
Table 3.3 CO2 emissions (million tonnes) from different source categories, 1990–2020
Year | Stationary combustion | Oil and gas industry | Industrial processes | Road traffic | Coastal traffic and fishing | Other mobile sources | Other sources | Total |
|---|---|---|---|---|---|---|---|---|
1990 | 6.44 | 7.85 | 7.72 | 7.29 | 2.55 | 2.68 | 0.57 | 35.10 |
1995 | 6.49 | 9.48 | 8.19 | 7.40 | 3.25 | 3.22 | 0.48 | 38.51 |
2000 | 5.51 | 12.25 | 9.33 | 8.25 | 3.51 | 2.91 | 0.39 | 42.15 |
2005 | 5.30 | 13.40 | 8.55 | 9.43 | 3.15 | 3.18 | 0.33 | 43.34 |
2010 | 7.14 | 13.32 | 8.03 | 9.90 | 3.43 | 3.61 | 0.25 | 45.69 |
2011 | 6.21 | 13.08 | 8.25 | 9.84 | 3.45 | 3.69 | 0.27 | 44.79 |
2012 | 5.34 | 13.19 | 8.32 | 9.86 | 3.52 | 3.80 | 0.27 | 44.30 |
2013 | 5.45 | 13.16 | 8.35 | 9.91 | 3.53 | 3.89 | 0.28 | 44.59 |
2014 | 5.16 | 13.86 | 8.15 | 10.12 | 3.64 | 3.84 | 0.27 | 45.05 |
2015 | 5.07 | 14.37 | 8.46 | 10.15 | 3.44 | 3.84 | 0.26 | 45.59 |
2016 | 4.99 | 14.06 | 8.35 | 9.88 | 3.32 | 3.89 | 0.27 | 44.76 |
2017 | 5.22 | 13.83 | 8.60 | 9.00 | 3.45 | 3.86 | 0.28 | 44.24 |
2018 | 5.11 | 13.65 | 8.58 | 9.24 | 3.43 | 4.09 | 0.28 | 44.39 |
2019 | 4.79 | 13.46 | 8.21 | 8.60 | 3.58 | 3.87 | 0.26 | 42.78 |
2020 | 4.47 | 12.73 | 8.31 | 8.26 | 3.61 | 3.50 | 0.31 | 41.20 |
Source: Statistics Norway/ Norwegian Environment Agency
28.4 per cent of the total Norwegian CO2 emissions originate from transport5. Of this, about 70.4 per cent originates from road transport. Since 1990, CO2 emissions from transport have increased by 18.4 per cent. CO2 emissions from road transportation increased by 13.0 per cent between 1990 and 2020, although emissions from personal cars decreased by 17.6 per cent.
The petroleum sector emitted 12.7 million tonnes CO2 in 2020, which was 30.9 per cent of total CO2 emissions in Norway. The majority of CO2 emissions from the petroleum sector stems from combustion of natural gas and diesel in turbines on offshore installations. Other CO2 emissions originate from onshore oil and gas terminals and indirectly from NMVOC emissions (process emissions). Total CO2 emissions from the sector have grown year by year up to 2007, primarily as a result of the increased activity level, more mature oil fields and increased gas production and sales. Emissions have been reduced by 12 per cent between 2007 and 2020.
CO2 emissions from industrial processes were 8.3 million tonnes in 2020, an increase of 0.6 million tonnes since 1990.
In 2020, about 61.0 per cent of the CO2 emissions from industrial processes were from metal production. CO2 emissions from metals manufacturing derive primarily from the use of coal, coke and charcoal as a reducing agent, and are therefore primarily dependent on the volume of production. Mineral production accounted for 12.2 per cent and manufacturing of chemicals accounted for 22.5 per cent of the CO2 emissions from industrial processes in 2020.
Figure 3.7 Distribution of CH4 emissions in Norway by sub-categories in 2020

Source: Statistics Norway/Norwegian Environment Agency
CO2 emissions from stationary combustion derive from combustion in onshore industry, energy production and heating in buildings. These emissions constituted 10.9 per cent of the total CO2 emissions in 2020, a decrease of 30.6 per cent compared with 1990. While emissions from electricity production and district heating have increased somewhat during the period, emissions from use of oil for heating has been reduced, resulting in the observed reduction trend in total for stationary combustion.
3.2.1.2 Emissions of methane (CH4 )
The total emissions of methane (CH4) amounted to 188 ktonnes (4.7 million tonnes of CO2 equivalents) in 2020. About 55 per cent of the emissions in 2020 derived from agriculture, primarily releases from enteric fermentation, and about 18 per cent from landfills (Figure 3.6). Combustion and evaporation/leakage related to oil and gas extraction accounted for about 10 per cent of the total emissions in 2020. The category “other sources” includes emissions from petrol cars, domestic heating, coal mining and oil refineries and amounted to 17 per cent in 2020.
Agricultural emissions are relatively stable from year to year. Methane emissions from the agricultural sector amounted to 104 ktonnes in 2020 and constituted about 55 per cent of total Norwegian methane emissions. The emissions were reduced by 6.5 per cent from 1990 to 2020.
During the period 1990–2020, total CH4 emissions decreased by 24 per cent. Figure 3.7 shows that this was primarily caused by decreased emissions from landfills (-59 per cent from 1990 to 2020), which more than compensated for the growth in emissions from the oil and gas industry. The waste volumes increased during the period 1990–2020, but this effect was more than offset by increased recycling and incineration of waste and increased burning of methane from landfills.
Methane emissions in the oil and gas industry accounted for about 19 ktonnes in 2020. These emissions are largely caused by landing and loading of crude oil offshore. Methane emissions from the oil and gas industry have increased by 43 per cent since 1990 due to higher production.
Figure 3.8
Figure 3.9 CH4 emissions in Norway between 1990 and 2020. Unit: ktonnes
Source: Statistics Norway/ Norwegian Environment Agency
3.2.1.3 Emissions of nitrous oxide (N2O)
The total emissions of N2O amounted to 7.8 kilo tonnes (2.3 million tonnes of CO2 equivalents) in 2020. Figure 3.8 shows that about 77 per cent of Norwegian emissions of N2O are of agricultural origin, with agricultural soils as the most prominent contributor. Production of nitric acid takes place at two plants and is one step of the fertiliser production. This production accounts for about 9 per cent of the total N2O emissions. The contribution from road traffic amounted to 4 per cent in 2020. The category “other sources”, which amounted to almost 11 per cent of N2O emissions in 2020, includes emissions from e.g. fuel combustion, manure management, biological treatment of waste and wastewater handling.
Figure 3.10
Figure 3.11 Distribution of Norwegian N2O emissions by major sources in 2020

Source: Statistics Norway/ Norwegian Environment Agency
The emissions of N2O were reduced by about 43 per cent from 1990 to 2020. The emissions were fairly stable through the 1990s, and the major part of this reduction took place after 2005. This was mainly caused by reductions in emissions from nitric acid production, from which emissions were reduced by about 90 per cent from 1990 to 2020. Decreased emissions at the beginning of the 1990s were caused by changes in the production processes, while there was a moderate increase in emissions during the following years owing to increased production volumes. Improvements in the production process brought the emissions down again in 2006. Emissions of N2O from production of nitric acid decreased by about 90 per cent from 2005 to 2020.
Figure 3.12 N2O emissions for major Norwegian sources, 1990–2020. Unit: ktonnes
Source: Statistics Norway/Norwegian Environment Agency
3.2.1.4 Emissions of perfluorochemicals (PFCs)
Aluminium production was the only source of PFC emissions in 2020. Perfluorcarbons tetrafluoromethane (CF4) and hexafluoroethane (C2F6) emissions from Norwegian aluminium plants were reported at 18.3 and 2.1 tonnes respectively, corresponding to a total of 0.16 million tonnes of CO2 equivalents. Total PFCs emissions have decreased by 96 per cent since 1990 following a steady downward trend as illustrated in Figure 3.10.
Improvement of technology and process control in aluminium production led to a significant emissions decrease. In 1990, PFCs emissions were 4.48 tonnes CO2 equivalents per tonne aluminium produced. It was reduced to 0.70 tonnes CO2 equivalents per tonne aluminium produced in 2007 and to 0.12 tonnes CO2 equivalents per tonne aluminium produced in 2020.
Figure 3.13 Emissions (million tonnes CO2-equivalents) of PFCs in Norway, 1990–2020

Source: Statistics Norway/ Norwegian Environment Agency
3.2.1.5 Emissions of sulphur hexafluoride (SF6 )
Until 2006, the largest source of SF6 emissions in Norway was magnesium production. The consumption of SF6 was reduced through the 1990s due to improvements in technology and process management, and to reductions in production levels. In 2020, the SF6 emissions were 96.5 per cent lower than in 1990. Until 2002, SF6 emission reductions were mainly due to the improved technology and process control within the metal industries. In 2002, production of cast magnesium closed down. In 2006, production of secondary magnesium closed down.
The main other use of SF6 is in electrical equipment such as gas insulated switchgears (GIS) and other high-voltage applications. Since the signing of a voluntary agreement in 2002, emissions from these sources have decreased and were about 41.2 per cent lower in 2020 than in 2002.
Figure 3.14 Emissions of SF6 (tonnes) in Norway 1990–2020

Source: Statistics Norway/ Norwegian Environment Agency
3.2.1.6 Emissions of hydrofluorocarbons (HFCs)
The total emissions from HFCs used as substitutes for ozone depleting substances amounted to 0.8 million tonnes of CO2 equivalents in 2020. The emissions in 1990 were insignificant (44 tonnes CO2 equivalents) but have increased substantially over the years. The emissions decreased by 13.3 per cent from 2019 to 2020.
The application category refrigeration and air conditioning contributes by far the largest part of the HFC emissions. The other categories foam/foam blowing agents and fire extinguishers contribute to small amounts of the overall emissions.
Figure 3.12 displays the development of HFC emissions since 1990. The trend is due to the strong demand for substitution of ozone depleting substances. The increase in HFC emissions has been moderated by a recent and rapid decline of emissions from transport refrigeration and industrial refrigeration. The decline was mainly a consequence of restrictions from the EU F-gas regulation (implemented in Norway) which includes restrictions to place on the market refrigeration equipment that contains HFCs with GWP of 2500 and restricts the use of HFC refrigerants with GWP of 2500 or more for servicing and maintenance of refrigeration equipment.
Figure 3.15 Actual emissions of HFCs (million tonnes CO2-equivalents) in Norway, 1990–2020
Source: Statistics Norway/ Norwegian Environment Agency
3.2.1.7 International bunkers
Norway reports emissions from international marine and aviation bunker fuels, but these emissions are not included in the national total, in accordance with the UNFCCC reporting guidelines. They are therefore reported separately as memo items in the NIR and in the CRF.
In 2020, CO2, CH4 and N2O emissions from ships and aircraft in international traffic bunkered in Norway totalled 1.6 million tonnes CO2 equivalents, which corresponds to about 3 per cent of the total Norwegian GHG emissions. The emissions from bunkers have decreased by 48 per cent from 1990 to 2020 and by 44 per cent from 2019 to 2020.
Figure 3.16 Emissions (CO2, CH4 and N2O) from international bunkers, given in million tonnes of CO2 equivalents
Source: Norwegian Environment Agency and Statistics Norway
During the period 1990–2020, emissions from marine bunkers decreased by 56 per cent. The emissions have varied greatly in this period and reached a peak in 1997. Thereafter there has been a descending trend in emissions.
The emissions from international air traffic bunkered in Norway was in 2020 0.5 million tonnes. The emissions in 2020 were about 18 per cent lower than in 1990. This is due to the covid-19 pandemic. In 2020 the emissions were 68 per cent lower than in 2019. In 2019, the emissions from international air traffic bunkered in Norway was almost three times higher than in 1990. However, as aircraft engines are improving their fuel-efficiency, it follows that the increase in international air traffic has in fact been higher than that of the emissions.
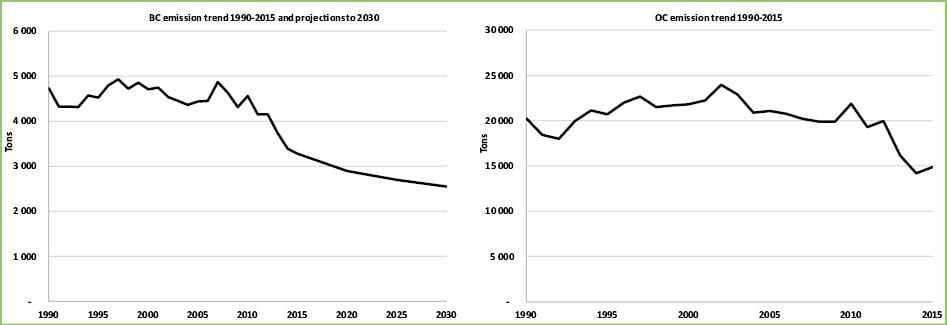
Box 3.1 Black carbon and organic carbon
Black carbon and organic carbon are not regulated under the UNFCCC. On a voluntarily basis, Norway has reported BC annually under the Convention on Long-range Transboundary Air Pollution (LRTAP) since 2015. Norway has also reported BC biannually to the Arctic Council since 2015. In 2013, the Norwegian Environment Agency (NEA) published the first Norwegian emission inventories for black carbon (BC) and organic carbon (OC) in cooperation with Statistics Norway.1 The developed methodology is documented in the report “Emissions of black carbon and organic carbon in Norway 1990–2011”. These two climate forcers are always co-emitted but have the opposite effect on climate. In general, BC warms the climate, while emissions of OC leads to a cooling. The emissions are primarily estimated based on shares of BC and OC of fine particulate matter (PM2.5). Specific emission factors are available for two sources, namely wood combustion in the residential sector and flaring of natural gas onshore and offshore. Uncertainties have not been quantified but are anticipated to be high relative to uncertainties in other more “mature inventories”.
NEA has assessed mitigation measures both in the short- and long term as well as health effects.2,3 The largest single source of BC and OC in Norway is residential wood burning. NEA has therefore contracted experts to measure and analyse emissions from wood burning and suggest mitigation measures.4,5,6 The country specific emission factors are used to develop the inventories.
For flaring emission from off-shore petroleum activity and on-shore refineries, the emission factor was developed based on a study by McEwen and Johnson.7
The emissions of BC and OC in 2020 were 2 907 and 10 304 tonnes respectively. The emission trends 1990–2020 and projections for BC and OC up to 2035 are shown in the figures below.
1.http://www.ssb.no/natur-og-miljo/artikler-og-publikasjoner/_attachment/107884?_ts=13dfd568678
2. Klimakur 2030: https://www.miljodirektoratet.no/globalassets/publikasjoner/m1625/m1625.pdf#page=542
5.https://www.miljodirektoratet.no/globalassets/publikasjoner/m518/m518.pdf
6.https://www.vista-analyse.no/no/publikasjoner/virkemidler-for-a-redusere-utslipp-fra-vedfyring/
7. James D.N. McEwen and Matthew R. Johnson (2012): Black Carbon Particulate Matter Emission Factors for Buoyancy Driven Associated Gas Flares. Journal of the Air & Waste Management Association, Volume 62, 2012, Pages 307-321. http://dx.doi.org/10.1080/10473289.2011.650040
Source: Norwegian Environment Agency and Statistics Norway
3.3 National system / national inventory arrangements
The Norwegian national system for greenhouse gas inventories is based on close cooperation between the Norwegian Environment Agency, Statistics Norway and the Norwegian Institute of Bioeconomy Research (NIBIO). Statistics Norway is responsible for the official statistics on emissions to air. NIBIO is responsible for the calculations of emission and removals from Land Use and Land Use Change and Forestry (LULUCF). An overview of institutional responsibilities and cooperation is shown in Figure 3.14.
Figure 3.17 Overview institutional responsibilities for GHG inventories, Norway.
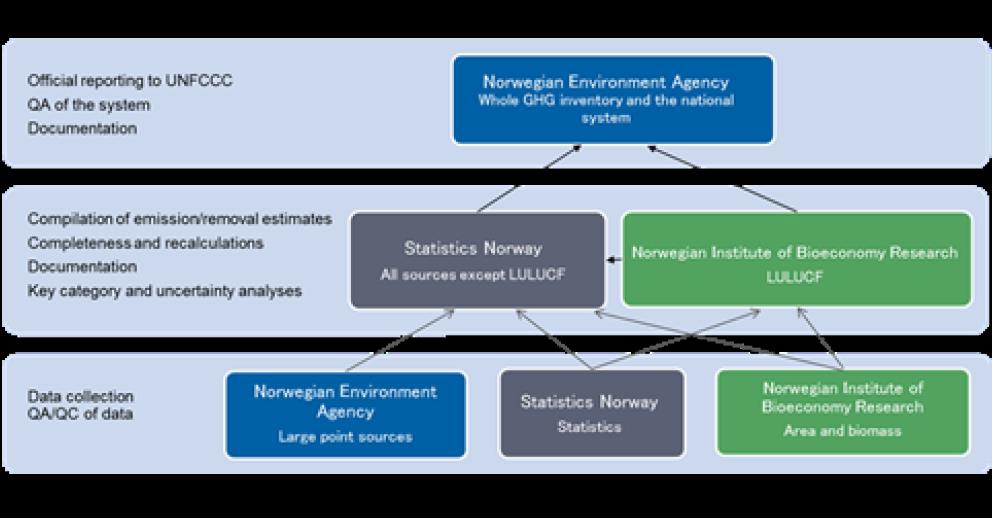
The Norwegian Environment Agency was appointed by the Ministry of Climate and Environment as the national entity pursuant to the Norwegian Government`s Parliament budget proposition for 2006. This appointment was renewed in 2015 through the budget proposition from the Ministry of Environment and Climate to the Norwegian parliament. The budget proposition stated that “The Norwegian system will build on existing organization and cooperation between the Norwegian Environment Agency, Statistics Norway and the Norwegian Institute of Bioeconomy Research. These three institutions are held individually responsible that their own contributions to the national system are in line with the guidelines from the climate convention on the calculation and archiving of emissions and removals of greenhouse gases. The Norwegian Environment Agency is still appointed as a national entity with overall responsibility for the inventory and reporting”. (St. prop. Nr. 1 (2014–2015)). As the national entity, the Norwegian Environment Agency is in charge of approving the inventory before official submission to the UNFCCC.
To ensure that the institutions comply with their responsibilities, Statistics Norway and NIBIO have signed agreements with the Norwegian Environment Agency as the national entity. Through these agreements, the institutions are committed to implementing Quality Assurance/Quality Control (QA/QC) and archiving procedures, providing documentation, making information available for review, and delivering data and information in a timely manner to meet the deadline for reporting to the UNFCCC.
The most updated information about the methods and framework for the production of the emission inventory, as well as changes performed since the previous emission inventory, are given in the Norwegian Inventory Report “Greenhouse Gas Emissions 1990–2020, National Inventory Report” (Norwegian Environment Agency Report M-2268).
The main emission model has been developed by – and is operated by – Statistics Norway. Emissions from road traffic, methane from landfills and emissions of HFC, PFC and SF6 from products and some agriculture emissions are calculated by side models, and are incorporated into the main model along with emissions from point sources collected by the Norwegian Environment Agency.
NIBIO is in charge of estimating emissions and removals from LULUCF for all categories where area statistics are used for activity data. The National Forest Inventory (NFI) database contains data on areas for all land uses and land-use conversions as well as carbon stocks in living biomass, and are, supplemented by some other activity data, the basis for the LULUCF calculations. The NFI utilizes a 5-year cycle based on a re-sampling method of the permanent plots.
Norway has implemented the formal QA/QC plan, according to which all three institutions prepare a QA/QC report annually. On the basis of these reports, the three institutions collaborate on which actions to take to further improve the QA/QC of the inventory.
In the Norwegian greenhouse gas emission inventory key categories are identified by means of approach 1 and approach 2 methods. A description of the methodology as well as background tables and the results from the analyses are presented in the annual National Inventory Report.
The Norwegian greenhouse gas emission inventory has in 2022 been routinely recalculated for the entire time series 1990–2019 for all components and sources, in order to account for new knowledge on activity data and emission factors and to correct errors in the calculations. There is also a continuous process for improving and correcting the inventory and the documentation of the methodologies employed, based on questions and comments received in connection with the annual reviews together with needs of improvements recognised by the Norwegian inventory experts.
In general, the data contained in the Norwegian emission inventory are available to the public, both activity data and emission factors. In terms of spatial coverage, the emission reporting under the UNFCCC covers all activities within Norway’s jurisdiction.
The data collection and data management are secured through three main acts, the Pollution Control Act, the Greenhouse Gas Emissions Trading Act and the Statistics Act.
For a complete description of the national inventory arrangements, see chapter 1.2 of the 2022 NIR. For comprehensive information regarding the national system under the Kyoto Protocol, see Annex V of the NIR. There have been no changes to the national inventory arrangements since Norway’s fourth Biennial Report was reported.
Designated representative – contact information
- Name: Siri Sorteberg
- Position: Director, Department of Climate
- Organisation: Norwegian Environment Agency
- Postal address: P.O. Box 5672 Sluppen, 7485 Trondheim, Norway
- Phone number: +47 73 58 05 00
- Fax number: +47 73 58 05 01
- E-mail address: siri.sorteberg@miljodir.no
3.4 National registry
Directive 2009/29/EC adopted in 2009, which was incorporated in the EEA agreement in July 2012, provides for the centralization of the EU ETS operations into a single European Union registry operated by the European Commission as well as for the inclusion of the aviation sector. At the same time, and with a view to increasing efficiency in the operations of their respective national registries, the EU Member States who are also Parties to the Kyoto Protocol (26) plus Iceland, Liechtenstein and Norway decided to operate their registries in a consolidated manner in accordance with all relevant decisions applicable to the establishment of Party registries – in particular Decision 13/CMP.1 and Decision 24/CP.8. The consolidated platform which implements the national registries in a consolidated manner (including the registry of the EU) is called the Union registry. A complete description of the consolidated registry was provided in the common readiness documentation and specific readiness documentation for the national registry of EU and all consolidating national registries.
Terms of cooperation between the European Commission (Central Administrator) and the national administrators have been agreed by the administrators’ working group. They include common operational procedures for the implementation of the sixth and seventh Registry Regulation (Regulation (EU) No 389/2013 and Regulation (EU) No 2019/1122) and change and incident management procedures for the Union Registry.
Information on the Union Registry
The Union Registry is developed on the basis the following modalities:
- Each Party has the role as National registry administrator and is responsible for all the obligations of Parties that are to be fulfilled through registries;
- The Norwegian Environment Agency is the responsible entity for the administration of Norway’s national emissions trading registry
- Each Kyoto unit issued by the Parties in the consolidated system is issued by one of the constituent Parties and continues to carry the Party of origin identifier and has a unique serial number;
- Each Party retains its own set of national accounts as required by paragraph 21 of the Annex to Decision 15/CMP.1. Each account within a national registry has a unique account number with the country code (ISO 3166-alpha-2) of the Party as a prefix;
- Kyoto transactions is forwarded and checked by the UNFCCC Independent Transaction Log (ITL), which is responsible for verifying the accuracy and validity of those transactions;
- The transaction log and registries reconcile their data with each other in order to ensure data consistency and facilitate the automated checks of the ITL;
- All registries reside on a consolidated IT platform sharing the same infrastructure technologies. The chosen architecture implements modalities to ensure that the consolidated national registries are uniquely identifiable, protected and distinguishable from each other;
- Each national registry connects to the ITL directly and establishes a secure communication link through a consolidated communication channel (VPN tunnel).
- The ITL remains responsible for authenticating the national registries and takes the full and final record of all transactions involving Kyoto units and other administrative processes.
- The consolidated platform is keeping data confidential and protected against unauthorized manipulation.
- The data storage architecture also ensures that the data pertaining to a national registry are distinguishable and uniquely identifiable from the data pertaining to other consolidated national registries.
- Each national registry keeps a distinct user access entry point (URL) and a distinct set of authorisation and configuration rules.
- The detailed security measures cannot be shared in detail, as that would compromise security.
Following the successful implementation of the Union registry, the 28 national registries concerned were re-certified in June 2012 and switched over to their new national registry on 20 June 2012. During the go-live process, all relevant transaction and holdings data were migrated to the Union registry platform, and the individual connections to the ITL were re-established for each National registry.
In the following table, we provide an update on any changes to the Norwegian national registry that have occurred since the last National Communication report. Any changes are reported annually in the National Inventory Report.
Table 3.4 Changes to the Union Registry
Reporting Item | Description |
|---|---|
15/CMP.1 Annex II.E paragraph 32.(a) Change of name or contact | Changes have occurred since 2018, see annual submissions of NIRs. The current registry administrators are Mona Marstrander Rødland, Helga Soppeland Larsen, Åshild Færevåg, Carina Lillestøl, Thomas Pallesen and Tor Egil Tønnessen Kjenn. |
15/CMP.1 Annex II.E paragraph 32.(b) Change regarding cooperation arrangement | In 2021 there was a change in the cooperation arrangement as the United Kingdom of Great Britain and Northern Ireland no longer operate their registry in a consolidated manner within the Consolidated System of EU registries. |
15/CMP.1 Annex II.E paragraph 32.(c) Change to database structure or the capacity of national registry | In 2020 there was a new EUCR release (version 11.5), and some changes were applied to the database. The updated database model is provided each year in Annex A of chapter 14 of Norway’s NIR. No change to the capacity of the national registry occurred during the reported period. |
15/CMP.1 Annex II.E paragraph 32.(d) Change regarding conformance to technical standards | Each release of the registry is subject to both regression testing and tests related to new functionality. These tests also include thorough testing against the DES and are carried out prior to each release of a new version in Production (Annex B of chapter 14 in NIR). The test reports are provided to the UNFCCC as part of the annual inventory submissions. No other change in the registry’s conformance to the technical standards occurred for the reported period. |
15/CMP.1 Annex II.E paragraph 32.(e) Change to discrepancies procedures | No change of discrepancies procedures occurred during the reported period. |
15/CMP.1 Annex II.E paragraph 32.(f) Change regarding security | In January 2022 the mandatory use of software tokens (mobile app) for authentication and signature was introduced for registry users (not administrators). |
15/CMP.1 Annex II.E paragraph 32.(g) Change to list of publicly available information | Publicly available information is provided via the Union registry homepage for Norway: https://unionregistry.ec.europa.eu/euregistry/NO/public/reports/publicReports.xhtml |
15/CMP.1 Annex II.E paragraph 32.(i) Change regarding data integrity measures | No change of data integrity measures occurred during the reporting period. |
15/CMP.1 Annex II.E paragraph 32.(j) Change regarding test results | The site acceptance tests are carried out by quality assurance consultants on behalf of and assisted by the European Commission. The acceptance test report is provided to the UNFCCC in Annex B of chapter 14 of the inventory submission. |
Registry administrators – contact information
The Registry administrator is still within the Norwegian Environment Agency.
- Post address: Postboks 5672 Torgarden, 7485 Trondheim, Norway
- Functional mailbox: kvoteregister@miljodir.no
Publicly available information
Norway is fulfilling the requirements of paragraphs 44 to 48 of the Annex to Decision 13/CMP.1 concerning making non-confidential information accessible to the public. This is done by publishing the information on the Union registry web page. In addition, the Standard Electronic Format reports are available on the national information website of the Norwegian registry: (https://www.miljodirektoratet.no/ansvarsomrader/klima/klimakvoter/public-reports/).
The registry information web page (www.kvoteregister.no) also provides links to the Union Registry web page containing additional public information.
In line with the General Data Protection Regulation (EU) No 2016/679, and in accordance with Article 110 and Annex XIV of Commission Regulation (EU) No 389/2013, the information on account representatives, account holdings, account numbers, legal entity contact information, all transactions made and carbon unit identifiers, held in the EUTL, the Union Registry and any other KP registry (required by paragraph 45 and paragraph 48) is considered confidential. This information is therefore not publicly available.
More information about the accounts and the account holders in the Norwegian registry, can be found on the search pages of EUTL: http://ec.europa.eu/environment/ets/account.do?languageCode=en&account.registryCodes=NO&identifierInReg=&accountHolder=&search=Search&searchType=account¤tSortSettings
Internet address
The internet address of the Norwegian registry has changed since the last National Communication: https://unionregistry.ec.europa.eu/euregistry/NO/index.xhtml
To help our users and the public to easily find registry specific information, the redirecting web address www.kvoteregister.no has been set up. The page redirects a person to the Agency’s subpage https://www.miljodirektoratet.no/ansvarsomrader/klima/klimakvoter/klimakvoteregisteret/