5.7 Assessment of aggregate effects of policies and measures
There are considerable methodological difficulties in calculating the effect of policies and measures ex post, including establishing a hypothetical baseline and obtaining relevant data. There is also uncertainty related to such estimates. Nevertheless, effects are estimated for a number of policies and measures. According to the estimates, the historical GHG emissions (without LULUCF) in 2020 would have been about 24.3 million tonnes of CO2 equivalents higher than observed, if these policies and measures had not been implemented. Similarly, projected GHG emissions (without LULUCF) would be about 34.9 million tonnes higher in 2030 (see Table 5.8 and Figure 5.3).
To arrive at a total the estimated effects of each significant policy and measure are aggregated. The estimated and expected effects of the individual policies which are addressed in chapter 4 are based on studies by various agencies and ministries. Structural policy changes, which might have an indirect impact on emissions, are not estimated. As the electricity supply in Norway is almost entirely based on renewable energy, enhancing energy efficiency and encouraging the use of new renewable energy sources do not necessarily have an impact on emissions in Norway.
Table 5.10
Table 5.11 Effects of policies and measures that have been implemented. Total in ktonnes of CO2 equivalents
2020 | 2025 | 2030 | 2035 | |
|---|---|---|---|---|
Cross sectoral | 2 259.0 | 3 711.3 | 3 928.8 | 3 962.3 |
Petroleum activity | 7 151.0 | 11 167.0 | 10 159.0 | 8 143.0 |
CCS | 0.0 | 400.0 | 800.0 | 800.0 |
Energy and transformation | 540.0 | 580.0 | 595.0 | 545.0 |
Transport | 4 139.0 | 5 822.0 | 7 573.0 | 9 324.0 |
Industry | 9 573.0 | 10 391.0 | 10 652.0 | 10 652.0 |
Agriculture | 13.9 | 15.9 | 18.9 | 20.9 |
LULUCF | 4.0 | 361.0 | 430.0 | 498.0 |
Waste | 614.0 | 714.0 | 793.0 | 856.0 |
Total | 24 293.9 | 33 162.2 | 34 949.7 | 34 801.2 |
Table 5.12 Effects of policies and measures that have been implemented. CO2 in ktonnes
2020 | 2025 | 2030 | 2035 | |
|---|---|---|---|---|
Cross sectoral | 1 659.0 | 3 111.3 | 3 328.8 | 3 362.3 |
Petroleum activity | 7 151.0 | 11 167.0 | 10 159.0 | 8 143.0 |
CCS | 0.0 | 400.0 | 800.0 | 800.0 |
Energy and transformation | 540.0 | 580.0 | 595.0 | 545.0 |
Transport | 4 139.0 | 5 822.0 | 7 573.0 | 9 324.0 |
Industry | 700.0 | 700.0 | 700.0 | 700.0 |
LULUCF | 4.0 | 361.0 | 430.0 | 498.0 |
Total | 14 193.0 | 22 141.3 | 23 585.8 | 23 372.3 |
Table 5.13 Effects of policies and measures that have been implemented. CH4 in ktonnes CO2 equivalents
2020 | 2025 | 2030 | 2035 | |
|---|---|---|---|---|
Waste | 614.0 | 714.0 | 793.0 | 856.0 |
Total | 614.0 | 714.0 | 793.0 | 856.0 |
Table 5.14 Effects of policies and measures that have been implemented. N2O in ktonnes CO2 equivalents
2020 | 2025 | 2030 | 2025 | |
|---|---|---|---|---|
Industry | 2 833.0 | 2 985.0 | 2 985.0 | 2 985.0 |
Agriculture * | 13.9 | 15.9 | 18.9 | 20.9 |
Total | 2 846.9 | 3 000.9 | 3 003.9 | 3 005.9 |
* The effect also includes minor emissions of CH4 and CO2.
Table 5.15 Effects of policies and measures that have been implemented. HFCs in ktonnes CO2 equivalents
2020 | 2025 | 2030 | 2035 | |
|---|---|---|---|---|
Cross sectoral | 600.0 | 600.0 | 600.0 | 600.0 |
Industry | 154.0 | 377.0 | 600.0 | 635.0 |
Total | 754.0 | 977.0 | 1 200.0 | 1 235.0 |
Table 5.16 Effects of policies and measures that have been implemented. PFCs in ktonnes CO2 equivalents
2020 | 2025 | 2030 | 2035 | |
|---|---|---|---|---|
Industry | 5 830.0 | 6 260.0 | 6 300.0 | 6 240.0 |
Total | 5 830.0 | 6 260.0 | 6 300.0 | 6 240.0 |
Table 5.17 Effects of policies and measures that have been implemented. SF6 in ktonnes CO2 equivalents
2020 | 2025 | 2030 | 2035 | |
|---|---|---|---|---|
Industry | 56.0 | 69.0 | 67.0 | 92.0 |
Total | 56.0 | 69.0 | 67.0 | 92.0 |
Figure 5.5 shows the historical GHG emissions without LULUCF for 1990–2020 together with the projections in the with existing measures (WEM) scenario. The projections in the without measures (WOM) scenario are without LULUCF and are based on two data sources. The effects for 1995, 2000, 2005, 2010 and 2015 are from the estimates in the seventh National Communication. The effects for 2020, 2025, 2030 and 2035 are from the estimates of this National Communication (see table 5.8).
Figure 5.7 Actual and projected emissions with and without measures (mill. tonnes CO2 equivalents)
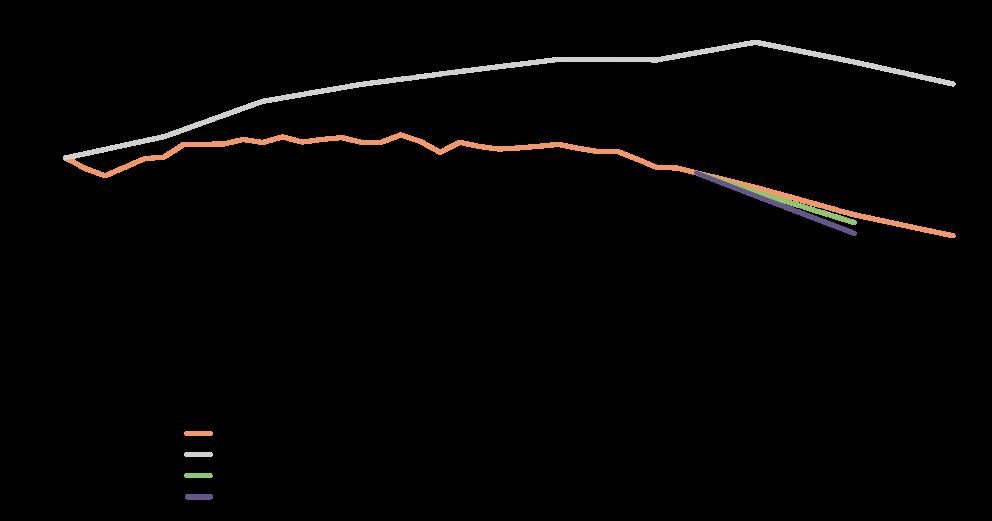
Sources: Statistics Norway, Norwegian Environment Agency and Ministry of Finance.
Figure 5.5 also shows the potential emission reduction that can come as a result of proposed climate measures and policies and measures that are under consideration, see box 4.2. It is estimated that measures proposed in the budget in aggregate can reduce the ESR emissions by 9.3–9.9 million tonnes of CO2 equivalents in the period 2021–2030. The potential effect for 2025 and 2030 are about 1 and 1.7 million tonnes CO2 equivalents respectively and is illustrated by the green line in the figure. A further 10.4 to 11 million tonnes of CO2 equivalents in the period 2021–2030 can come from policies and measures that are under consideration. The potential effect for 2025 and 2030 are about 0.8 and 2.4 million tonnes CO2 equivalents respectively and the incremental effect of this is illustrated by the purple line in the figure. Estimates have only been considered up to 2030.