Distribution weights may be used in cost-benefit analysis to specifically adjust for income distribution effects. The Committee shall assess whether and, if applicable, how income distribution effects shall be included in economic project analysis.
It follows from Chapter 2.3 that the main purpose of cost-benefit analysis is to identify and elucidate the consequences of alternative measures prior to making a decision on which measure to implement. Moreover, it is there stated that in addition to focusing on the economic profitability of measures, the analysis should also aim at describing all consequences assumed to be of importance to the assessment to be made by decision makers, including non-priced effects and the distributional implications of measures. Distributional considerations in cost-benefit analysis were also discussed in Chapter 4.5 of the NOU 1997: 27 Green Paper.
In the present Chapter, the Committee will address more specifically how to include the distribution effects of projects in the cost-benefit analysis.1 This Chapter examines distribution effects internally within one generation. Distributional considerations across generations are discussed in Chapter 5 on the social discount rate. The present Chapter first presents some general perspectives relating to distribution effects and cost-benefit analysis (3.2), before we embark on a more detailed discussion of the use of distribution weights in cost-benefit analysis (3.3). In Chapter 3.4, we discuss various approaches to the inclusion of distribution effects in cost-benefit analysis and the challenges this involves. Thereafter, we provide an overview of guidelines in other countries relating to the presentation of distribution effects (3.5). Finally, we present the assessment of the Committee (3.6) and its recommendations (3.7).
3.2 Distribution effects and cost-benefit analysis
Economic theory tends to identify a division of responsibilities between distribution policy and allocation policy. According to a well-known theorem,2 any efficient distribution can be achieved as an equilibrium under perfect competition if the income distribution existing at the outset can be redistributed without economic costs. If it had been possible to redistribute income through non-distorting taxes, one could therefore have distinguished between policy measures to promote economic efficiency and distribution, respectively (see for example Hagen, 2005). Cost-benefit analysis of public resource use could in such case have focused exclusively on efficiency, or economic profitability, whilst distributional considerations could have been left to tax policy.
However, in real life the assumptions underpinning such a clear distinction between distributional considerations and resource use are not met in full. The economy is characterised by various forms of market failure resulting from deviations from free competition and the existence of public goods and externalities. Moreover, there is only limited scope for redistributing income through non-distorting taxes.
There is general agreement in the economic literature that the distribution effects of the project, as well as the distribution policy of the decision maker, must be taken into consideration to the extent that cost-benefit analysis is to measure changes in society’s welfare (see, inter alia, Boadway, 2006, and Dreze and Stern, 1987). If efficient taxation had been possible, it can be argued that distributional effects of a tax-funded public investment project are of lesser importance on the cost side because these are spread across the entire population through the tax system (NOU 1997: 27 Green Paper). However, it will still be relevant to take the distribution effects on the benefit side into consideration.3
The NOU 2009: 16 Green Paper notes that a cost-benefit analysis based on individuals’ willingness to pay does measure the effects of projects in monetary values (even if these are not restricted to market values), and not in utility or welfare as such. The purpose of such cost-benefit analysis is to organise information relating to key variables for the decision maker prior to an investment or a project decision. However, since the willingness to pay varies with the wealth level of individuals, the rich will systematically carry more weight than the poor in calculating the aggregate net willingness to pay. A cost-benefit analysis may therefore be supplemented by an analysis of the distribution effects. For example, the NOU 1997: 27 Green Paper recommended describing the distribution effects for each individual group in such a way as to provide the decision maker with the best possible basis for taking distribution effects into account in evaluating the project. Besides, the project analyst should describe the robustness of project profitability with regard to different distribution objectives.
Another approach is to handle distribution effects by adjusting the various effects identified in the cost-benefit analysis directly via distribution weights. This means attaching more weight to effects that affect low-income individuals than to effects affecting high-income individuals, if this is in line with society’s preferences. This approach is discussed in more detail in Chapter 3.3 below.
In the same way that the decision maker attaches weight to income disparities, one may wish to attach more weight to specific age brackets, geographic regions or other socio-economic dimensions. Most countries also have legislation intended to counteract various types of discrimination, for which reason consequences of this type are also relevant. Consequently, an analysis of distribution effects should not be restricted to effects on high- and low-income groups. Nevertheless, explicit distribution weights are probably most relevant for purposes of correcting for income disparities.
3.3 Distribution weights
The analysis shall, as noted in Chapter 2.3, form the basis for making decisions, without thereby amounting to an outright decision -making rule. If the findings from a cost-benefit analysis are used to determine what is the best solution for society, it means that the analysis is interpreted normatively. In that case there is a need for examining the normative implications of such an interpretation of the findings. Evidently, this involves making implicit assumptions concerning distribution between individuals. However, one might envisage including distribution weights in the analysis if one would like to adopt other distributional assumptions.
The NOU 1997: 27 Green Paper briefly explains the theoretical assumptions underpinning cost-benefit analysis. Chapter 2 of the present Report provides a condensed summary of the conclusions from the said Green Paper. We will here outline those parts of the theoretical framework that are required to discuss the use of distribution weights in cost-benefit analysis.4
3.3.1 Utility, willingness to pay and social welfare functions
Utility and willingness to pay
We start out by examining the utility concept. This is discussed in all standard microeconomic textbooks. Let us first look at one individual and assume that such individual only cares about her own private consumption, as measured in monetary terms, as well as a public good that may be made available by central government. This may for example be a clean-up measure or other environmental improvement measure, with environmental quality being measured in physical units. Environmental quality is a public good that is available to everyone in society. Utility is a relative measure of needs satisfaction and expresses the preferences of an individual across various combinations of goods; in our example various combinations of the goods private consumption and environmental quality. If a specific combination of these goods is preferred to another specific combination of these same two goods, we can say that the individual’s utility from the preferred combination is higher than her utility from the other combination. However, there is generally speaking not much one can meaningfully say about by how much the individual prefers one combination to the other.5
In cost-benefit analysis, the analyst wishes to compare benefits across different individuals. It is easier to do so in a consistent and systematic manner if the benefits can be measured in the same units. Costs are usually measured in monetary terms. One question is therefore whether a change in individual utility can also be measured in monetary terms. In our example: if environmental quality changes, is it possible to express in monetary value how this affects the utility of the individual?
Textbox 3.1 The relationship between utility and willingness to pay
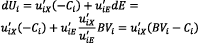
Let Xi be the private consumption of person i as measured in monetary terms, and let E be a measure of environmental quality that is the same for all individuals (a public good), measured in physical units. Furthermore, let us assume that the utility of person i is expressed by Ui, which is a function ui(Xi,E):
(1)
The function is assumed to be upward sloping in both variables. If the private consumption of the individual or the environmental quality increases, utility will also increase. Marginal changes may be expressed by differentiating (1):
(2)
Here d expresses a marginal change in a variable, expresses the change in utility as the result of a one krone increase in private consumption and expresses the change in utility as the result of a one unit increase in environmental quality. In other words, we may say that is the derivative of ui with regard to private consumption. This is often termed the individual’s marginal utility of consumption. Since all consumption is here measured in monetary terms and expressed as one consumption good, we may also consider this to be the marginal utility of income.
The willingness of an individual to pay for an environmental improvement dE is defined as how much the individual will have to reduce her consumption, as measured in monetary terms, in order to get back to the same utility level as before the environmental improvement. This is defined by dUi = 0. Let BVibe the willingness to pay of individual i. The willingness to pay says by how much consumption will have to be reduced to achieve dUi = 0, and consequently dXi = –BVi. If we insert this in (2) and rearrange, we get an expression for the willingness to pay:
(3)
The ratio between two marginal utilities is termed the marginal rate of substitution. is the marginal rate of substitution between environmental goods and consumption, and expresses how much consumption individual i is willing to forgo in return for one more unit of the environmental good and still remain at the same utility level. This is what may be termed the marginal willingness of individual i to pay for the environmental good E. If we envisage a one-unit change in the environmental good, dE, we note from (3) that the willingness to pay for this is the marginal rate of substitution between consumption and the environmental good.
Let us now assume that the individual needs to reduce her consumption by Ci in order to contribute to the funding of the environmental improvement. We express this as dXi = –Ci. By combining (2) and (3) we can then arrive at an expression showing the relationship between the utility effect of a measure, the willingness of the individual to pay and the cost of the measure to such individual:
(4)
We note that the change in utility is proportional to what may be termed the net willingness to pay, which can thus be measured in monetary terms, with the proportionality factor being the individual’s marginal utility of money, which cannot be measured or observed.
One approach is to examine the individual’s willingness to pay. If the environmental quality is improved and such individual’s income and private consumption remain unchanged, the individual will prefer the new situation to the situation prior to the environmental improvement. In other words, she has reached a higher utility level. We may in such a situation ask by how much the individual needs to reduce her consumption, as measured in monetary terms, in order to return to the same utility level as before the environmental improvement. The answer to this question is the individual’s willingness to pay for the relevant environmental improvement.6 Chapter 2.6 briefly discusses various methods for measuring the willingness to pay for goods that are not traded in the market, such as for example environmental goods.
However, willingness to pay does not provide a measure of the individual’s utility effect from the environmental improvement as such. How important a one-unit improvement in the environmental good is for an individual is often referred to as the individual’s marginal utility of the environmental good. Correspondingly, the marginal utility of consumption expresses how important a one-krone consumption increase is to the individual. The willingness to pay for the environmental good may be expressed as the ratio between these two marginal utilities, and it therefore provides information about how important the environmental good is relative to money. It follows from this definition that a high willingness to pay may both mean that the environmental good is important to the individual and/or that money is of minor importance. Let us now assume that the individual must contribute to funding the environmental improvement through somewhat reduced private consumption, for example in the form of a tax. Since both the willingness to pay and private consumption are measured in monetary terms, these can be compared. The willingness to pay less the consumption reduction may then be termed the individual’s net willingness to pay for the environmental improvement. However, the magnitude of the utility change experienced by the individual as a result of the measure depends on how important one extra krone is for her, i.e. on the individual’s marginal utility of income. The relationship between utility and willingness to pay is examined in more technical terms in Box 3.1.
Social welfare functions
One may envisage society’s welfare being expressed as a function of the utility of the members of society. This function may depend both on the utility level of the individuals in society and on how such utility is distributed between the individuals.7 Society’s welfare must here be understood as a normative concept that is intended to capture how “good” a society is. Consequently, there is in practice no one “correct” or “true” social welfare function, unless one believes in the existence of one “correct” or “true” answer to what constitutes a good society. This raises both ethical and philosophical questions. Hence, a social welfare function may therefore be considered to be an expression of an ethical stance or of specific political priorities on the part of a decision maker.
Let us now use the concept of social welfare functions to examine the effects of a marginal project. The project will have two effects on society’s welfare. The first effect relates to how important the utility of the affected individuals is considered to be in the social welfare function. The second effect relates to how much change there is in the utility of such individuals. As explained above, the utility of the individuals will change through their net willingness to pay for the project and their marginal utility of income.
3.3.2 Distribution weights and cost-benefit analysis
The total weight attributed to an individual’s or a group’s net willingness to pay may be termed a welfare weight or distribution weight. This is the term referred to in the following sentence in the terms of reference of the Committee: “Distribution weights may be used in cost-benefit analysis to specifically adjust for income distribution effects”. A more technical presentation is set out in Box 3.2. We have shown there that the distribution weights comprise two components. The first reflects how important money is on the margin for the affected individual, i.e. the individual’s marginal utility of income. The second reflects how important a marginal change in the utility of the affected individual is considered to be from the perspective of overall welfare.
This section will examine these two components of distribution weights.
Textbox 3.2 Social welfare functions and distribution weights
A social welfare function may be written as follows:
(5)
where W is a measure of welfare in society, n is the number of individuals in society, and Ui is defined in Box 3.1. V is usually assumed to be increasing in Ui for all i = (1, ..., n).
If we differentiate (5), we get
(6) +...+.
Equation (6) states that the change in welfare is a weighted sum of the utility changes. The weight expresses the importance attributed to the change in the utility of individual i. If we use the expression from (4) in Box 3.1 above, which stated that , we get
(7) where .
The weight attributed to each individual’s net willingness to pay, (BVi – Ci), is expressed as . Hence, the change in welfare resulting from a project is a weighted sum of individuals’ net willingness to pay for the project. This weight, , is the one referred to when the terms of reference refer to “distribution weights”.
It follows from (7) that an unweighted sum of individuals’ net willingness to pay will only express total welfare change if is the same for all i. Cost-benefit analysis provides us with an unweighted sum of the individuals’ willingness to pay less the cost of the measure. This corresponds to letting for all i, which implies that If the marginal utility of income ( the denominator) is lower the richer you are, this implies that is higher for the rich than for the poor. Thus, in the social welfare function more weight is attached to changes in utility on the part of rich individuals compared to changes in utility on the part of poor individuals. If such a perspective on distribution is not shared by the decision maker, cost-benefit analysis cannot be directly interpreted as a normative expression of the overall change in welfare.
The marginal utility of income
The marginal utility of income of the individuals in society expresses by how much a person’s utility increases when her income increases by one krone. This may be approached as a descriptive, and not a normative, problem. However, we noted in 3.3.1 that the standard utility concept in economics only expresses whether an individual prefers one combination of goods to another, and cannot be used to say anything about by how much one combination of goods is preferred to another (utility is ordinal, but not cardinal). If a utility estimate shall be used to say anything about several individuals it must also be comparable across individuals. This requires the utility of a good to be measured in absolute value, not only relative to another good. This necessitates a different utility concept than is normally used in economics. Several attempts have been made at establishing methods for the measurement of utility levels that are both cardinal and comparable across individuals, but no generally accepted method currently exists (Nyborg, 2012).
We can nevertheless make some assumptions that can tell us something about the shape of the utility function of each individual. If more of a good increases utility, we know that marginal utility is positive. If one values a unit of a good more when one has little of it from before, we know that the marginal utility decreases the more one has of such good. Provided that these assumptions hold true for consumption and income, a rich individual will derive less “enjoyment” from one additional krone than will a poor individual. If we also assume that all individuals have the same comparable utility function, we may say that a rich person derives less “enjoyment” from one additional krone than does a poor person.
Many different attempts have been made at anchoring the choice of welfare weights in observed behaviour. One example is studies based on the tax system. Such studies assume that the progressivity of the current tax system represents central government’s views as to what is the “appropriate” distribution, and a social welfare function is derived from the tax system. Such studies seek to identify society’s valuation of one additional krone for each individual, and hence no distinction is made between the individual’s valuation of one additional krone and society’s valuation of each individual’s utility as such.8 Taking this approach, and based on assumptions implied thereby, Cowell and Gardiner (1999) find, for example, that the British tax system in the late 1990s implied that if the income of a household increased by one percent, the marginal utility of income was reduced by between 1.28 and 1.43 percent, when viewed from the perspective of central government. Cowell and Gardiner (1999) also report that if they use estimates for the risk aversion of individuals to represent society’s distribution preferences, they find values in the region of one percent.9 By using various indirect methods, including the tax approach, Evans (2005) takes the view that a value in the region of 1 percent will be an appropriate approach to the aversion against inequality reflected in current policy in the United Kingdom. However, a joint characteristic of these various approaches is that they are based on many strict assumptions that may be difficult to penetrate. If these assumptions are accepted it will still be legitimate for a decision maker to want to base her assessments on a social welfare function that differs from the social welfare functions that can be derived from current policy.
Studies within behavioural economics, neuroeconomics and happiness research have tried alternative methods for analysing the marginal utility of income (see, inter alia, Layard et al., 2008, and Oswald 2008). Findings from such studies may be used to get an indication of the possible magnitude and how it depends on factors like income level, health, gender, socio-economic status, etc. Layard et al. (2008) for example, use large data sets on self-reported happiness levels from 50 countries for the period from 1972 to 2005, and conclude that if the income of a household increases by 1 percent, the marginal utility of income is reduced by 1.26 percent. In other words, their findings indicate that a person’s marginal utility of income depends on her income level, and that it declines quite steeply. However, Oswald (2008) notes that such conclusions require us to equate happiness with utility, and that the numerical scale used in the happiness questionnaires provides reasonable linear happiness measures. If enquiring about happiness on a scale from 1 to 6, an increase from happiness level 2 to 3 is for example considered as good as an increase from happiness level 5 to 6.
Society’s valuation of the changes in utility on the part of individuals
The second component of a distribution weight specifies how much weight shall be attached to the utility of the various individuals in society. This is a purely normative assessment. Two decision makers who have exactly the same understanding as far as the actual consequences of a measure are concerned, may differ in their assessments of such measure because they attribute different social weight to these consequences. Such differences may for example reflect their opinions with regard to distribution. One may in such case say that the two decision makers have different preferences that may be expressed through two different social welfare functions. If a specific social welfare function is used to examine the welfare effect of a measure, the findings will therefore only be useful as an indicator of whether such measure is “good” for persons who share the distribution preferences underlying the chosen social welfare function. The NOU 1997: 27 Green Paper provides a more general discussion of different social welfare functions.10
Although we are here discussing the issue based on a situation with one decision maker, reality tends to be more complex. A bureaucracy or a democratic process will involve many agents who need to reach agreement about a conclusion. These agents may have diverging perspectives on what constitutes a good society, and implicitly base their assessments on different social welfare functions. The final decision will typically be made in fairly complex strategic situations. Such situations may also well involve distributional requirements deriving from laws and regulations. These requirements may be interpreted as side conditions, subject to which a social welfare function is to be maximised, whilst the said laws and regulations were adopted on the basis of certain distributional preferences. One may also envisage different political parties systematically tending to favour different social welfare functions. It will not necessarily be possible to incorporate diverging perspectives on what constitutes a good society in one set of distribution weights. The complex decision situation with regard to public projects does instead suggest that cost-benefit analysis should be conducted in such a way as to provide a basis for making decisions that is useful for decision makers with different distribution preferences (Nyborg, 2012).
Distribution weights and cost-benefit analysis – a summary
The discussion thus far in the present Chapter has shown that a distribution weight comprises two components. One component may be considered descriptive, but cannot be estimated without making rigid assumptions. The other component is purely normative. Consequently, it is not possible to define distribution weights for use in cost-benefit analysis without making assumptions that are hard to verify empirically. Intuitively, this reflects a simple principle: The extent to which an actual effect contributes to a better society is a question that will, by its very nature, depend on discretionary as well as normative assessments.
A cost-benefit analysis without the use of distribution weights provides an unweighted total of willingness to pay and costs. This should not be confused with a normative measure of society’s welfare. If the rich derive less utility from one additional krone than do the poor, it will only be appropriate to use an unweighted cost-benefit analysis as a normative measure of changes in welfare if one accepts a social welfare function that attaches more weight to changes in the utility of the rich than of the poor.
The current definition of economic profitability, as set out in Chapter 2.2, is as follows:
Cost-benefit analysis, as a specific method of analysis, involves the valuation, to the extent feasible, of all positive and negative effects of a measure, based on the fundamental principle that the value of a consequence is what the population as a whole would be willing to pay to achieve it. If the willingness to pay for all benefits emanating from the measure exceeds its total costs, such measure is defined to be economically profitable (NOU 2009: 16 Green Paper).
Using the terminology we have introduced in the present Chapter, we note that this definition does not in itself say that economic profitability is a normative expression of how a measure influences society’s welfare. Economic profitability, as defined in Chapter 2.2, tells us whether the aggregate willingness to pay for those effects that can be quantified in monetary terms exceeds those aggregate costs than can be quantified in monetary terms. The above discussion shows that a normative interpretation of economic profitability can only be based on very restrictive assumptions.
3.4 Presentation of distribution effects in the analysis
Chapter 3.3 addressed the use of distribution weights. If one does not make use of explicit distribution weights, distribution effects may be presented more directly. We will here provide a more specific discussion of various approaches to presenting distribution effects in the cost-benefit analysis and the challenges posed by such approaches.
3.4.1 Can we know what the distribution effects are?
If seeking to analyse distribution effects, one first needs to take a view on whether it is at all possible to perform such an analysis. There will be cases when a cost-benefit analysis can be carried out, but not a distribution analysis.
A key aspect concerns wider impacts, as discussed in Chapter 7. Although one frequently examines the economic effects in the primary market where the project is implemented, a distribution analysis necessitates the examination of the effects where these eventually end up. For example, we primarily measure the utility of a new road by looking at travel time savings, but these time gains are subsequently spread via taxes, land prices, etc., to other people in the affected communities. A complete distribution analysis must examine the final effects resulting from the road investment. In principle, this will only be possible within the framework of a general equilibrium model, and falls outside the scope of what can normally be elucidated through a cost-benefit analysis. If such wider impacts are significant, neither weighting of the direct effects, nor a more explicit distribution analysis of the direct effects, will convey a correct picture of the project consequences. The problem of partial distribution analysis will become more pronounced the larger the wider impacts of the project are assumed to be. One may note that this pertains to all wider impacts, both those that only involve redistribution of the direct effects and those that influence net economic profitability, defined as net wider impacts in Chapter 7; Wider impacts in the transportation sector.
It may also be that the final distribution effects do not only depend on redistribution of the original gains from the project, but on dynamic effects influenced by the project in a lifetime perspective. This may, for example, be the case within the education sector. Such analysis will often fall outside the natural scope of an ordinary cost-benefit analysis. However, if the measure under consideration is primarily motivated by redistribution, such an analysis will be necessary.
Furthermore, it will often be the case that the analyst does not have data about individual persons affected by the project. For road traffic one will, for example, normally proceed on the basis of traffic measurements that do not say much about individual road users. These tend to only distinguish between different types of vehicle. Hence, an analysis seeking to show how the effects are distributed across various income groups requires the gathering of – in some cases extensive – additional data over and above those that form the basis for an ordinary cost-benefit analysis. If the cost-benefit analysis is to be corrected for distribution effects, it is a requirement that the unweighted profitability is the sum of affected individuals’ willingness to pay. In practice, however, the transportation sector tends to use the average willingness to pay across different groups. As discussed in Chapter 4, transportation bodies in Norway do for example apply the same values of travel time for travels throughout the country irrespective of project type. Since the magnitude of several unit prices, including values of time, will be proportional to wage income, the Ministry of Transport and Communications takes the view that areas with high mean income will undoubtedly have a higher willingness to pay, and thus higher estimated unit prices. Hence, using mean figures is a form of implicit distributive welfare weighting.
3.4.2 Presentation of distribution effects
HEATCO (2006) is an EU project for harmonising the valuation of transportation projects. Its report from 2006 notes that three main methods are used in EU countries to take distribution effects into account, either in the actual cost-benefit calculation, or as a supplement: 1) distribution weighting, 2) presentation of benefits and costs by different income groups and 3) stakeholder analysis. This forms the basis for the discussion below, where we address each of these approaches.
Distribution weighting
One approach to handling the issue of distribution is, according to Boadway (2006), to state explicit assumptions with regard to distribution preferences and assume that all individuals have corresponding and comparable utility functions. On this basis, the cost-benefit analysis is carried out with explicit distribution weights. Thereafter, one may perform sensitivity analyses to examine how the findings change when using different weights. The decision maker will then see how different measures are ranked for different distribution weights. Boadway (2006) notes that one will in such contexts often combine considerations with regard to the marginal utility of income and the shape of the social welfare function into one parameter that expresses aversion against income disparities. This parameter forms the basis for the distribution weights.
Chapter 3.3 discussed methodological and normative problems relating to the use of distribution weights. Chapter 3.4.1 noted that wider impacts may mean that distribution weighting does not appropriately correct for the distribution effects of the project, even in case of agreement as to the weights applied. The problem that one often will not have data on the income of the individuals influenced by the project is also noted.
Presentation of benefits and costs by different income groups
If one is in possession of information on the expected income of those who are affected by a project, one may present benefits and costs by different income groups. In such a presentation it is important to be clear about which income measure is being used. Moreover, it needs to be taken into consideration that income is often presented at household level, whilst effects in cost-benefit analysis are often estimated at the level of the individual.
A practical approach that is recommended, inter alia, in the United Kingdom, is to divide the population into income quintiles. This involves determining what income interval the fifth with the lowest income falls into, which income interval the next fifth falls into, etc. Thereafter the costs and benefits can be specified for each of these quintiles in a table and the like.
As noted in Chapter 3.4.1 above, one will often lack information about the income of the individuals affected by the project. The problem of wider impacts will also apply here. Another approach is therefore to conduct an analysis of those groups that may be assumed to gain or lose from the project. This is termed stakeholder analysis below.
Stakeholder analysis
Stakeholders may be defined as persons or organisations that contribute to, or may be affected by, a measure, directly or indirectly (Ministry of Finance, 2008). Under the central government quality assurance regime, central government projects with an expected cost in excess of NOK 750 million are subjected to external quality assurance of concept choice (QA1) before a decision is made with regard to further planning. The projects shall undergo external quality assurance as to the cost budget and project management documentation (QA2) before it is decided whether to implement the project. QA1 requires a needs analysis, which shall include the identification of stakeholders through a stakeholder analysis. Under QA1, the stakeholder analysis and the needs analysis precede the assessment of requirements, restrictions and possibilities, the establishment of various alternatives and the cost-benefit analysis of these.
If one would like to analyse the distribution effects of a project, one approach may be to identify stakeholders in a stakeholder analysis as mentioned above. The cost-benefit analysis may then be supplemented by an analysis of distribution effects based on the stakeholder analysis. This may be presented as an overview of which groups can be expected to gain or possibly lose from the project in question. The categorisation of stakeholders will have to be decided on in view of the specific character of each project. It may also be based on the various categories identified in the cost-benefit analysis as well as the identification of stakeholders in similar projects. The lack of sufficient data to assess the consequences for a specific stakeholder would in itself be information of relevance to the decision maker.
3.5 Guidelines for the presentation of distribution effects in other countries
3.5.1 United Kingdom
The cost-benefit analysis guidelines in the United Kingdom are laid down in the so-called “Green Book”, which was published by Her Majesty's Treasury in 2003 (HM Treasury, 2003).
These guidelines recommend performing an analysis of how the costs and benefits of a measure are distributed across various socio-economic groups. It is noted that relevant groups may be specified on the basis of income, gender, ethnicity, age, geography or disability.
It is specifically noted that analysis should show how benefits and costs are distributed across various income groups. The guide presents two tables showing income per household across five quintiles and different types of households. It is observed that the groups specified in these tables may form an appropriate basis for such analysis.
It is further recommended that additional analysis of distribution effects may be carried out by using explicit distribution weights. It is stated that benefits accruing to households with relatively low income should be accorded more weight than benefits accruing to households with higher income. This will influence the findings from the cost-benefit analysis. The guide observes that benefits and costs measured in monetary terms should in principle be weighted on the basis of the income level of those who carry the costs or enjoy the benefits. However, it is noted that sufficient information to perform such an analysis will in many cases not be available at an acceptable cost. Whether to use distribution weights should be examined on the basis of three criteria: 1) the magnitude of the effects, 2) the probable robustness of the calculation of the specific distribution weights, and 3) the type of project under analysis. If distribution weights are not used, the guide requires the reasons for this to be explained as part of the analysis.
The guide presents a method for determining distribution weights for use in the analysis. Reference is made to summaries of empirical studies of the magnitude of the effect of the income level on the marginal utility of income, which according to HM Treasury (2003) are consistent with the assumption that the elasticity of the marginal utility of income is 1.11 An elasticity of 1 is consistent with a logarithmic utility function U = log C, where C is consumption. The marginal utility will then be 1/C. It is noted that one method for constructing distribution weights is to start out from an analysis in which benefits and costs are specified by quintiles. A distribution weight can then be attributed to each quintile, and a weighted total can be calculated. The distribution weight may be specified as the marginal utility for a household with median income in each quintile as a percentage of the marginal utility of a household with the median income of the overall population. Using British data, the resulting distribution weights are in the region of 0.4 to 2.3. This approach means that the willingness to pay for the good can be grouped on the basis of which income quintile each person reporting her willingness to pay belongs to, and that thereafter the willingness to pay of each the group may be weighed using the distribution weights. The British guide does not distinguish between what we above have termed the marginal utility of income and the decision maker’s valuation of the utility of individuals. As noted in 3.3.2, the estimates referred to in the British guide are obtained from studies of the aversion against income disparities as reflected in current policy.
3.5.2 HEATCO (EU)
As discussed in 3.4.2 above, HEATCO (2006) is an EU project for harmonising the valuation of transportation projects, which notes that three main methods are used in EU countries to take distribution effects into account, either in the actual cost-benefit calculation, or as a supplement: 1) distribution weighting, 2) presentation of benefits and costs by different income groups, and 3) stakeholder analysis.
It is emphasised that a presentation of benefits and costs by income groups enables the decision maker to assess whether the distribution effects of a measure are acceptable. However, it is noted that such a method requires highly detailed data, which implies that it is rarely used in practice. A simpler and more practical way of presenting information on the distribution effects of a project is to provide an overview of project winners and losers based on categories that are more readily established, like for example geography, private sector vs. public sector, etc.
It is recommended, as a minimum, to prepare a table of winners and losers to supplement the findings from a cost-benefit analysis. To the extent data are available, the decision maker should be presented with a specification of benefits and costs by income groups. If deemed useful and worthwhile in terms of the resources required, findings using distribution weights may be presented in the form of a sensitivity analysis.
3.5.3 Sweden
An updated recommendation addresses how considerations relating to distribution and equal opportunities shall be dealt with in cost-benefit analysis within the transportation sector in Sweden (Swedish Transport Administration, 2012). For projects of special importance, as defined in the Swedish guidelines, a so-called “cumulative effects assessment” is required to be prepared in Sweden. This is a standardised approach to the presentation of economic profitability, distribution effects and the realisation of transportation policy objectives, respectively, summarised in a defined two-page format. It is recommended that this approach be used to shed light on aspects relating to equal opportunities and distribution.
This format presents the distribution analysis in terms of how the effects of the measure are distributed across various groups in society, including, inter alia, by gender, age, geographic area, type of traffic and disabilities. It is noted that this is in line with HEATCO’s minimum requirements for addressing distribution effects, cf. the above discussion.
Several reasons are given for not recommending the use of explicit distribution weights. It is noted that distribution effects are, in the absence of generally accepted weights, better presented by separately explaining how the effects are distributed across various groups. Moreover, it is noted that the use of distribution weights makes it difficult for the decision maker to weigh what is “efficient” against her evaluation of the distribution effects. Finally, it is noted that it is difficult to know what will be the final distribution effects of measure, since these are the result of interactions through the markets and through the tax and transfer system.
3.6 The assessment of the Committee
Cost-benefit analysis is not a tool for making direct normative recommendations, but rather an indicator that must normally be supplemented by other information, such as, inter alia, the assessment of anticipated distribution effects. Generally speaking, a cost-benefit analysis measures the effects of projects and measures in monetary values (although these need not be restricted to market values), and not utility or welfare as such. Cost-benefit analysis only measures the net effect of various measures on society’s welfare under the assumption that, from the perspective of society, one additional krone is considered equally important for all affected individuals. This is, as pointed out in the NOU 2009: 16 Green Paper, a controversial assumption, that can hardly be expected to reflect a complete consensus. Normative recommendations on the basis of cost-benefit analysis must be expected to be equally controversial when the projects entail distribution effects that are not dealt with through other policy measures. It is worth noticing in this context that the controversial aspect of a normative interpretation of cost-benefit analysis, as discussed in the analysis above, is not primarily related to any potential contribution the project may make to changing the income distribution in society. It is rather that a normative interpretation of the cost-benefit analyses implies a specific stance with regard to how different interests shall be weighted when these are in conflict – even if the project entails insignificant changes in the distribution of income or utility in society. Generally speaking, the decision maker should therefore receive information about which conflicts of interest the project gives rise to, thus enabling her to evaluate for herself how to address the resulting tradeoffs.
In the present Chapter, we have discussed the use of explicit distribution weights in cost-benefit analysis as a method of adjusting for the distributional consequences of measures in the analysis. If generally accepted distribution weights existed, it would have been easier to recommend normative interpretation of the analysis. Such weights are a product of the marginal importance of money to each individual and how important a marginal change in utility on the part of the affected individual is deemed to be in terms of overall welfare, as seen from the perspective of the decision maker. The latter reflects the decision maker’s social welfare function, i.e. her views about what characterises a good society.
The discussion in this Chapter has shown that distribution weights cannot be determined without making assumptions about the normative perspective of the decision maker and the marginal utility of money. No established method for determining individual’s marginal utility of money exists, whilst defining a social welfare function is a purely normative exercise. Besides, an actual decision-making process tends to be a complex strategic situation involving several agents with diverging perspectives on distribution. Even if one were to agree on the normative aspects of the matter, we would nevertheless be left with the problem that we have no generally accepted and objective method for determining individuals’ marginal utility of money. Establishing explicit distribution weights for use in cost-benefit analysis therefore requires strict assumptions that do not readily lend themselves to empirical testing. Normative interpretation of an unweighted cost-benefit analysis involves applying an implicit distribution weight equal to 1 for all individuals. Such implicit distribution weights suffer from exactly the same problems as do explicitly defined distribution weights.
The cost-benefit analysis framework should be such as to enable the analyses to provide the best possible informational basis for the decision maker, irrespective of her political and ethical views. This means that the calculations should be as easy as possible to understand, and that the assumptions underpinning the analysis should be clearly indicated. The Committee therefore holds the view that the cost-benefit analysis of public projects should not primarily seek to estimate a project’s contribution to society’s welfare. The main reason for this is that the answer to such a question would only be of relevance to individuals who share the normative perspectives on which the applied distribution weights, implicit or explicit, are premised.
This view implies, firstly, that the Committee will not recommend explicit distribution weights in cost-benefit analysis. However, it also implies that the estimated economic profitability of projects, as calculated in ordinary cost-benefit analysis without explicit welfare weights, cannot readily be interpreted normatively. The latter also applies to projects with only limited distribution effects and/or no redistributive purpose. Hence, the view expressed by the Committee implies that economic profitability shall be interpreted as a summary measure of what the population as a whole is willing to pay for a project, and not as a measure of what is in the best interest of society in the wider sense, as discussed in Box 3.2.
The Committee therefore agrees with the suggestion in the NOU 2009: 16 Green Paper that it may be useful to consider cost-benefit analysis a tool for organising information on effects, rather than as a tool for direct normative recommendations. The estimated economic profitability must then be considered an indicator that will normally have to be supplemented by other information, prior to making final decisions.
In order to provide the best possible informational basis for the decision maker, the Committee therefore takes the view that cost-benefit analysis should seek to describe economic profitability, non-priced effects (whenever possible), as well as the distributional implications of measures, as discussed in Chapter 2.3. This approach is in line with current cost-benefit analysis guidelines in Norway. As recommended in HEATCO (2006), the distributional consequences may for example be summarised as a list of winners and losers supplementing the findings from a cost-benefit analysis, i.e. a type of stakeholder analysis. One may also prepare a presentation of benefits and costs specified by income groups to the extent that data are available. If one has the data and capacity required to incorporate explicit distribution weights, one may in the form of a sensitivity analysis present what impact different levels of aversion against inequality will have for the ranking of projects.
The Committee has noted that it will in some situations be possible to perform a cost-benefit analysis, but not a distribution analysis, because it may be difficult to estimate, within a project analysis framework, which groups are affected, and the degree to which these are affected, by the final effects. The analyst should be conscious of this when performing analyses of the distribution effects.
3.7 Summary recommendations
Based on the discussion in the present Chapter, the Committee makes the following recommendations:
Cost-benefit analysis should continue to estimate the aggregate, unweighted willingness to pay. In other words, explicit distribution weighting is not recommended.
The Committee holds the view that economic profitability shall be interpreted as a summary measure of the net amount the population as a whole is willing to pay for a project, and not as a measure of what is in the best interest of society in a wider sense. This implies that the estimated economic profitability of projects, as calculated in ordinary cost-benefit analysis without explicit welfare weights, cannot in itself be interpreted normatively as a matter of course.
The distribution effects for especially affected groups, including any conflicts of interest, should be examined and discussed in a manner providing the decision maker with the best possible basis for taking these into consideration when assessing the public measure. It should be explained how different objectives with regard to distribution and conflicts of interest may influence the desirability of implementing the measure.
3.8 Bibliography
Boadway, R. (2006). Principles of cost-benefit analysis. Public Policy Review, Vol. 2, No. 1.
Cowell, F.A. and Gardiner, K. (1999). Welfare weights (STICERD), London School of Economics Research Paper 20, London School of Economics, London, August.
Evans, D. (2005). The marginal social valuation of income for the UK. Journal of Economic Studies, 35, (1,), 26-43.
Hagen, Kåre P. (2005). Economic Policy and Economic Profitability. Cappelen Academic Publishers. (In Norwegian only. Norwegian title: Økonomisk politikk og samfunnsøkonomisk lønnsomhet.)
Hanemann, W. M. (1991). Willingness to Pay and Willingness to Accept: How Much Can They Differ? The American Economic Review, 81 (3), 635-647.
HEATCO (2006). Deliverable 5. Proposal for Harmonised Guidelines. Report, Developing Harmonised European Approaches for Transport Costing and Project Assessment.
HM Treasury (2003). Appraisal and Evaluation in Central Government (The Green Book), HMSO, London.
Kaplow, L. (2008). The Theory of Taxation and Public Economics, Princeton and Oxford: Princeton University Press.
Layard, R., G. Mayraz and S. Nickell (2008). The marginal utility of income, Journal of Public Economics 92, 1846-1857.
Ministry of Finance (2008). Commonly Used Terms QA1. Guide No. 3. (In Norwegian only. Norwegian title: Felles begrepsapparat KS1. Veileder nr. 3.)
NOU 1997: 27 Green Paper, Cost-Benefit Analysis. (In Norwegian only. Norwegian title: Nytte-kostnadsanalyser.)
NOU 2009: 16 Green Paper, Global Environmental Challenges – Norwegian Policy. (In Norwegian only. Norwegian title: Globale miljøutfordringer – norsk politikk.)
Nyborg, K. (2012). The Ethics and Politics of Environmental Cost-Benefit Analysis. Routledge.
Oswald, A.J. (2008). On the curvature of the reporting function from objective reality to subjective feelings. Economics Letters, 100 (3), 369-372.
Pearce, D. and Ulph, D. (1995). ‘A social discount rate for the UK’, University of East Anglia, School of Environmental Studies, CSERGE, Working Paper No. 95-01.
Sen, A. (1979). Utilitarianism and Welfarism. Journal of Philosophy, 76 (9) 463-489.
Swedish Transport Administration (2012). Economic Principles and Estimates for the Transportation Sector in ASEK 5. (In Swedish only. Swedish title: Samhällsekonomiske principer och kalkylvärden för transportsektoren i ASEK 5.)
The NOU 1997: 27 Green Paper notes that certain reforms can often have the opposite implication. These will entail effects that are spread throughout the entire population, whilst the costs are often carried by a small number of people.
We here assume that the project is “small” in the sense that it only causes changes that are too minor to influence market prices, cf. the discussion in Chapter 2.8, Partial and general equilibrium models, and also that it is too small to change the individual’s marginal willingness to pay. If the latter assumption does not apply, it may be of importance whether one asks about willingness to pay or compensation claims (Hanemann, 1991).
How good a society is may also depend on other things than individual utility. Reference is made to Sen (1979), Kaplow (2008) and Nyborg (2012) for a more detailed discussion of this.
In technical terms this involves estimating the product of u’ and V’, as these are defined in Box 3.2 on social welfare functions and distribution weights.