2.2 The Norwegian economy
Activity growth in the Norwegian economy increased last year, but the pace of growth has slowed somewhat over the past year. Growth is expected to increase again ahead, particularly because purchasing power developments provide a basis for higher private consumption. At the same time, the Norwegian economy is affected by turbulence globally. Inflation and interest rate expectations in Norway have also picked up since early in the year. Consumer price inflation is above the inflation target, and since winter Norges Bank has adjusted its course from planning for further interest rate cuts to raising the interest rate and signalling that more interest rate increases may be forthcoming. Heightened uncertainty and higher interest rates are dampening activity growth.
Inflation is influenced by a number of factors. On the one hand, petroleum prices have risen (see Box 2.2). In addition, wage growth was higher than expected last year, and many enterprises have to cover higher costs by raising selling prices. The war in the Middle East is adding to uncertainty about how inflation will develop in the period ahead as it affects prices for petroleum and other commodities such as fertiliser and metals. On the other hand, the krone has appreciated since the beginning of the year. This is curbing inflation.
Higher prices for oil, gas and other commodities increase government revenues, but overall are considered to have a relatively modest effect on growth in the mainland economy. Since Norway is an exporter of petroleum and other commodities, high prices in isolation have a stimulating effect on the economy. At the same time, higher energy prices will draw in purchasing power from Norwegian households. In addition, combined with heightened uncertainty, this will dampen growth among Norway’s main trading partners.
As recently as January, Norges Bank projected that the key policy rate would be lowered this year. This message was abandoned at the monetary policy meeting in March, and at the monetary policy meeting in May, the policy rate was raised from 4 to 4¼ per cent (Chart 2.8). The policy rate was raised further to 4½ per cent at the monetary policy meeting in September. In connection with the September meeting, the Bank stated that there will probably be a need to maintain a high policy rate for a period ahead and that it is prepared to raise the interest rate further if the inflation outlook so warrants. In justifying a tighter monetary policy, the Bank has emphasised that a situation must be avoided where firms and households begin to plan for inflation to remain high, as this may result in more persistent inflation.
Box 2.2 Development in petroleum prices
In late February, the United States and Israel launched military strikes against Iran, and shipping through the Strait of Hormuz came to a near complete halt. Normally, about 20 per cent of global oil production and a corresponding share of global liquefied natural gas (LNG) production are transported through the strait, mainly to Asian countries such as China, India, Japan and South Korea. The loss has led to a sharp reduction in the supply of oil and gas. There is still considerable uncertainty associated with the further development of the conflict and about when export volumes willnormalise.
Oil prices
Oil prices have been markedly higher this year than last year (Chart 2.5). So far this year, oil prices have averaged USD 88 per barrel, the highest since 2022. Ever since the war broke out, the oil market has been characterised by periodically large daily fluctuations in response to news about the conflict. However, futures prices have always priced in an expectation that a political solution is not far away, which has contributed to keeping oil prices lower than implied by physical market disturbances in isolation.
The price increase is mainly related to sharply reduced oil production in the Middle East since February, where fields have been shut down for safety reasons or are producing less than normal due to limited export capacity and limited local storage capacity. Alternative overland transport routes are used but have limited capacity. In addition to the near closure of the Strait of Hormuz, since mid-September the Houthi militia has carried out a major offensive along Yemen’s Red Sea coast, taking control of the Bab al-Mandeb Strait. This has amplified the threat to Saudi Arabia’s oil exports through the Red Sea, which it has increasingly used as an alternative to Hormuz. In addition, Saudi Arabia’s east-west pipeline, which has been the country’s main export route past Hormuz, was shut down after drone strikes. The pipeline is expected to be largely out of service for several weeks.
Since last year, OPEC and a number of other producer countries (OPEC+) have gradually increased production quotas after a few years of reduced quotas to stabilise the oil market. Since the outbreak of war, OPEC+ has further increased production quotas. The actual production increases have been considerably lower than implied by the quota increases, partly because the group’s spare production capacity is limited.
The United States has significantly increased its oil exports after the Strait of Hormuz closed. The US has released large volumes from its strategic stockpiles. Shale oil production can adapt relatively quickly, but is at the same time price-sensitive, and after a long period of expansion the sector is now in a maturing phase characterised by consolidation. Russia has managed to maintain high export volumes over time, but production is increasingly hit by Ukrainian drone strikes on oil infrastructure, adding to uncertainty about the country’s future export capacity.
Before the conflict, the oil market was characterised by a supply surplus and extensive inventory build-up, including large volumes stored on tankers, mainly sanctioned oil from Russia, Iran and Venezuela. The loss of oil and oil products from the Middle East has since led to large global inventory drawdowns. In mid-March, the International Energy Agency (IEA) announced a coordinated release of 400 million barrels of crude oil and oil products from the stockpiles, the largest stockpile release it has carried out. China is estimated to have the world’s largest oil stockpile, and when the war in the Middle East broke out, it is believed to have replaced part of the loss from the Middle East with inventory drawdowns. Since summer, Chinese imports have edged up again, in pace with some increase in oil deliveries from the Middle East.
There is considerable uncertainty about future developments in the oil market. If the conflict continues and oil exports from the Middle East are curtailed, prices could remain high. In this report, it is technically assumed that oil prices will move in line with futures prices from mid-June. This implies an oil price of USD 85 per barrel in 2026 and USD 75 per barrel in 2027, measured at fixed 2027 prices. This corresponds to NOK 803 and NOK 703 per barrel respectively. By comparison, the average oil price in the period 2022–2025 was NOK 940 per barrel (measured at fixed 2027 prices). As a result of the assumption of a stronger krone this year than last year, the projected oil price increase in 2026 is smaller measured in NOK than in dollars.
Gas prices
The gas price shows a slightly different path from the oil price. Before the outbreak of the war in the Middle East, prospects for high growth in the supply of liquefied natural gas (LNG) had contributed to a decline in the European gas price through 2025 (Chart 2.5). The war in the Middle East contributed to a marked rebound in the gas price. The loss of LNG deliveries through Hormuz has kept prices high and contributed to weaker inventory build-up in Europe. The prospect of lower-than-normal inventory levels in Europe heading into winter is again contributing to a risk premium in prices. Futures prices indicate that prices are expected to continue to rise in the near term.
Trade in LNG has become increasingly important, partly as a result of the development of receiving terminals. This has made the regional gas markets more closely linked. Gas prices are now determined to a greater extent than before in a global market where importing regions compete for gas. The disruption to the LNG market as a result of the war in the Middle East is therefore affecting the price of gas in Europe. Last year, the EU covered more than 40 per cent of its gas needs with LNG, a share that has more than doubled since 2021.
Norwegian gas is mainly exported by pipeline to Europe, and has in recent years accounted forabout 30 per cent of the total gas imports of both the EU and the UK. Norwegian gas is more important for Europe than before as EU has sharply reduced imports of Russian gas and has decided to complete the phase-out by November 2027.
Demand for LNG in Asian countries, including China, has been weaker than previously expected, partly because higher prices have made gas less competitive compared to other energy sources. In Europe, gas demand is less price sensitive, as much of the consumption goes to heating buildings, where it is challenging to quickly switch to alternative energy sources.
The key LNG plant in Qatar was damaged in March, and part of its export capacity is expected to be out of service for several years. At the same time, increased LNG exports from other countries, particularly the US, are helping to cushion some of the decline from the Middle East.
The filling of gas stocks in the EU has been slow through the summer, and in mid-August the stocks were filled to about 60 per cent, the lowest level for the season in several years. Low inventories increase the need for LNG imports going forward, while uncertainty about deliveries from the Middle East remains high.
There is considerable uncertainty surrounding developments in the gas price in Europe. How long the war in the Middle East lasts, and how quickly the supply side normalises, will be of great importance. This applies to transport through the Strait of Hormuz and the Bab al-Mandeb Strait, as well as the reconstruction of damaged production capacity. Gas price developments will also depend on weather conditions in Europe and demand developments in Asia.
In this report, the average price for Norwegian gas exports is technically assumed to be USD 15.0 per MMBtu this year and USD 11.5 per MMBtu next year measured in fixed 2027 prices, which corresponds to NOK 5.4 and 4.1 per Sm3 respectively. There is considerable uncertainty about developments in gas prices, and the futures market in mid-September indicates that prices may be higher than this.
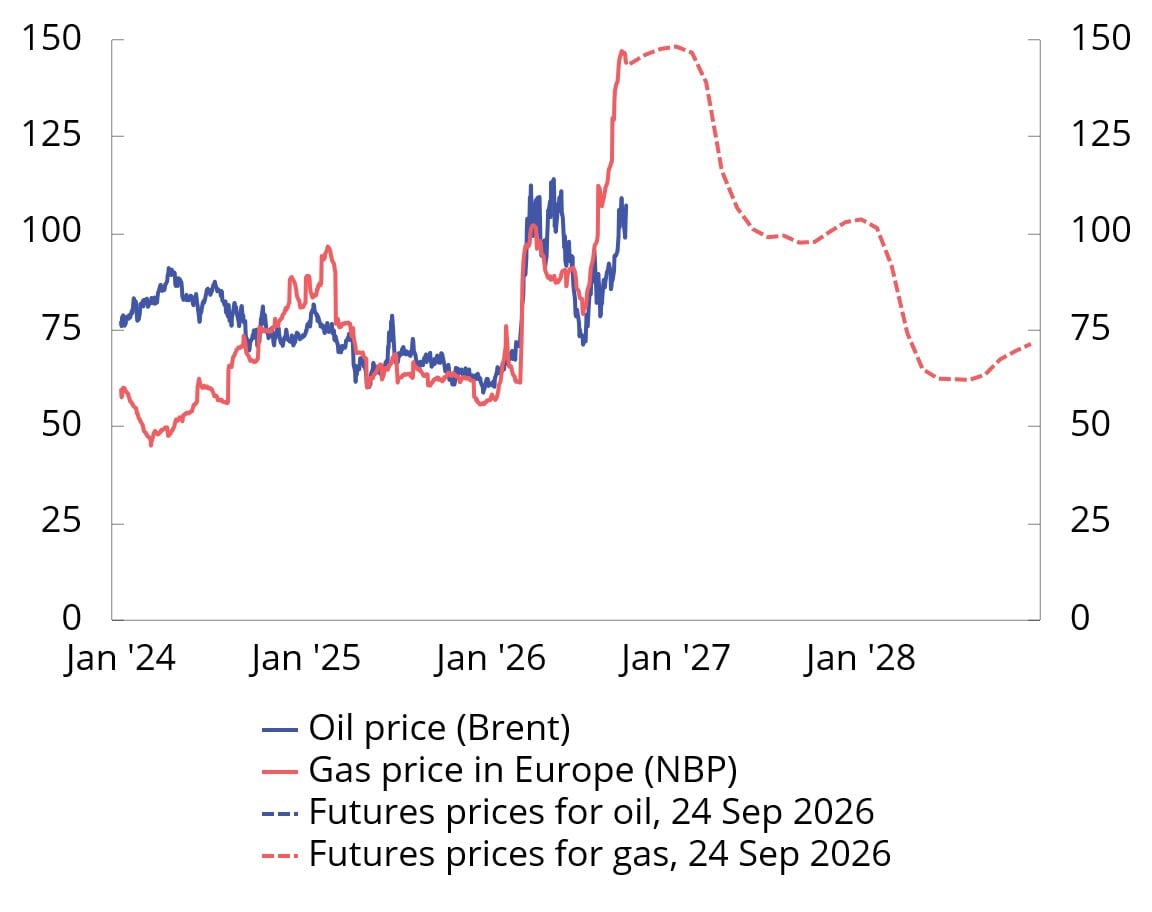
Chart 2.5 Oil and gas spot- and futures prices. USD per barrel. 2024–20281
1 Daily observations through September 24, 2026. Monthly observations for forward prices from October 2026.
Sources: Macrobond and Ministry of Finance.
Table 2.1 Main figures for petroleum activities
|
2025 |
2026 |
2027 |
2028 |
|
|
Prerequisites : |
||||
|
Crude oil price, NOK per barrel |
707 |
785 |
703 |
681 |
|
Crude oil price, 2027-NOK per barrel |
749 |
803 |
703 |
666 |
|
Crude oil price, 2027-USD per barrel |
72 |
85 |
75 |
71 |
|
Gas price, 2027-NOK per Sm3 |
4,7 |
5,4 |
4,1 |
3,3 |
|
Gas price, 2027-USD per MMBtu |
12,0 |
15,0 |
11,5 |
9,2 |
Sources: Statistics Norway, Macrobond, Ministry of Energy and Ministry of Finance.
Capacity utilisation is close to normal
Capacity utilisation can be assessed on the basis of various economic indicators, including labour market indicators, GDP growth and inflation, as shown in Chart 2.6. The chart illustrates that the nominal side and the real economic side of the economy are now sending slightly different signals. Some of the indicators are close to or below their historical averages, while both wage and price inflation are still higher.
The share of enterprises in Norges Bank’s regional network reporting capacity problems has gradually declined over the past year. It is now at its lowest level since the beginning of 2020. A number of contacts also report that it has become somewhat easier to recruit labour, and the share of companies reporting that labour shortages are curtailing output is somewhat lower than the historical average. The decline in the number of job vacancies over the past year also indicates that labour shortages have eased. Despite the decline, the number of vacancies remains high historically. Registered unemployment is still low and well below the average for the past 20 years. Unemployment measured by the Labour Force Survey (LFS) has risen in recent years. A large part of this increase can be attributed to people seeking work alongside school or studies, and this year LFS unemployment has fallen slightly. Overall, the indicators in Chart 2.6 show that capacity utilisation is close to a normal level.
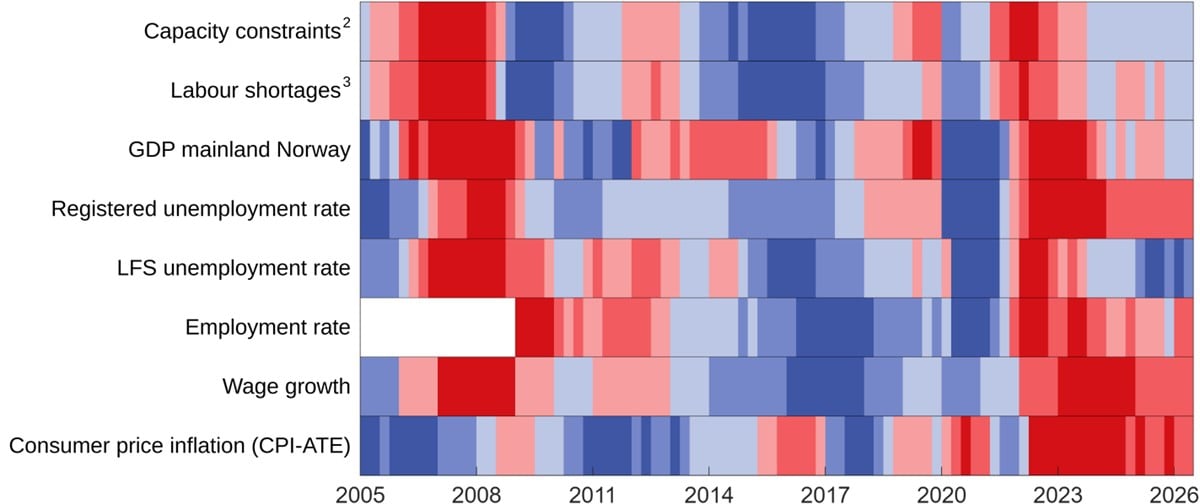
Chart 2.6 Selected indicators of capacity utilisation in the Norwegian economy.1 1st quarter 2005–2nd quarter 2026
1 Red colours are a sign of a boom with pressures in the economy, while blue colours are a sign of recession and spare capacity. The colour scale reflects how large the gap, or deviation from the average, is. The darkest colours represent the third of the observations with the largest positive and negative deviation. The indicators are measured as the deviation from the average in the period shown in the chart, with observations from the pandemic years 2020 and 2021 removed from the time series. The exceptions are inflation, which is measured as a deviation from the inflation target, and GDP, which is measured as a deviation from a simple trend. This means that they have not been adjusted for the abnormally low activity development during the pandemic. The trend is estimated using the HodrickPrescott filter, where the smoothing parameter is set at 40,000.
2 Capacity constraints refer to the share of the contact businesses in Norges Bank’s regional network that will have some or more significant problems in increasing production/sales without investing additional resources.
3 Labour shortages refer to the share of the contact businesses in Norges Bank’s regional network reporting that labour shortages are curtailing production/sales.
Sources: Norges Bank, Statistics Norway, Norwegian Labour and Welfare Administration and the Ministry of Finance.
After growth picked up in mid-2024, growth in the Norwegian economy has slowed somewhat over the past year. Continued high inflation, somewhat higher interest rates and greater uncertainty are expected to dampen growth this year, even though households are set to experience solid purchasing power development. Household consumption is expected to push up growth somewhat again next year (Chart 2.7). In the years ahead, the contribution to growth from public demand is expected in isolation to be approximately the same as in previous years. Petroleum investment, which in recent years has contributed to sustaining growth in the Norwegian economy, is projected to fall from high levels.
After growing by 1.7 per cent last year, the mainland economy is projected to grow by 1.1 per cent this year. This is lower than projected trend growth in the economy, but growth is expected to return to near trend growth in the course of the year. For 2027, growth is estimated at 1.7 per cent.
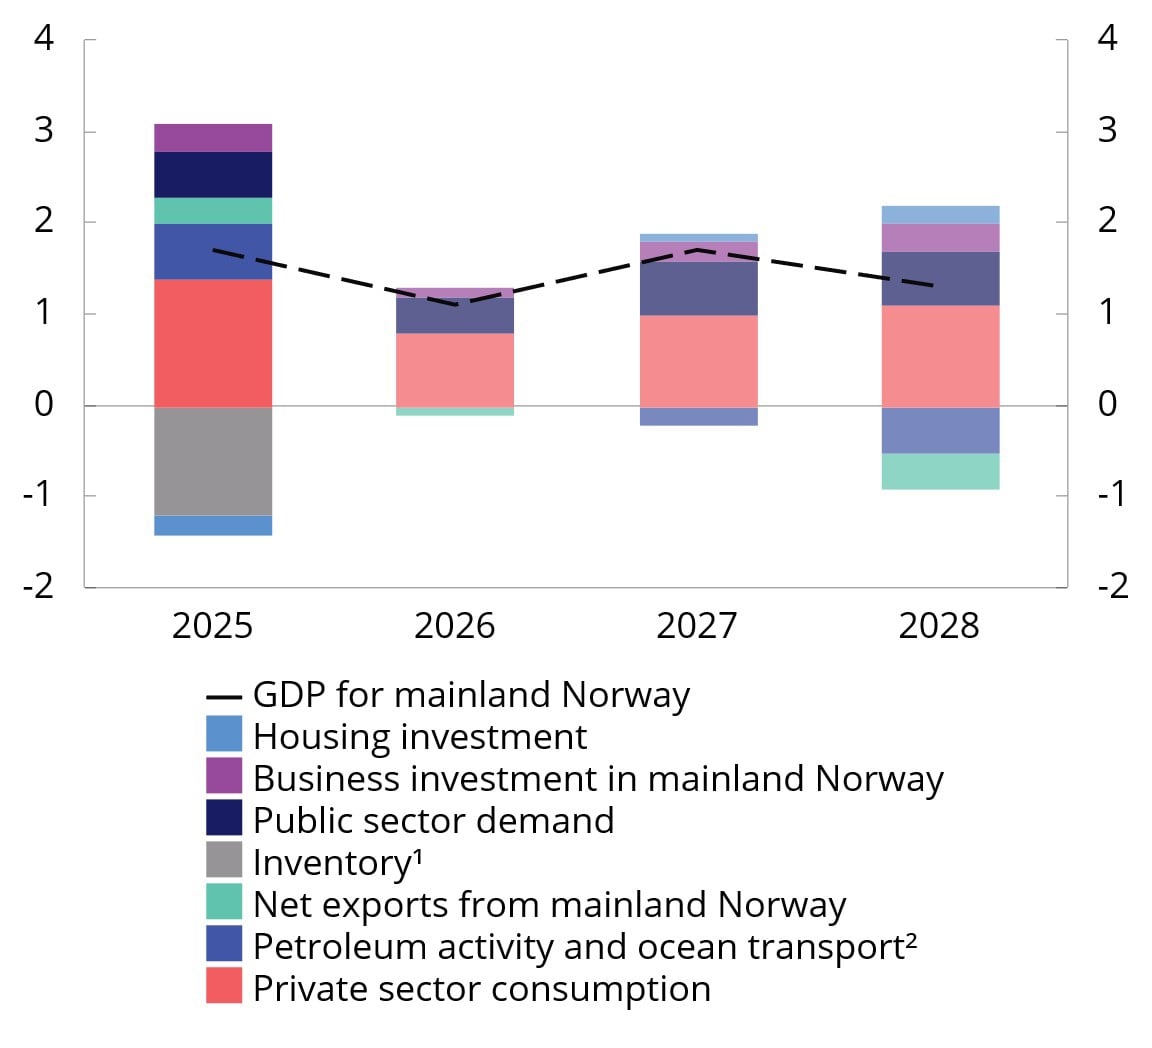
Chart 2.7 Development in mainland GDP by demand component. Growth in per cent. 2025–2028
1 Inventory changes and other statistical discrepancies.
2 Petroleum activities and ocean transport describe the demand from these industries towards the mainland.
Sources: Statistics Norway and Ministry of Finance.
Inflation is expected to remain above the inflation target
It is expected to take time for consumer price inflation to return to target (Chart 2.9). So far this year, inflation, measured by both the change in the consumer price index (CPI) and the consumer price index adjusted for tax changes and excluding energy products (CPI-ATE), has been around 3 percent, approximately the same as in 2025. In August, the 12-month rise in the CPI was 3.3 per cent, while for the CPI-ATE it was 3.0 per cent. The rise in prices picked up from July to August as a result of last year’s reduction in child daycare prices falling out of the twelve-month change.
Energy prices have increased, reflecting higher prices for both fuel and electricity. Without the electricity support schemes, the impact on the CPI would have been greater (see Box 2.3). The temporary reductions in fuel taxes also pulled CPI growth down slightly this year, but the development in energy prices nevertheless contributes to the CPI being projected to grow somewhat more than the CPI-ATE this year. Next year, energy prices are expected to pull down consumer price inflation considerably. However, there are only minor differences between the projections for CPI growth and CPI-ATE growth for 2027. This is due to a further reduction in the threshold for the VAT exemption for electric cars next year. This will not affect the CPI-ATE, but is expected to lift the 12-month change in the CPI from January.
Imported inflation has increased somewhat since last autumn, but the appreciation of the krone is expected to dampen it in coming years.
Inflation is projected to remain high, particularly as wage growth is expected to remain relatively high without high productivity growth. The effect of high wage growth is particularly visible in the contribution to overall inflation from services without rent (Chart 2.10). The combination of the rise in prices for new rental contracts and a continued backlog of CPI adjustment in existing leases has led to a recent rise in measured growth in rents. The rise in rents is assumed to contribute to holding up inflation also next year. Even though the rise in house rents has been higher than normal in recent years, an estimated consumer price index excluding rents has moved broadly in line with the CPI.
Table 2.2 Principal figures for the Norwegian economy. Percentage change from previous year, unless otherwise stated.
|
NOK billion1 |
|||||
|
2025 |
2025 |
2026 |
2027 |
2028 |
|
|
Real economy |
|||||
|
Mainland GDP2 |
4398 |
1,7 |
1,1 |
1,7 |
1,3 |
|
Employment |
0,7 |
0,6 |
0,4 |
0,4 |
|
|
Unemployment rate, registered (level) |
2,1 |
2,1 |
2,1 |
2,1 |
|
|
Unemployment rate, LFS (level) |
4,5 |
4,5 |
4,5 |
4,5 |
|
|
Demand components and GDP2 Demand from mainland Norway3 |
4596 |
1,9 |
1,2 |
1,8 |
2,1 |
|
Private consumption |
2341 |
2,6 |
1,4 |
1,8 |
2,0 |
|
Business investment |
505 |
2,7 |
1,2 |
1,3 |
3,0 |
|
Housing investment |
209 |
-3,6 |
-0,4 |
3,2 |
3,8 |
|
Public sector demand |
1539 |
1,4 |
1,1 |
1,7 |
1,7 |
|
Petroleum investment |
281 |
7,2 |
-2,0 |
-4,0 |
-7,7 |
|
Export |
2504 |
2,7 |
2,9 |
-0,3 |
-0,3 |
|
Crude oil and natural gas |
1100 |
0,8 |
4,5 |
-2,9 |
-3,0 |
|
Mainland Norway |
1216 |
5,9 |
1,2 |
2,1 |
1,9 |
|
Import |
1858 |
2,6 |
1,4 |
1,2 |
2,2 |
|
Gross domestic product (GDP) |
5511 |
1,1 |
1,3 |
0,7 |
0,4 |
|
Prices |
|||||
|
Annual salary |
4,9 |
4,6 |
4,0 |
3,5 |
|
|
CPI |
3,1 |
3,3 |
2,7 |
2,4 |
|
|
CPI-ATE |
3,1 |
3,1 |
2,8 |
2,4 |
|
|
Crude oil price, USD per barrel (level) |
68 |
83 |
75 |
72 |
|
|
Three-month money market rate (level)4 |
4,4 |
4,5 |
4,6 |
4,0 |
|
|
Import-weighted exchange rate (I-44 level) |
119,6 |
113,4 |
112,9 |
112,9 |
|
|
Krone exchange rate5 |
0,6 |
5,4 |
0,5 |
0,0 |
|
|
International economy 6 |
|||||
|
GDP trading partners |
2,0 |
1,7 |
1,8 |
1,8 |
|
|
CPI trading partners |
2,1 |
2,5 |
2,3 |
2,2 |
1 Preliminary national accounts figures in current prices.
2 Growth rates from 2025 onwards stated in volume termes.
3 Excluding inventory changes.
4 Corresponds to the money market rate forecast in Norges Bank’s Monetary Policy Report 2/26.
5 Percentage change inverse of the I-44 exchange rate index. A positive number indicates a stronger krone.
6 Norway’s 10 most important trading partners weighted together with their respective shares of Norwegian exports of goods excluding oil and gas and Norwegian imports of goods excluding ships, oil platforms and crude oil.
Sources: Statistics Norway, IMF, Eurostat, Norges Bank, Norwegian Labour and Welfare Administration, Reuters, Macrobond and the Ministry of Finance.
Registered unemployment still low
In several of the years following the pandemic, there has been a shortage of labour. As a result, employment growth has been more dependent on the supply side than on the labour market’s demand-side.
Labour shortages have eased somewhat recently, but employment has continued to increase over the past six months at about the same pace as in the two preceding years. There has been an increase in both private industries and public administration. In the second quarter of this year, about 20 000 more people were employed than at the same time last year. More than 70 per cent of the increase occurred in private industries. Employment is expected to increase further ahead, with growth of 0.6 per cent this year and somewhat more subdued growth next year.
Registered unemployment has remained low for several years. At end-August, 2.1 per cent were registered as fully unemployed (Chart 2.11). This is the same level as the average for last year. Unemployment measured by the Labour Force Survey has declined somewhat this year and corresponded to 4.5 per cent trend-adjusted in August this year. Overall, unemployment is projected to show little change ahead. The labour market is discussed in more detail in Section 2.4.
Real wage growth this year and next
Solid profitability in manufacturing, high price growth and low registered unemployment have contributed to high wage growth in recent years. Annual wage growth last year was 4.9 per cent, five tenths higher than the norm negotiated in last year’s wage settlements. This resulted in substantial real wage growth.
Wage formation in Norway is based on the frontfag model, where key tariff areas in the internationally exposed sector (the frontfag) negotiate first and set the norm for the other areas. In agreement with the Norwegian Confederation of Trade Unions (LO), the Confederation of Norwegian Enterprises (NHO) estimates annual wage growth in manufacturing as a whole in the NHO area at 4.4 per cent this year.
The labour cost share for manufacturing is a key indicator for monitoring the competitiveness of the frontfag. The labour cost share overall in 2025 was below the average for the past 20 years. Nevertheless, there are considerable differences between branches of manufacturing. In engineering and shipbuilding, the share of labour costs has declined for several years. In commodity-based manufacturing, the labour cost share fell by more than 30 per cent from 2020 to 2022, partly as a result of a significant increase in commodity prices. In isolation, the reduced share of labour costs for manufacturing as a whole in recent years provides room for wage growth to remain higher than the rise in prices ahead. There is uncertainty associated with developments in both commodity prices and energy prices. If these were to be reduced, profitability in manufacturing would be dampened. This could then affect wage growth. Changes in the exchange rate will also affect profitability in manufacturing.
Unemployment is low in several parts of the labour market, and many employers still face challenges recruiting labour. This report assumes overall annual wage growth of 4.6 per cent this year. Next year, annual wages are projected to increase by 4 per cent. This implies solid real wage growth both this year and next year.
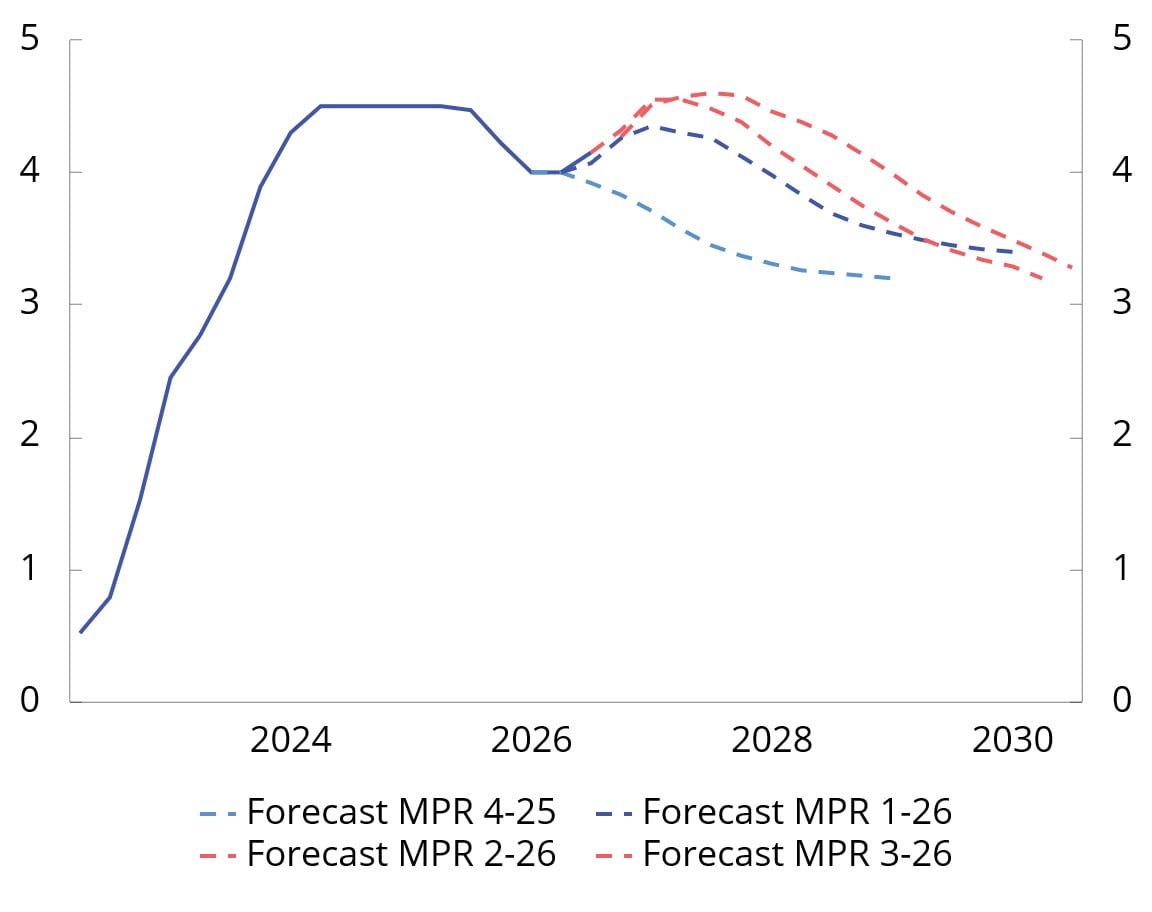
Chart 2.8 Norges Bank’s key policy rate. Percent. 1st quarter 2022–2nd quarter 20301
1 Norges Bank’s projections for the key policy rate at different times. Monetary Policy Report (MPR) 4/25 was published on 18 December 2025, MPR 1/26 on 26 March 2026, MPR 2/2026 on 18 June 2026 and MPR 3/2026 on 24 September 2026.
Source: Norges Bank.
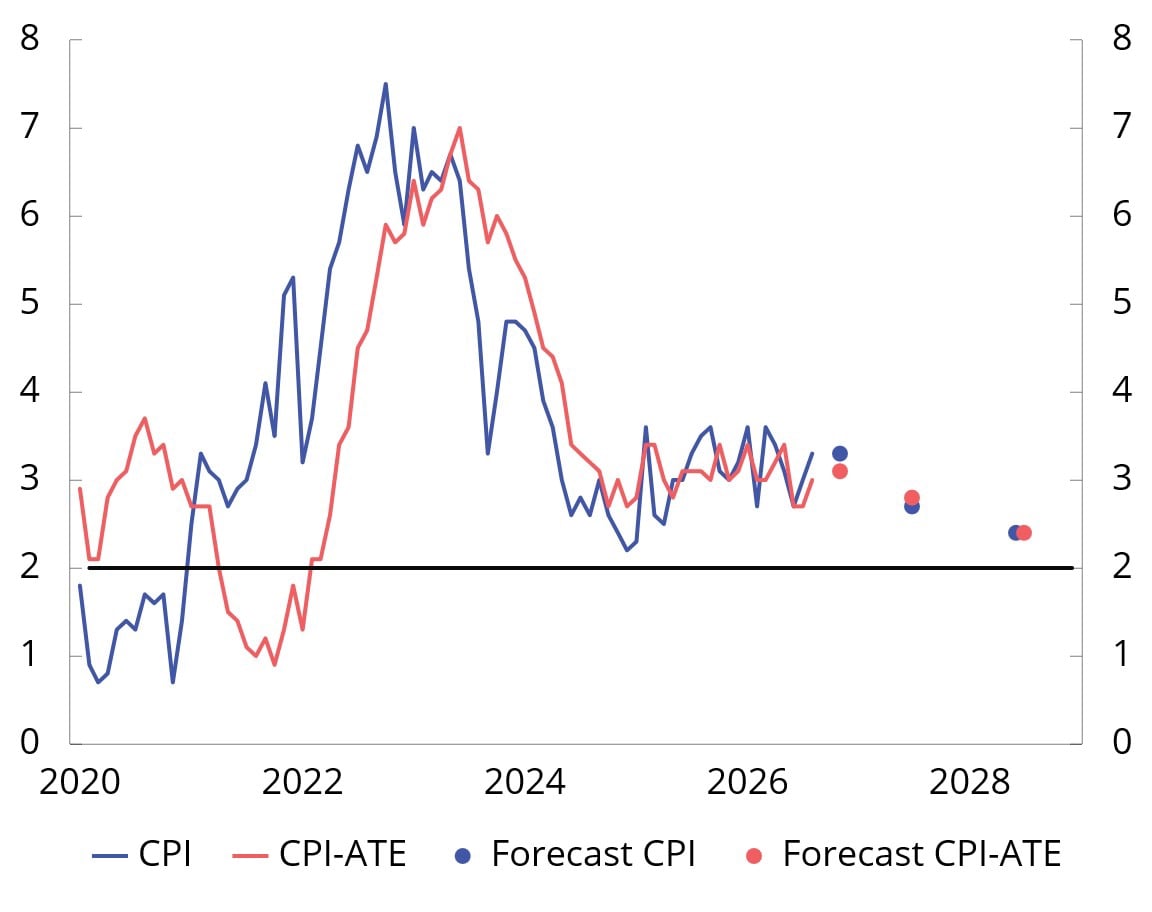
Chart 2.9 Twelve-month growth in the CPI and CPI-ATE. Percent. 2020–2028
Sources: Statistics Norway and Ministry of Finance.
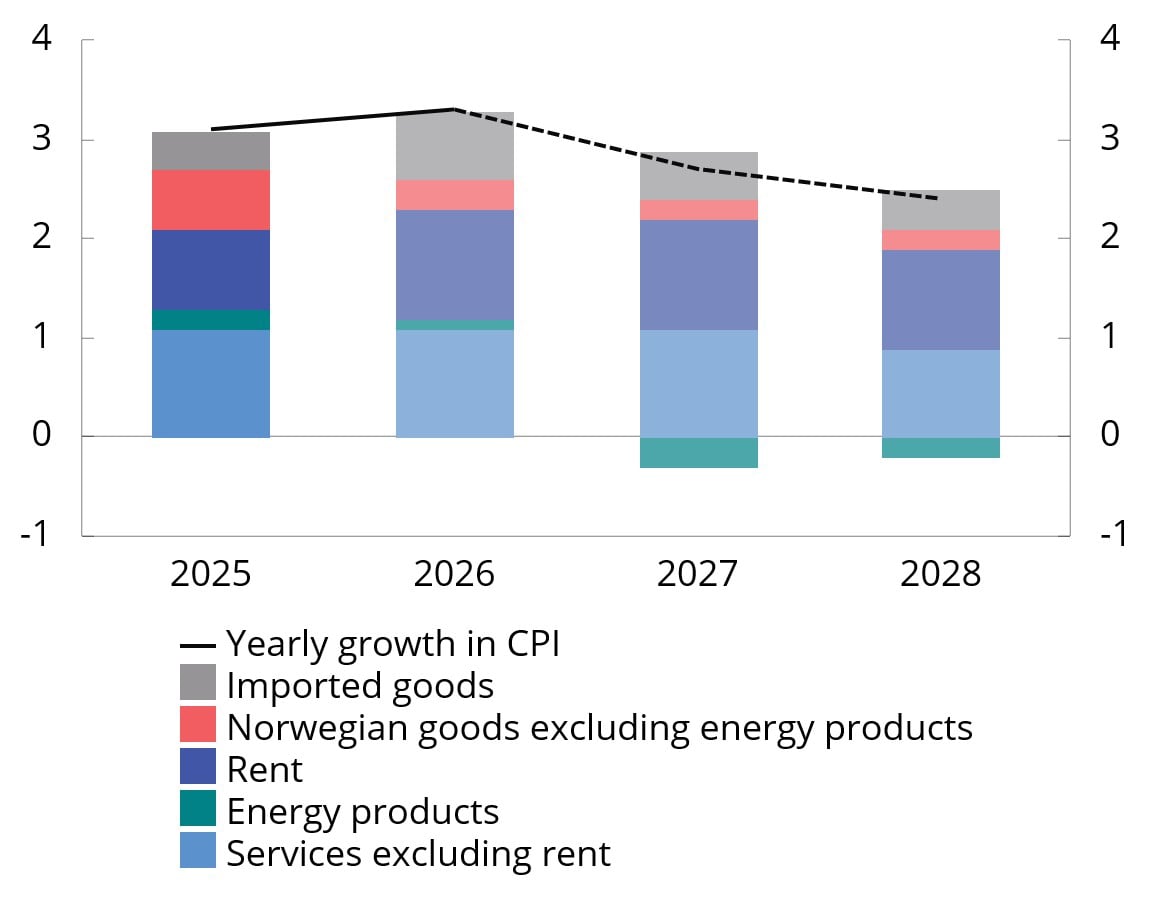
Chart 2.10 CPI growth and contribution to growth. Percent. 2025–2028
Sources: Statistics Norway and Ministry of Finance.
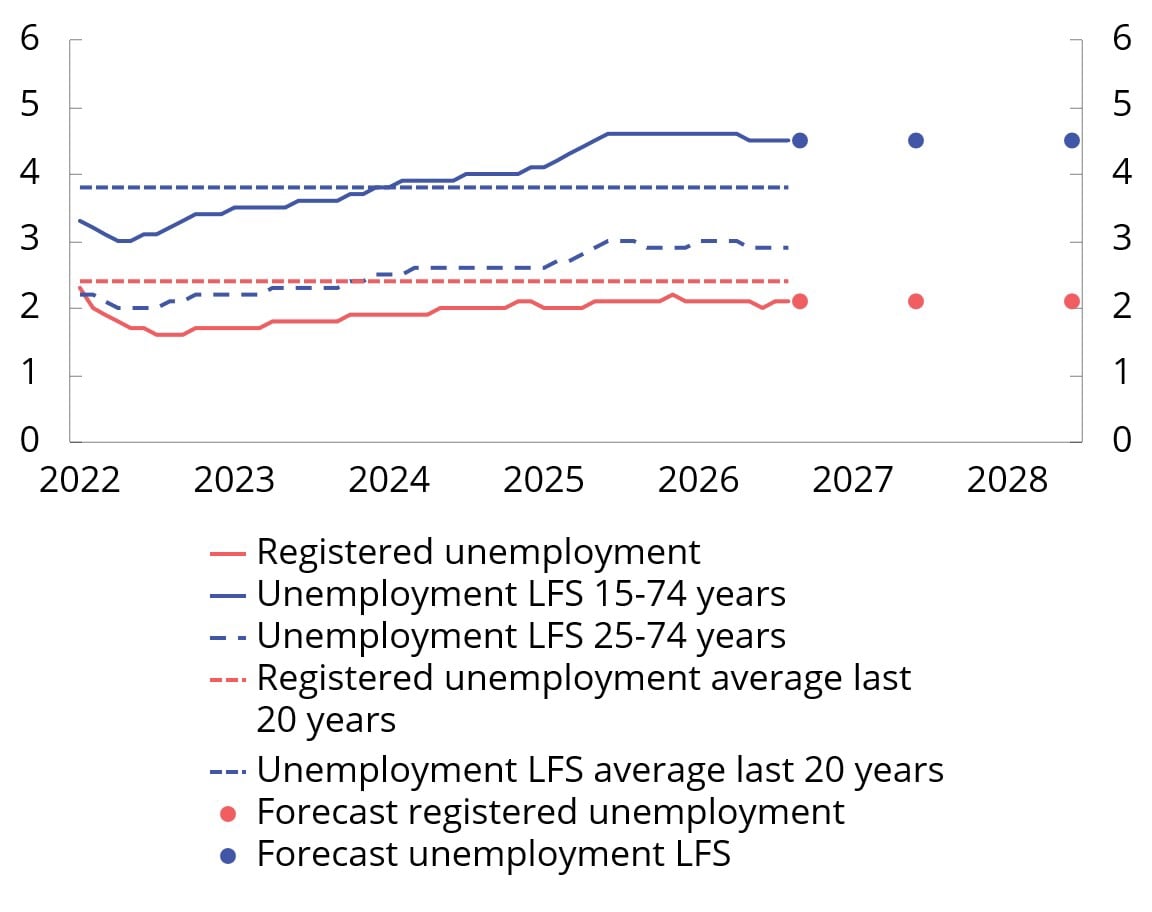
Chart 2.11 Registered unemployed and LFS unemployed as a percentage of the labour force. Seasonally adjusted. 2022–20281
1 Historical unemployment averages are the averages for the period 2006–2019 and 2022–2025.
Sources: Statistics Norway, Norwegian Labour and Welfare Administration and the Ministry of Finance.
Households are pulling the brakes slightly this year
After solid growth in consumption last year, growth slowed in the first half of this year. Some of the development is due to strong growth in car purchases in the fourth quarter last year, which was followed by a marked fall in the first quarter of this year. Consumption was approximately unchanged from the first to the second quarter, and current statistics indicate that growth this year will be fairly sober. Weaker developments may indicate that heightened uncertainty and somewhat higher interest rates have made households more hesitant and that they are saving a higher share of their income than previously.
Solid income growth is underpinning household consumption. Real wage growth has been solid in recent years and is projected to remain high. Nor do the interest rates assumed ahead prevent further growth in household real disposable income. Consumption growth is expected to pick up somewhat from next year.
Postponed housing investment upturn
Housing investment has remained broadly unchanged over the past year and a half, after falling sharply in 2023 and 2024. This year there was a marked fall in housing investment in the first quarter and growth in the second quarter. An upturn in housing investment has long been expected, but in the updated projections the upturn has been further deferred (see Chart 2.12). A number of factors dampen the upturn. Higher interest rates and higher construction costs have pushed down activity in the construction industry. New home sales have developed weakly this year and are lower than at the same time last year. At the same time, the rise in second-hand house prices has been relatively weak so far this year (Chart 2.13), and lower than the rise in prices for new homes. It helps maintain the large price difference between new and resale homes, which makes new homes less attractive. The level of housing investment is projected to remain broadly unchanged this year. Higher real income is expected to push up household demand for new homes further out. Housing investment growth is expected to pick up gradually from next year.
Low housing investment in recent years also means that the number of completed homes has declined. It may be interesting to compare the annual increase in the number of households, as it can be a simple guideline for how much housing construction is needed over time. In recent years, the number of completed dwellings less departed dwellings has been below the increase in the number of households (Chart 2.14). This may indicate pent-up demand for new homes, which may support the projection of an increase in residential construction in the coming years. At the same time, it is difficult to capture the amount of spare capacity in the unused portion of existing housing stock. Moreover, in the longer term it is reasonable to assume that the increase in the number of households will decline because of lower population growth. This may reduce the need for residential construction further ahead.
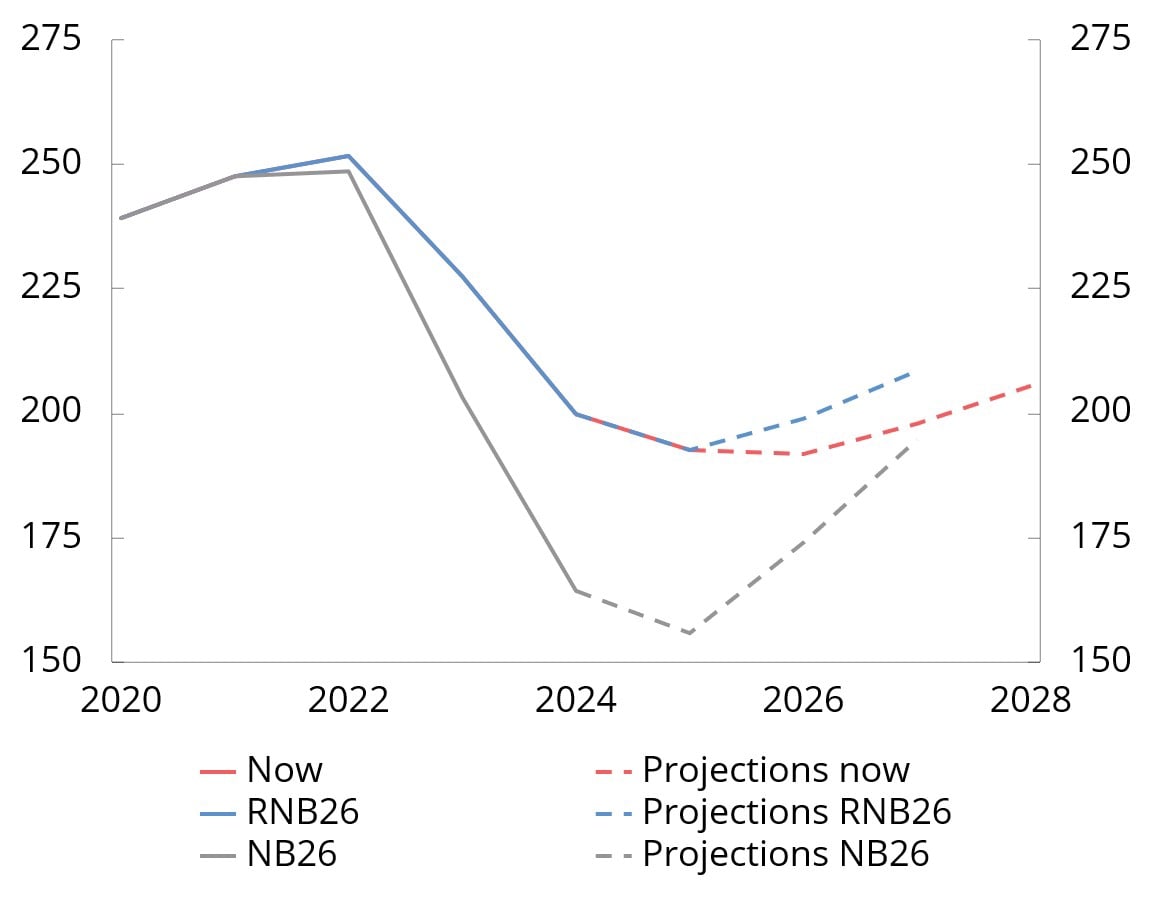
Chart 2.12 Projections for housing investment at different points in time. NOK billion at 2023 prices. 2020–2028
Sources: Statistics Norway and Ministry of Finance.
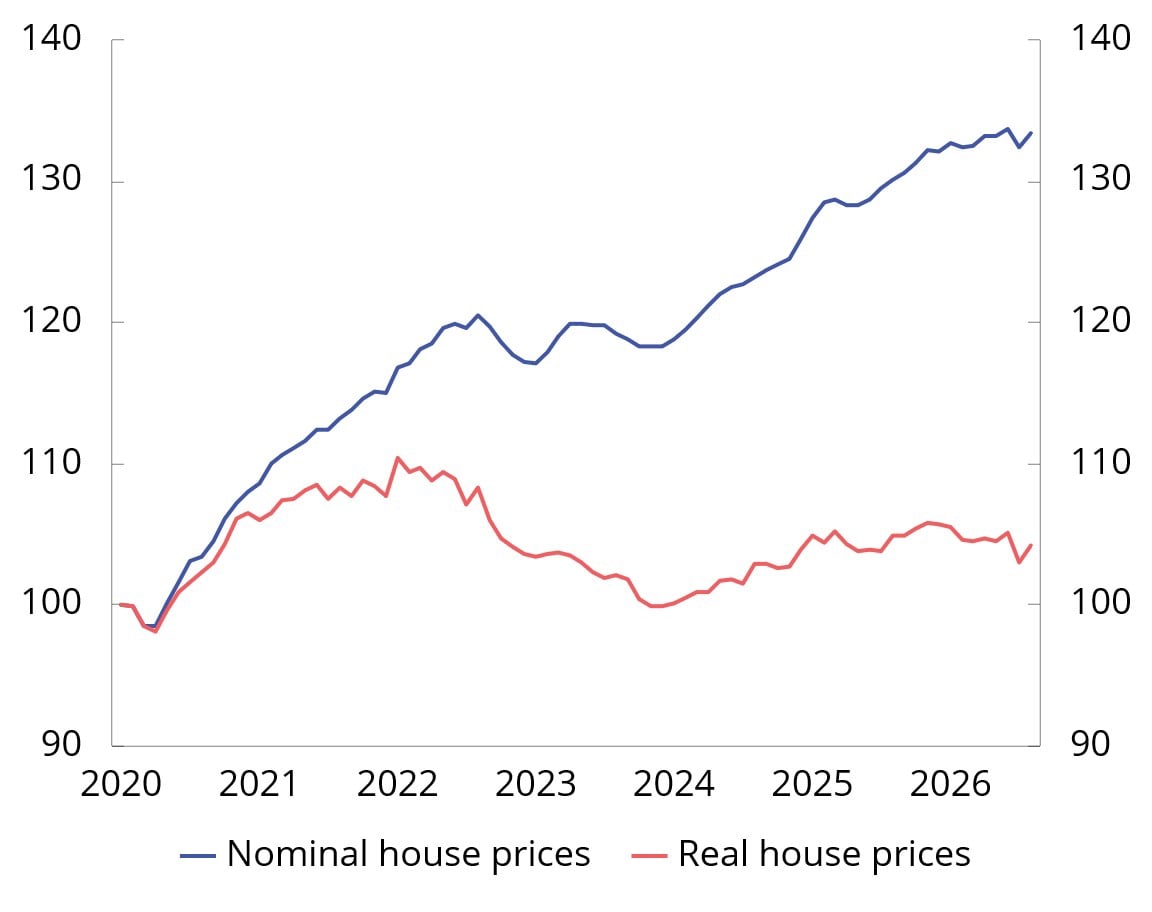
Chart 2.13 Second-hand housing prices.1 Index. Jan. 2020=100. Seasonally adjusted. Jan. 2020-Aug. 2026
1 Real house prices are calculated by deflating Real Estate Norway’s seasonally adjusted second-hand housing price series by the seasonally adjusted consumer price index (CPI).
Sources: Real Estate Norway, Property Value, Finn.no, Statistics Norway and Ministry of Finance.
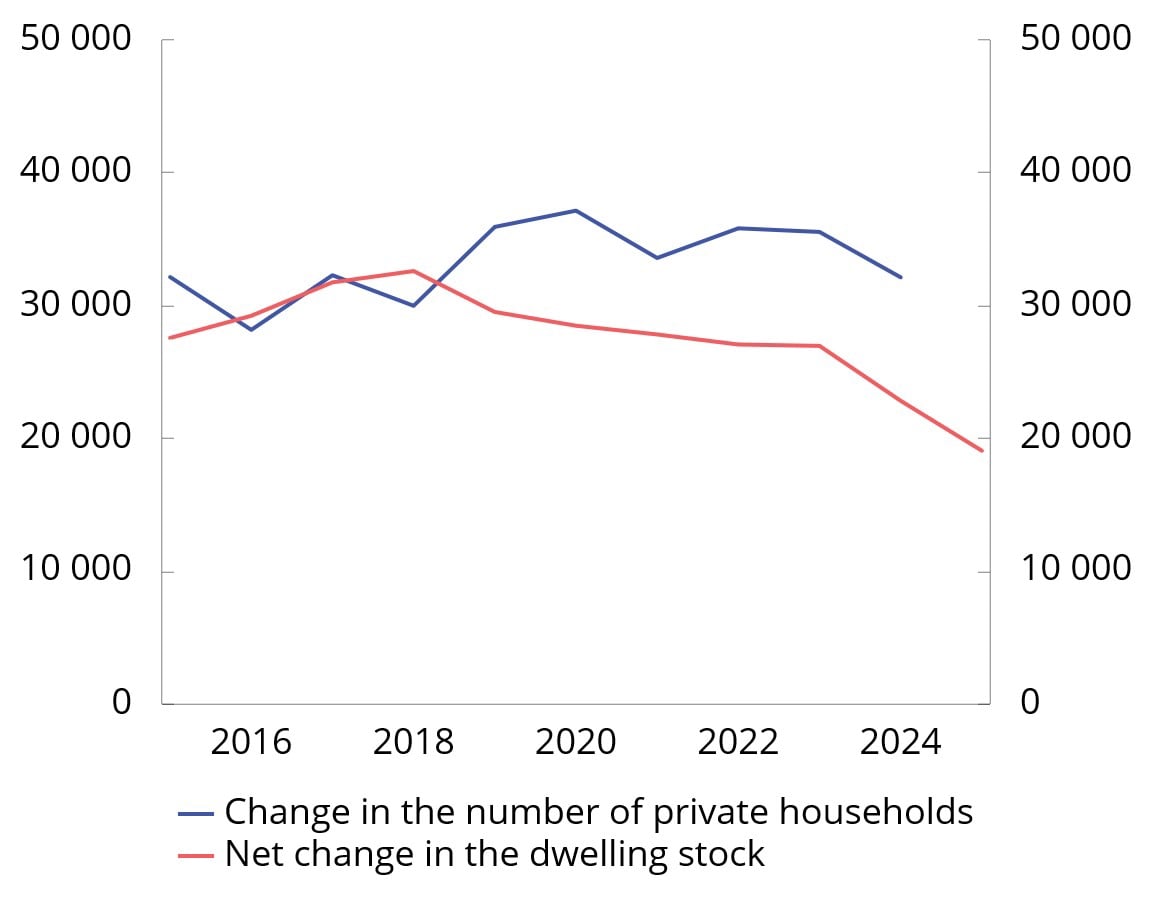
Chart 2.14 Change in the number of private households and the number of completed dwellings (including conversions) less the number of departed dwellings. 2015–2025
Source: Statistics Norway.
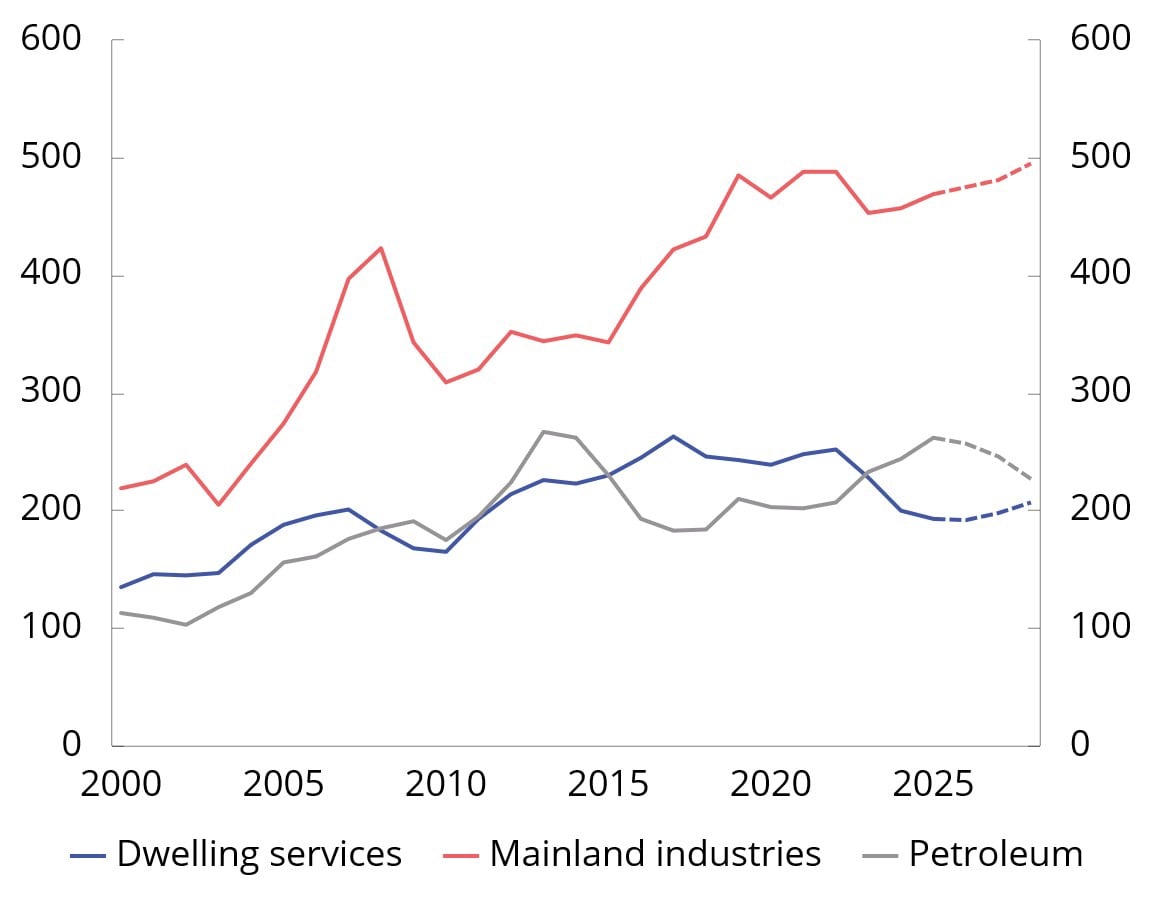
Chart 2.15 Gross fixed capital formation. Housing, mainland industries and petroleum. NOK billion at 2023 prices. 2000–2028
Sources: Statistics Norway and Ministry of Finance.
Higher interest rates dampen growth in business investment
Mainland business investment has shown modest developments in recent years (Chart 2.15). The enterprises in Norges Bank’s regional network expect moderate growth in output ahead. The outlook is weakest for oil services, while it is strongest for household services. Excluding investment in electricity supply, which is expected to increase markedly, the projections in this report imply a decline in business investment this year. Investments in power supply are expected to boost growth also in 2027 and 2028. Lower interest rates are then expected to contribute to some growth in non-power investment.
Lower growth impulses from petroleum investment
Petroleum investment has increased sharply over the past three years, primarily because of field development (Chart 2.15). The increase must be seen in the context of the temporary tax rules adopted by the Storting in spring 2020, which provided more favourable tax terms for developments where the plan for development and operation (PDO) was submitted by the end of 2022. The scheme contributed to an unusually high number of PDOs being submitted in 2022. The level of petroleum investment has long been expected to decline as these developments are completed. This picture is supported by reporting from the oil companies to the Norwegian Offshore Directorate and by Statistics Norway’s investment intentions survey. In this report, it is assumed that petroleum investment will decline gradually from this year.
The krone has appreciated
The krone, as measured by the import-weighted exchange rate index I-44, has appreciated markedly this year (Chart 2.16). Compared with the beginning of the year, the krone is now about 8 per cent stronger. The appreciation must be seen in the context of the rise in petroleum prices and a wider interest rate differential against other countries. The upward exchange rate has reversed most of the krone depreciation that occurred through 2023. A stronger krone in isolation contributes to curbing inflationary pressures in the Norwegian economy.
The projections for the Norwegian economy are based on the technical assumption that the krone exchange rate will remain unchanged, based on the level prevailing in mid-July.
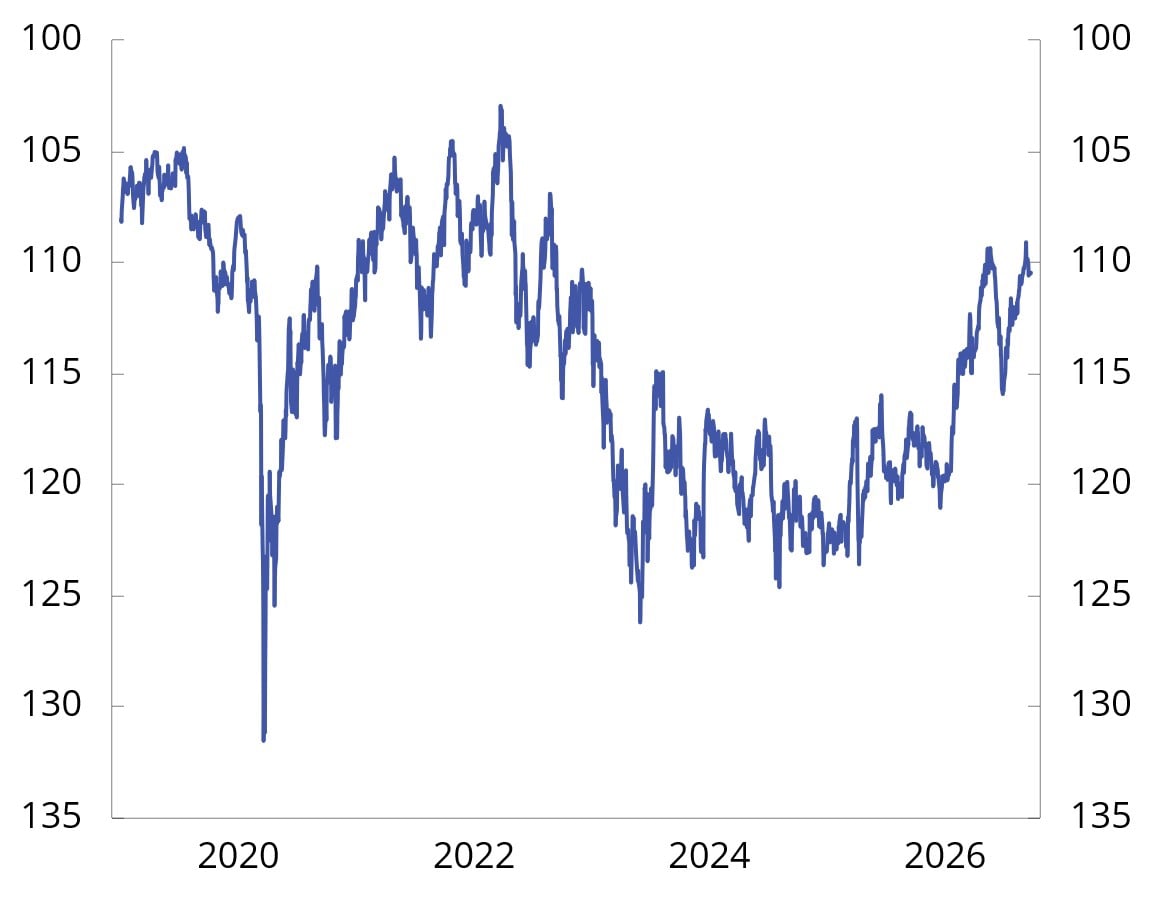
Chart 2.16 Import-weighted exchange rate index (I-44).1 1 Jan. 2019–24 Sep. 2026
1 I-44 is a calculated exchange rate index based on exchange rates between NOK and the currencies of Norway’s 44 most important trading partners measured by import value. A higher index value indicates a weaker krone, and the axes have therefore been inverted to show developments in the value of the krone measured in foreign currency.
Sources: Statistics Norway and Ministry of Finance.
Defence focus characterises public demand
After several years of fairly high growth in public demand for goods and services, growth last year was somewhat lower than the historical average and lower than growth in the mainland economy. Growth in public demand is also expected to be lower than the historical average this year, and the projection has been revised down compared with the revised national budget. This is due to lower-than-expected growth in defence spending. Next year, public demand is projected to grow in pace with the mainland economy. Growth is being driven by high demand in defence, while low investment growth in the state-owned civil sector is expected to dampen growth somewhat.