3.1 Fiscal policy in 2027
Fiscal policy stance
In the fiscal budget for 2027, the Government proposes a use of fund resources, measured by the structural non-oil budget deficit, of NOK 608.4 billion, equivalent to 12.6 per cent of mainland Norway trend GDP (Table 3.1). Measured as a share of the economy, this is approximately unchanged from this year. Fund spending is expected to correspond to withdrawals from the GPFG of 2.7 per cent of the fund value and 26.6 per cent of fiscal budget expenditure.
The fiscal policy stance aims to balance cyclical considerations with the long-term goals of sustainable public finances and to safeguard the growth potential of the economy.
The Norwegian economy continues to grow, although the pace of growth has slowed somewhat over the past year. Inflation is above the inflation target, and since winter, Norges Bank has adjusted its course from planning for further interest rate cuts to raising the interest rate and signalling that more interest rate increases may be forthcoming. Cyclical considerations and the need not to overburden the monetary policy imply a cyclically neutral fiscal policy stance.
In the interest of sustainable development in government finances, government finances used in the event of major changes in the value of the fund should be adjusted gradually over several years. This contributes to stable welfare services and framework conditions and reduces the risk that fiscal policy in itself contributes to instability in the economy.
The fund now finances just over one in four krones of expenditure in the fiscal budget (Chart 3.4). The fund capital has contributed to a strengthened public service offering. At the same time, they have made the welfare state more vulnerable to a fall in financial markets and fluctuations in the krone exchange rate. The value of the fund has increased sharply in recent years, but has fluctuated considerably since the New Year (Charts 3.5 and 3.6). There is considerable uncertainty surrounding developments ahead. In the fiscal policy stance in each year, it must be taken into account that the value of the fund is uncertain and that the fund may fall abruptly.
Fiscal policy must also take into account that unforeseen events may occur that require a strong fiscal response, such as during the pandemic and as a result of Russia’s war of aggression in Ukraine. Increased spending in the event of economic downturns and gradual adjustment of spending in the event of a fall in fund value suggest that fund spending should be below 3 per cent in normal times, so that fund spending over time corresponds to the expected real return of 3 per cent. In previous analyses1 by the Ministry of Finance, it has been estimated that fund spending of 2.7 percent of the fund in normal times results in fund withdrawals that over time correspond to the expected real return of 3 percent.
The budget proposal assumes a fund value of NOK 22 400 billion at the beginning of 2027. This is NOK 1 100 billion more than at the beginning of 2026.
The sustainability of government finances is influenced not only by the level of fund spending, but also by how that capital is spent. International experience shows that substantial revenues from oil and gas extraction or other non-renewable natural resources are no guarantee of sustained high prosperity. Revenues from natural resources can become a cushion that contributes to delaying necessary measures or reforms to utilise society’s resources more efficiently. In the longer run, this may result in weaker productivity growth and lower labour force participation. Measures on the expenditure side or the tax side that strengthen incentives to work, increase productivity or otherwise improve the growth potential of the economy are beneficial for both welfare and the fiscal balance over time. See Meld. St. 31 (2023–2024) the white paper on Long-term Perspectives on the Norwegian Economy 2024 and chapter 5 of this white paper for a more detailed discussion of the importance of increased productivity and efficient use of resources.
Table 3.1 Key figures in the national budget. NOK billion and per cent
|
2025 |
2026 |
2027 |
|
|
Structural non-oil fiscal deficit |
507,4 |
583,4 |
608,4 |
|
Measured in per cent of mainland Norway trend GDP |
11,6 |
12,7 |
12,6 |
|
Change from previous year in percentage points (budget indicator)1 |
1,8 |
1,1 |
0,02 |
|
Measured as a percentage of the Government Pension Fund Global |
2,6 |
2,7 |
2,7 |
|
Measured as a percentage of central government budget expenditure |
24,5 |
26,5 |
26,6 |
1 Change in structural non-oil fiscal deficit measured as a share of mainland Norway trend GDP.
2 The budget indicator for 2027 is -0.04.
Source: Ministry of Finance.
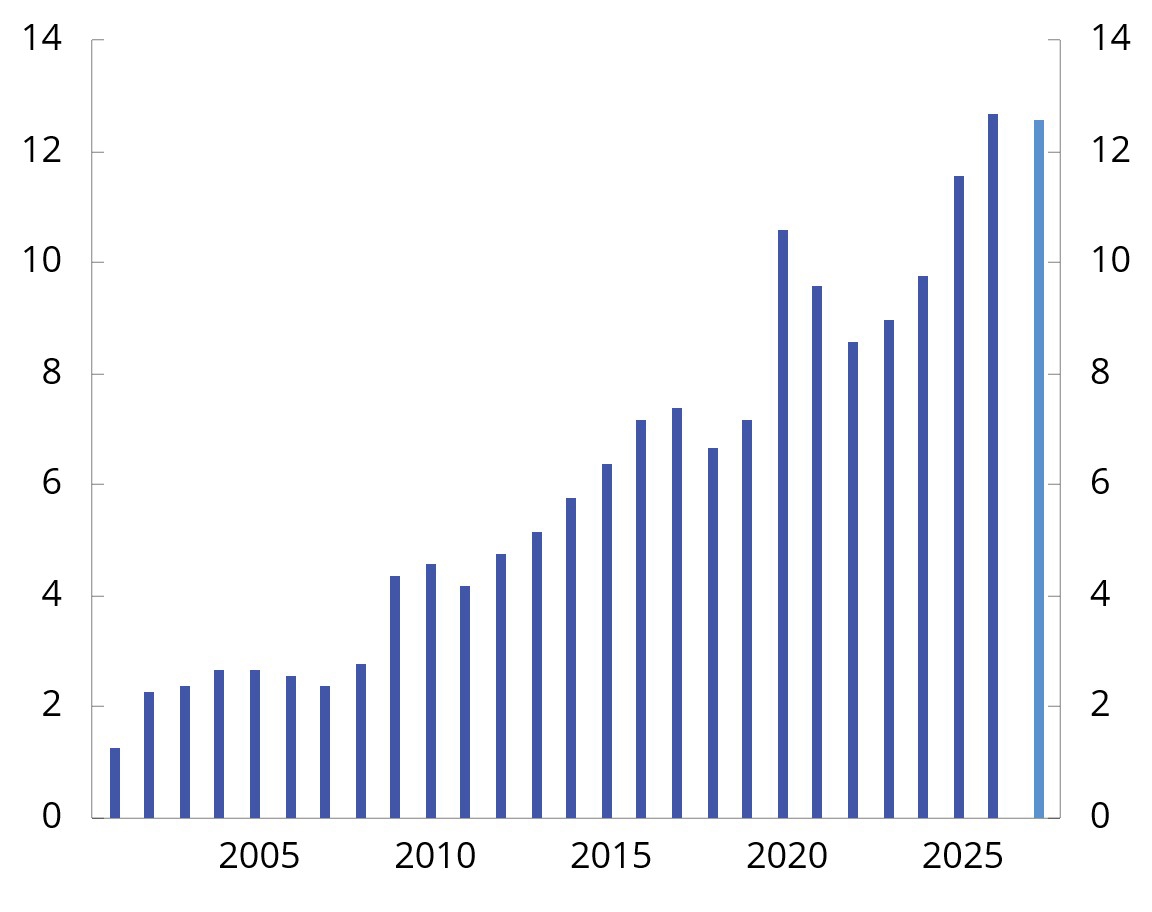
Chart 3.1 Structural non-oil fiscal deficit. Per cent of mainland Norway trend GDP. 2001–2027
Source: Ministry of Finance.
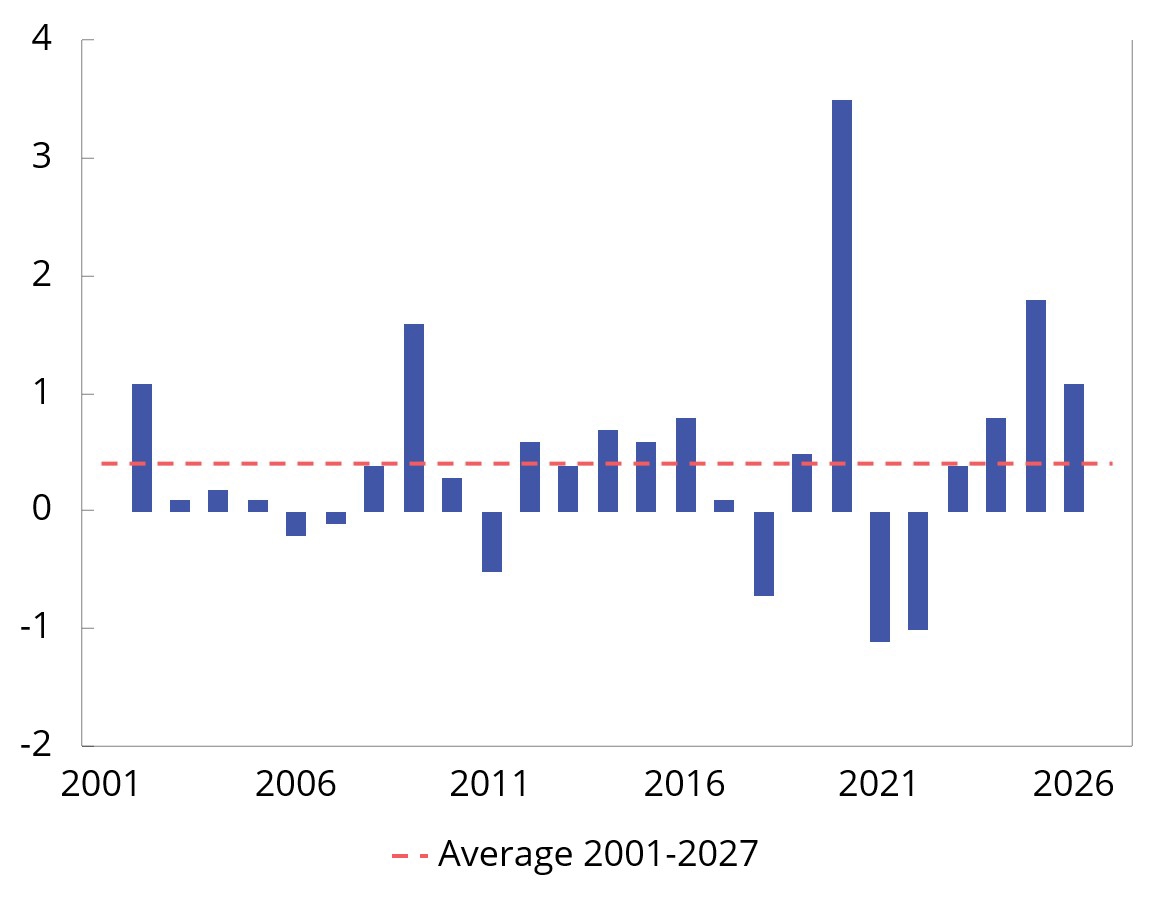
Chart 3.2 Structural non-oil fiscal deficit as a percentage of mainland Norway trend GDP. Change from previous year (budget indicator). 2001–2027
Source: Ministry of Finance.
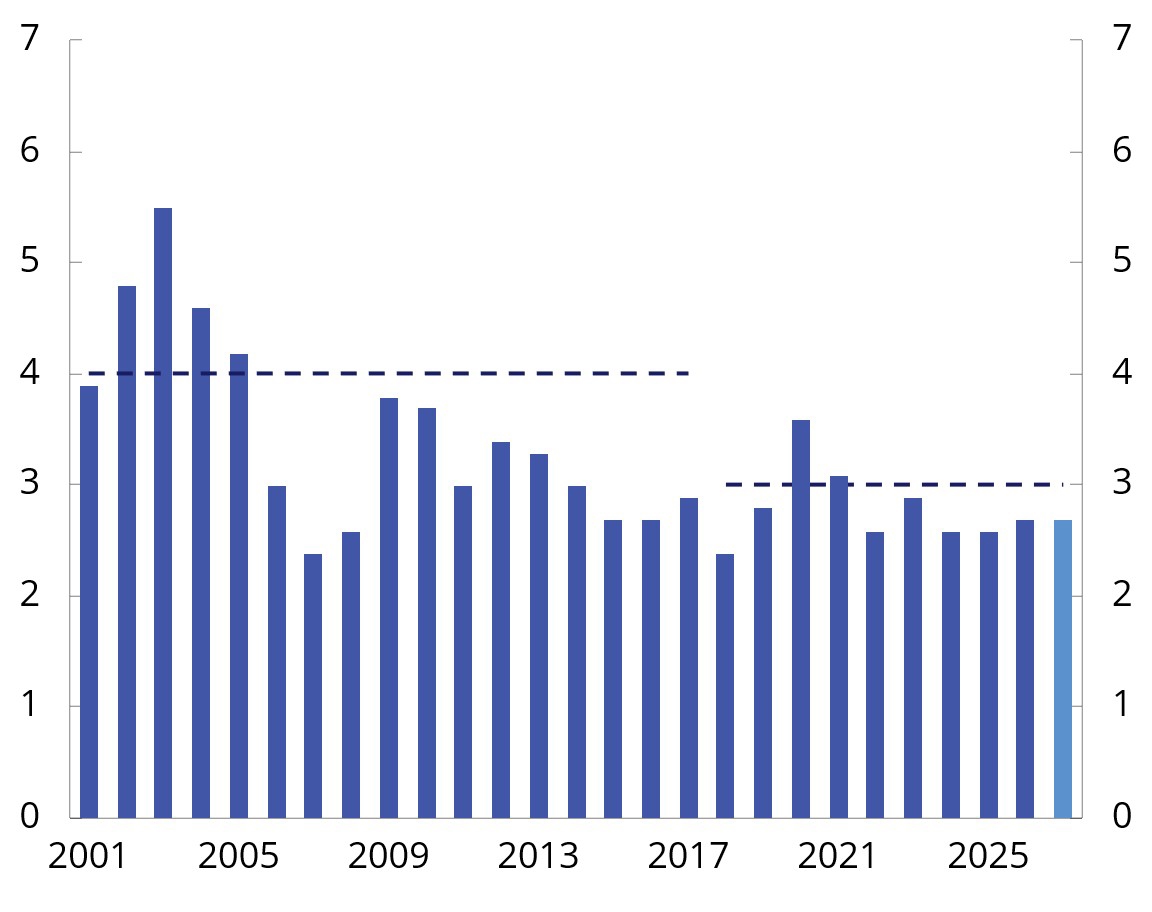
Chart 3.3 Structural non-oil fiscal deficit. Per cent of the Government Pension Fund Global. 2001–2027
Source: Ministry of Finance.
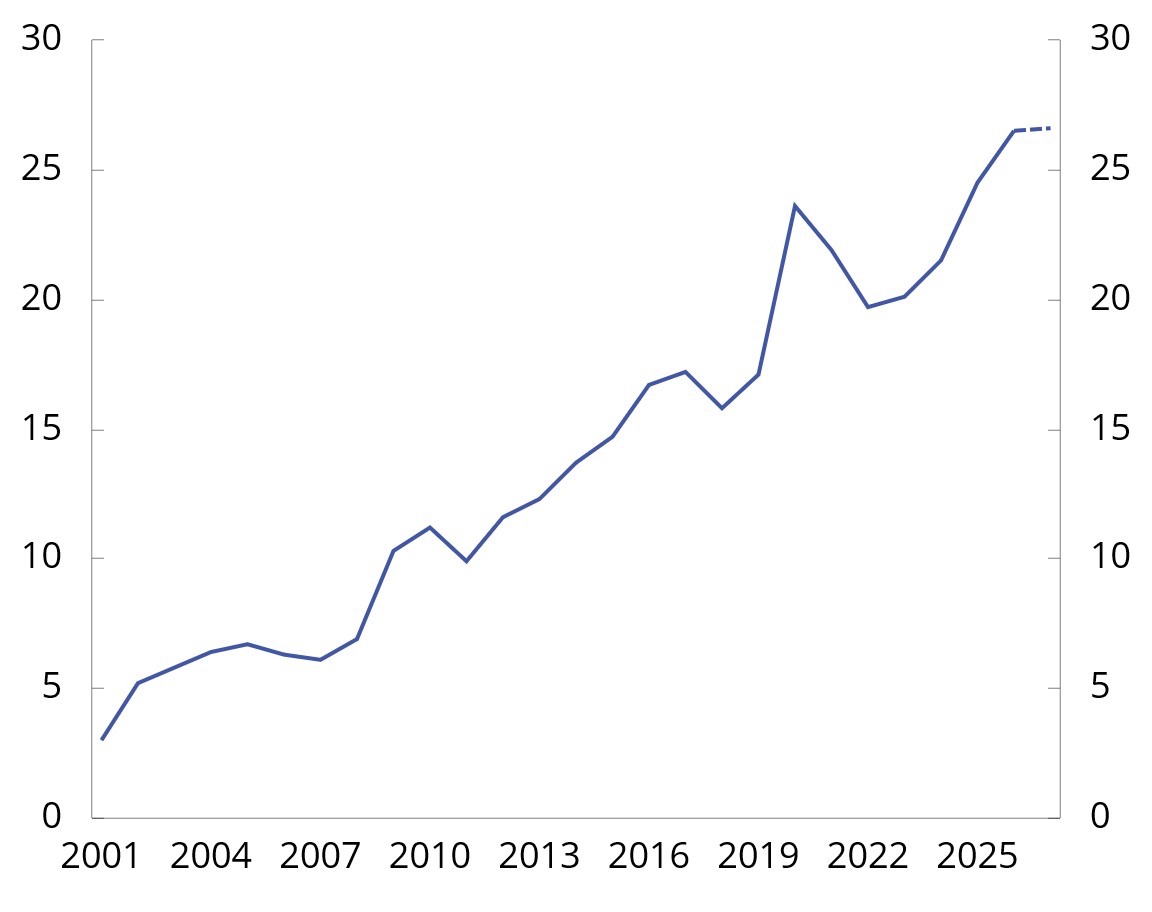
Chart 3.4 Fund spending as a share of fiscal budget expenditure. Per cent. 2001–2027
Source: Ministry of Finance.
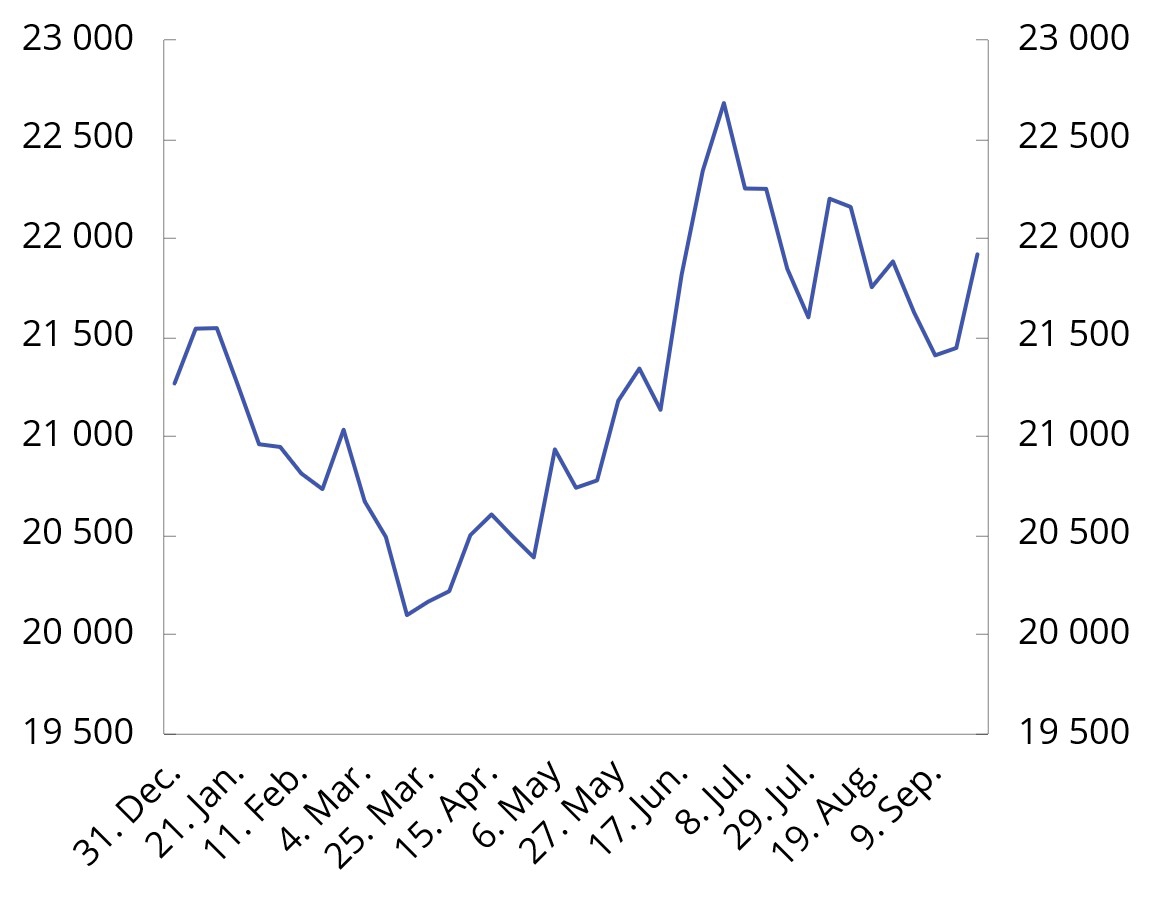
Chart 3.5 Market value of the Government Pension Fund Global. NOK billion. 31 December 2025–23 September 20261
1 Preliminary figures for September as the month has not ended.
Sources: Norges Bank Investment Management and the Ministry of Finance.
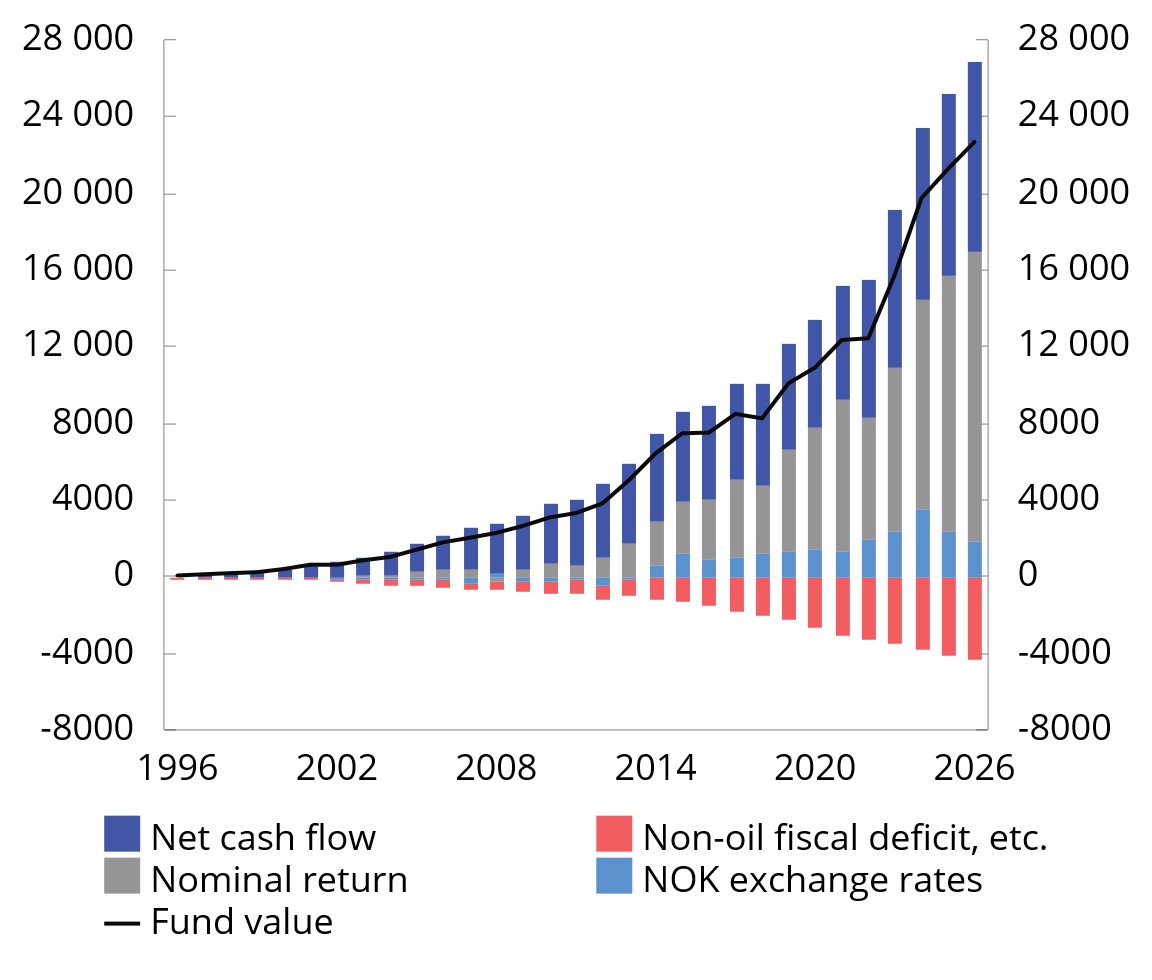
Chart 3.6 Contribution to change in the market value of the Government Pension Fund Global. NOK billion. 1996–20261
1 Fund value as of 31.12. For 2026, the market value is shown as of the first half of the year. The nominal rate of return is net of management costs.
Sources: Norges Bank Investment Management and the Ministry of Finance.
Budget effect calculations
In order to measure the effect of fiscal policy on economic activity, it must be taken into account that different public revenues and expenditure have different effects on the economy, and that temporary cyclical changes in taxes and unemployment benefits also affect activity. For example, tax revenues will increase and unemployment benefit payments will decrease during a boom, and the opposite in a recession.
Using the macroeconomic models KVARTS and NORA, the Ministry of Finance estimates how fiscal policy affects economic activity. The calculations show the impact on mainland GDP compared with a path where growth in public revenues and expenditure follows trend growth in the economy. In isolation, the budget proposal for 2027 is projected to increase mainland Norway GDP by 0.1–0.2 per cent next year, which can be interpreted as a broadly neutral fiscal policy stance. The effect on the economy is pulled up somewhat in 2027, as public demand is projected to grow somewhat faster than trend growth.
Fiscal policy influences economic activity over several years. Overall, fiscal policy in recent years is projected to have a neutral effect on the economy this year and next. The methods behind the calculations and differences in estimated budgetary effects in KVARTS and NORA are described in more detail in Appendix 2.
Table 3.2 Budget effects on mainland Norway GDP according to KVARTS and NORA.1 per cent
|
Effects on mainland Norway GDP |
||||
|
2025 |
2026 |
2027 |
2028 |
|
|
KVARTS |
||||
|
Budget proposal for 2025 |
-0,3 |
-0,4 |
-0,4 |
-0,3 |
|
Budget proposal for 2026 |
0,0 |
0,1 |
0,2 |
|
|
Budget proposal for 2027 |
0,2 |
0,3 |
||
|
2025–2027 overall2 |
-0,3 |
-0,4 |
-0,1 |
0,1 |
|
NORA |
||||
|
Budget proposal for 2025 |
-0,2 |
-0,1 |
-0,1 |
-0,1 |
|
Budget proposal for 2026 |
0,0 |
0,0 |
0,0 |
|
|
Budget proposal for 2027 |
0,1 |
0,1 |
||
|
2025–2027 overall2 |
-0,2 |
-0,1 |
0,0 |
0,0 |
1 The effect on economic activity is based on how various revenue and expenditure items (accrued) for the public administration as a whole develop compared with trend growth in the economy. The deviation from the baseline scenario is combined with fiscal multipliers. The multipliers are based on the models and describe the extent to which changes in various expenditure and revenue items influence economic activity. The effects of the so-called automatic stabilisers in the budget are taken into account, i.e. that unemployment benefit expenditure increases and tax revenues fall during a recession, while the reverse happens during a boom.
2 Due to rounding, summation of the individual items above may differ from the sum presented in this row.
Source: Ministry of Finance.
Other key figures
The non-oil deficit is the actual transfer from the Government Pension Fund Global to the fiscal budget. This is estimated at NOK 561.7 billion next year, see Table 3.3. The structural non-oil budget deficit measures the underlying use of fund resources, adjusted for the fact that tax revenues, certain expenditure that fluctuates with business cycles, and some other variables vary considerably from year to year. In 2027, deviations from trend for taxes and unemployment benefits account for most of the corrections.
Real underlying fiscal budget spending growth is estimated at 0.2 per cent from this year to next year (Table 3.4). This is lower than the average for subsequent years, which must be seen in the context of increased expenditure through 2026, for example in connection with the revised national budget. In addition, some of the increased use of fund resources next year will go to tax and fee reductions, while it has to a greater extent gone to expenditure increases in the preceding years.
The central government’s net cash flow from petroleum activities is estimated to fall from NOK 670.6 billion to NOK 568.4 billion from 2026 to 2027, see Table 3.5 and Box 3.4. In addition, the temporarily high tax revenues resulting from the discontinuation of the tax deduction account scheme in 2026 will be eliminated. Estimates of net allocations to the Government Pension Fund Global will therefore fall from about NOK 216 billion in 2026 to NOK 6.7 billion in 2027.
Table 3.3 The structural non-oil fiscal deficit1
|
2025 |
2026 |
2027 |
|
|
Non-oil fiscal deficit |
475,7 |
454,8 |
561,7 |
|
+ Net interest and transfers from Norges Bank. Deviations from trend |
33,0 |
14,1 |
8,7 |
|
+ Special accounting matters |
3,5 |
79,7 |
11,1 |
|
+ Taxes and unemployment benefits. Deviations from trend |
-4,8 |
34,8 |
26,9 |
|
= Structural non-oil fiscal deficit |
507,4 |
583,4 |
608,4 |
1 See Appendix 1 for a more detailed description of how the structural non-oil budget deficit is calculated.
Source: Ministry of Finance.
Table 3.4 Underlying fiscal budget expenditure1. Projections in NOK million and percentage change
|
2026 |
2027 |
|
|
State budget expenditure |
2 239 372 |
2 321 798 |
|
- Government petroleum activities |
35 500 |
35 000 |
|
- Unemployment benefits for the unemployed |
16 930 |
17 695 |
|
+ Interest expenses |
21 524 |
25 300 |
|
= Expenditure other than petroleum activities, unemployment benefits and interest expenses |
2 165 418 |
2 243 803 |
|
- Refugees in Norway financed through the aid framework |
3 358 |
2 581 |
|
+ Adjustment for pension premiums, etc., health enterprises |
2 842 |
3 413 |
|
= Underlying expenses |
2 164 903 |
2 244 634 |
|
Change in value in per cent. |
3,7 |
|
|
Price change in per cent. |
3,4 |
|
|
Volume change in per cent. |
0,2 |
1 The calculation of underlying expenditure growth excludes fiscal budget expenditure on government petroleum activities, interest expenses and unemployment benefits. In order to make expenditure comparable over time, adjustments have been made for extraordinary changes and certain accounting considerations in accordance with standard procedures.
Source: Ministry of Finance.
Table 3.5 Key figures in the fiscal budget and the Government Pension Fund. NOK billion
|
2025 |
2026 |
2027 |
|
|
Total revenue |
2 290,1 |
2 455,2 |
2 328,5 |
|
1 Revenues from petroleum activities |
692,7 |
706,1 |
603,4 |
|
1.1Taxes |
382,9 |
389,1 |
358,9 |
|
1.2Other petroleum revenues |
309,8 |
317,0 |
244,5 |
|
2 Revenues excluding petroleum revenues |
1 597,4 |
1 749,1 |
1 725,1 |
|
2.1Taxes from mainland Norway |
1 416,4 |
1 591,6 |
1 560,4 |
|
2.2Other income |
181,0 |
157,5 |
164,6 |
|
Total expenses |
2 101,8 |
2 239,4 |
2 321,8 |
|
1 Expenditure on petroleum activities |
28,7 |
35,5 |
35,0 |
|
2 Expenditure excluding petroleum activities |
2 073,1 |
2 203,9 |
2 286,8 |
|
Central government budget surplus before transfer to Government Pension Fund Global |
188,3 |
215,8 |
6,7 |
|
- Net cash flow from petroleum activities |
664,0 |
670,6 |
568,4 |
|
= Non-oil surplus |
-475,7 |
-454,8 |
-561,7 |
|
+ Transfer from the Government Pension Fund Global |
480,2 |
454,8 |
561,7 |
|
= Central government budget surplus |
4,5 |
0,0 |
0,0 |
|
+ Net provision for the Government Pension Fund Global |
183,8 |
215,8 |
6,7 |
|
+ Interest and dividend income, etc., in the Government Pension Fund1 |
462,5 |
460,2 |
515,0 |
|
- Transfer from the Government Pension Fund Norway |
11,7 |
12,3 |
13,4 |
|
= Combined surplus in the fiscal budget and the Government Pension Fund1 |
639,1 |
663,7 |
508,3 |
|
Memo: |
|||
|
Interest and dividend income, etc., in the Government Pension Fund Global |
444,4 |
440,1 |
493,7 |
|
Market value of the Government Pension Fund Global2 |
19 735 |
21 258 |
22 400 |
|
Market value of the Government Pension Fund2 |
20 116 |
21 675 |
22 847 |
|
Retirement pension commitments under the National Insurance Scheme2.3 |
11 375 |
12 043 |
12 744 |
1 Does not include capital gains or losses.
2 At the beginning of the year.
3 The net present value of existing accrued rights to future retirement pension payments under the National Insurance Scheme.
Sources: Ministry of Finance and Statistics Norway.