2.3 The balance of risks
The backdrop for the projections is a troubled world. So far, the war in the Middle East has not had the same consequences for the world economy as feared this spring. The risk of persistently high inflation, on the other hand, appears to be as great as earlier this year. The main risk factors are related to:
- The economic effects of the war in the Middle East. The war has contributed to higher inflation expectations and lower growth prospects for the world economy. Although the IMF points out that the world economy has so far fared better than feared, it points out that continued turbulence may lead to large movements in energy prices, bottlenecks in the production and delivery of goods and services, higher inflation prospects and higher interest rates. However, the risk goes both ways. If the level of conflict is reduced and the oil and gas market normalises rapidly, this could boost the global economy.
- Trade policy. There is persistent uncertainty related to US trade policy. The US has increased tariffs on a substantial share of its imports from Norway. There is a risk that customs duties may increase further and be higher than those imposed by the US on other countries. The overall effect on the Norwegian economy of higher tariffs on exports to the US is considered moderate in the short term, but for some businesses the consequences may be considerable.
- Persistently high inflation in Norway. Consumer price inflation has been above target for several years, and wage growth last year was higher than expected. International inflation is expected to be higher as a result of the turbulence in the Middle East. High inflation over time may prompt businesses and households to start planning for inflation to remain high. In that case, Norges Bank may have to raise the policy rate more than assumed. This may result in weaker and more unbalanced economic developments. Conversely, a faster-than-expected fall in inflation may provide a basis for earlier interest rate reductions and stronger and more balanced growth in activity.
- Rise in long-term interest rates. The increase in long-term interest rates, combined with high public debt, has increased the vulnerability of government finances in a number of countries (see discussion in Section 2.1). Higher interest rates make it more expensive to refinance debt and finance new budget deficits. Over time, this may limit fiscal space, particularly in countries with high debt and weak budget balances. If investor confidence in the sustainability of government finances weakens, higher risk premiums may amplify the rise in interest rates and further increase debt burdens. This may result in abrupt tightening of government budgets and weaker economic activity. At the same time, optimism related to artificial intelligence (AI) has stimulated investment and activity, and fuelled a rise in equity prices, particularly in the US. Expectations of higher productivity and earnings have probably helped counteract some of the negative effect that a rise in long-term interest rates normally has on equity prices. If expectations concerning the gains from AI are revised down substantially, both investment and equity prices may fall abruptly. In combination with high long-term interest rates, this may amplify the turbulence in financial markets and weaken growth prospects internationally and in Norway.
Box 2.3 Effect of electricity support and Norgespris on the CPI
The government introduced the electricity support scheme in December 2021 to help households deal with extraordinarily high electricity prices. In October 2025, the Government introduced Norgespris as an alternative to the ordinary electricity support scheme.
To illustrate the effect of the electricity support and Norgespris on the CPI from 2021 to 2025, Statistics Norway has, on request, calculated an index where the support schemes have been removed. In this index, power is measured at market prices, while the network tariff is at the same level as before the schemes were introduced. The series is called electricitysupport. The CPI, on the other hand, captures the actual electricity prices faced by households, including the electricity support scheme, Norgespris and reduced electricity tax. When the spot price increases, the gap between the CPI without electricity support and the CPI will increase (Chart 2.17). In August, the 12-month rise in the CPI without electricity support was 4.9 per cent, while the rise in the CPI was 3.3 per cent. The calculations based on observed market prices may overestimate the significance of the support schemes in curbing inflation somewhat if the schemes themselves have affected electricity prices through higher demand.
The consumer price index adjusted for tax changes (CPI-AT) shows a similar development to the CPI without electricity support. The CPI-AT is an index that measures the price development of goods and services adjusted for changes in indirect taxes, such as value added tax and excise duties. Statistics Norway considers the electricity support scheme and Norgespris to be subsidies, and the CPI-AT therefore measures electricity prices by the market price of electricity. Historically, the gap between the CPI and CPI-AT has been very close to zero, but since 2022 there has been a persistent deviation that correlates with the level of electricity prices (Chart 2.17).
In preparing the projections for the CPI, futures prices from financial markets for electricity are used. Futures prices are then adjusted to take into account how the electricity support scheme and Norgespris affect the prices faced by households. In the projections, it is assumed that the share using Norgespris will increase somewhat. In the projections for the CPI without electricity support, futures prices are used as a basis without such adjustments. For 2026, higher power prices are assumed than the previous year. This means that the CPI without electricity support is projected to grow by 4.3 per cent in 2026, while the projection for CPI growth for the same year is 1.0 percentage points lower (Table 2.3). For 2027 and 2028, futures prices indicate a decline in electricity prices from the previous year. This pulls the CPI projection without electricity support markedly down. The projection for CPI is less affected as the support schemes also dampen the effect of falling electricity prices.
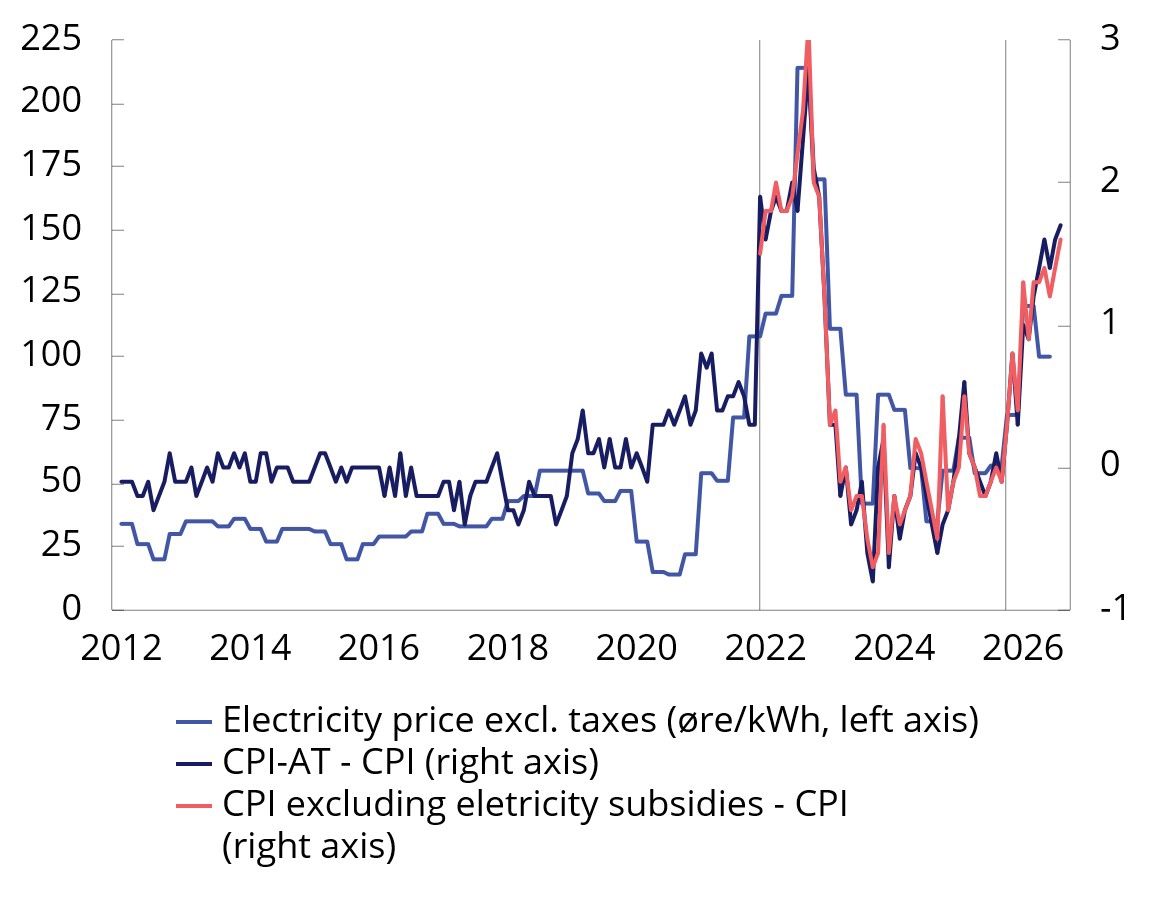
Chart 2.17 Electricity price and the gap between the CPI andrespectively, the CPI withoutelectricity support and CPI-AT. 2012–20261
1 The left and right axes are øre/kWh and twelve-month change in per cent, respectively. Vertical lines indicate December 2021 (when the government introduced the electricity subsidy scheme) and October 2025 (when the government introduced Norway’s price).
Sources: Statistics Norway and Ministry of Finance.
Table 2.3 CPI and CPI excluding electricity support. Percent.1 2021–2028
|
2021 |
2022 |
2023 |
2024 |
2025 |
2026 |
2027 |
2028 |
|
|
CPI2 |
3,5 |
5,8 |
5,5 |
3,1 |
3,1 |
3,3 |
2,7 |
2,4 |
|
CPI without electricity support3 |
3,6 |
7,7 |
5,4 |
3,0 |
3,2 |
4,3 |
2,4 |
2,1 |
1 Annual change.
2 2021–2025 is historical CPI from Statistics Norway table 03014. 2026–2028 are estimates prepared by the Ministry of Finance.
3 Electricity support includes the electricity subsidy scheme for electricity and grid tariffs, as well as Norgespris. 2021–2025 are historical figures compiled by Statistics Norway. Figures for 2026–2028 have been prepared by the Ministry of Finance.