5 Trends in the risk of acute pollution, and preparedness and response to acute pollution
It is a government objective to keep the risk of environmental damage from acute pollution at a low level in the Barents Sea–Lofoten area, and to make continuous efforts to reduce it further. To this end, preventive maritime safety measures and oil spill preparedness and response will be designed and dimensioned to effectively keep the risk of damage to the environment and living marine resources at a low level.
Risk is defined as a combination of the probability of an event occurring as a result of human activity and the consequences of that event, taking uncertainties into account. Thus risk is not a description of an actual event but of the possibility that an event may occur, and is therefore always associated with some degree of uncertainty. One of the primary aims of risk assessment is to identify uncertainties so that they can be addressed as far as possible and accidents and damage can be avoided. Trends in the risk level associated with acute pollution (the risk of spills) from maritime traffic, oil and gas activities and releases of radioactivity in the management plan area are discussed in section 5.1.
Environmental risk expresses the probability of a spill of oil or other environmentally hazardous substances combined with the scale of the expected environmental damage, taking uncertainties into account. The environmental risk level is assessed by combining the risk of acute pollution with the influence area and the presence of vulnerable species and habitats.
The environmental risk associated with acute pollution depends on a number of factors. The most important of these are the probability of a spill, the magnitude of a particular spill, its geographical position in relation to vulnerable areas and resources, when it occurs in relation to periods when vulnerability to pollution is particularly high and the spill trajectory. The effectiveness of preventive measures and of preparedness and response to acute pollution, is another important factor.
The authorities have conducted new environmental risk assessments for oil spills from petroleum activities off the Lofoten and Vesterålen Islands and Senja. These are discussed in section 5.2.
No new environmental risk assessments have been conducted for other parts of the management plan area. Since the environmental consequences depend considerably on the location of the spill, conclusions drawn from the specific spills and locations that have been analysed cannot be generalised to the whole management plan area. This means that there may be local, area-specific consequences of different types of spills that have not been analysed. However, assessments of the probability of a spill, the causal mechanisms, and the measures to prevent and/or limit the volume released are generally applicable to the whole of the management plan area. For example all the areas that have been identified by the Petroleum Directorate as possible fields in 2030 have been included in the risk assessments conducted so far.
No new comprehensive environmental risk analyses of maritime traffic have been conducted for the management plan area as a whole, but the Norwegian Coastal Administration has started work on an updated environmental risk analysis for maritime traffic along the coast of mainland Norway.
The Forum on Environmental Risk Management, which is headed by the Coastal Administration and has representatives from the Climate and Pollution Agency, the Petroleum Safety Authority Norway, the Institute of Marine Research, the Directorate for Nature Management and the Petroleum Directorate, has reviewed the preliminary lessons learned from the Deepwater Horizon oil spill in the Gulf of Mexico and assessed how far they are relevant to the present update of the management plan. The Forum’s report was submitted on 29 November 2010. Preparedness and response to acute pollution is discussed in section 5.3.
5.1 Trends in risk level in the management plan area
The level of activity in the Barents Sea–Lofoten area is relatively low, and the probability of acute pollution from shipping and petroleum activities is still considered to be low. However, collation of data on acute pollution incidents involving the petroleum industry on the Norwegian continental shelf with various activity indicators shows that there is no direct linear relationship between activity level and the number or severity of spills. The influence of activity level on the level of risk should not be overestimated.
In addition to the risk of acute oil and chemical pollution, there is a risk of accidents in connection with the transport of radioactive material through the management plan area.
5.1.1 Maritime traffic
The size of the tankers in transit through the management plan area increased substantially during the period 2005–09, but there were no significant changes in the overall volume of maritime traffic in the area during this period. Projections for the area indicate a small increase (about 3 %) in the total distance sailed in the period 2008–25 and a general increase in the distance sailed for most types of ships, with a marked increase for large oil and gas tankers. For fishing vessels, on the other hand, a decrease in distance sailed is expected. Trends in maritime traffic are discussed in more detail in Chapter 4.2.1.
DNV was commissioned by the Norwegian Coastal Administration to analyse the probability of acute pollution from shipping along the Norwegian coast, on the basis of traffic data from 2008 and projections for 2025. DNV concluded that the estimated increase in the volume of Russian traffic, combined with the increase in Norwegian exports of petroleum from the High North, means that there will be a marked rise in the probability of a spill up to 2025 along most of the coast of Nordland, Troms and Finnmark. Unless further maritime safety measures are introduced, the increase in tanker traffic will increase the probability of a major accident in this area. However, at present the probability of a spill is low, owing to the relatively low level of activity and the introduction of effective maritime safety measures, which are currently being extended to areas south of the Lofoten Islands.
There has only been one incident in the management plan area since 2005 that has resulted in acute pollution. This was in May 2009, when the Russian reefer ship Petrozavodsk ran aground on the southeastern shore of Bjørnøya. The ship had about 50 m3 marine diesel on board, much of which leaked into the sea. In the period 2005–09, the average number of ship-related incidents of acute pollution in Norwegian waters was around 90 per year, most of them involving small spills.
The environmental risk associated with maritime transport can be reduced by preventive measures or measures to reduce the consequences. Cleaning up after an oil spill is time-consuming and resource-intensive. It is more cost-effective to prevent accidents, not only to avoid loss of life but also to protect society and the environment from pollution.
Since 2005, a number of steps have been taken to improve maritime safety (see Box 5.1), which have considerably reduced the probability of accidents. The most important measures – the traffic separation schemes between Vardø and Røst, the Vardø vessel traffic service centre (Vardø VTS Centre), and the emergency tugboat services – are described below. Together they have considerably reduced the probability of two types of accidents, collisions and groundings.
With the approval of the International Maritime Organization (IMO), traffic separation schemes were established on 1 July 2007 between Vardø and Røst in the Norwegian exclusive economic zone. Under these schemes, tankers of all sizes and other cargo ships of gross tonnage 5 000 and over are required to sail about 30 nautical miles from land. There are two traffic lanes for shipping in opposite directions. Routeing high-risk traffic further away from the coast reduces the probability of accidents and acute pollution. The authorities have more time to intervene and provide assistance to ships in trouble, and the possibility of avoiding accidents is greater. The traffic separation schemes also reinforces the effects of other maritime safety and oil spill response measures.
The Vardø VTS Centre was established in 2007. It monitors all tankers and other high-risk traffic along the entire Norwegian coast, and whether vessels are complying with the rules of the routeing system. If the VTS Centre observes irregularities, it calls up the vessel, guides it onto the right route, and if necessary summons assistance.
The emergency tugboat services in Norway are in principle based on the availability of private actors. However, in North Norway it has been further developed, and the state has hired three all-year tugboats on short-term contracts, which are at the disposal of the Vardø VTS Centre. The Centre deploys them according to the risk picture, and they can be deployed rapidly to ships that are drifting out of control to prevent grounding, which would cause acute pollution.
Since the most cost-effective measures have already been introduced, there are few additional measures that would further reduce the probability of a spill from shipping up to 2025.
Textbox 5.1 Measures implemented since 2005 to improve maritime safety
The Automatic Identification System (AIS) for ships (information, tracking and collision prevention) has been introduced. It is estimated that the system has reduced the risk of collisions by 20 %.
Satellite-based monitoring of sea areas has been further developed.
The Vardø VTS Centre was established in 2007 and monitors high-risk traffic along the entire Norwegian coast, including Svalbard.
The traffic separation schemes between Vardø and Røst were established in 2007.
The emergency tugboat services have been further developed and three new tugboats have been hired on short-term contracts.
The new Act relating to ports and navigable waters entered into force in 2010. It applies in Svalbard, and the earlier Harbour Act was made applicable to Svalbard in 2008 in regulations.
The Norwegian Coastal Administration has developed a procedure for coordinating the actions of the authorities in situations where a vessel needs to be brought to a port of refuge. A prior assessment of suitable geographical areas has been made.
To limit the damage in the event of a spill, a provision was introduced in 2007 forbidding ships calling at the nature reserves in eastern Svalbard from carrying or using any fuel other than light marine diesel. Since 1 January 2010 a corresponding provision has applied in the three large national parks in western Svalbard as well. A temporary exception until 2015 has been made for the approach to Ny-Ålesund and the Magdalenefjorden.
5.1.2 Petroleum activities
The level of petroleum activity in the management plan area is currently low, with one gas field (Snøhvit) on stream and one oil field (Goliat) under development. At present, the risk of accidents and the probability of oil spills from the petroleum industry are low.
Trends in the probability of oil spills
The trends in the risk level between 2005 and 2010 have been assessed on the basis of:
spills and near misses that could have resulted in acute pollution if the barriers had failed, given the amount of petroleum activity in the management plan area;
corresponding data from the rest of the Norwegian continental shelf, since this provides an overall picture of the industry’s ability to prevent oil spills;
factors that influence the risk level, such as geographical location and trends in the types and scale of activities;
the extent to which risk-reducing measures have been implemented.
Since there have been few large oil spills on the Norwegian continental shelf, experience is limited. The risk of accidents in connection with petroleum activities has been assessed on the basis of historical data for different types of spills and a set of assumptions to estimate the frequencies of spills for different development concepts and exploration drilling. The historical data often consist of national and international statistics, which frequently vary in quality and volume and may not be representative of the specific circumstances for each area, field, installation, operator, well, vessel, etc. It is also obvious that historical data are only to a limited degree representative of what may happen in the future. Thus, the calculated frequencies do not indicate how often an accident will occur in the future and/or how serious it will be, only how often the various types of accident have occurred in the past.
Comparing the historical frequencies of spills from different development concepts shows that a small spill is much more probable (has a shorter recurrence interval) than a large one. The frequency of spills is also highest for the smallest spills within the category 1–1 000 tonnes. In Table 5.1 the frequencies of incidents of all types involving spills have been combined and expressed as average recurrence intervals (number of years between spills) for fields on stream (floating production, storage and offloading units (FPSOs), and seabed installations) and for exploration drilling.
Table 5.1 Recurrence intervals (number of years between spills) for spills from exploration drilling and fields on stream (floating production, storage and offloading units (FPSOs), and seabed installations)
Activity and spill volume | FPSOs, on stream | Exploration drilling (one oil well per year) | Seabed installations, on stream |
|---|---|---|---|
1–1 000 tonnes | 8.7 | 327 | 437 |
1 000–2 000 tonnes | 974 | 12 821 | 1 296 |
2 000–20 000 tonnes | 363 | 10 246 | 772 |
20 000–100 000 tonnes | 6 321 | 69 444 | 12 516 |
> 100 000 tonnes | 15 576 | 62 500 | 16 892 |
Source Ministry of Labour/Ministry of Petroleum and Energy
Oil and gas activities in the management plan area have not resulted in acute pollution of any significance during the period since the management plan was adopted. In 2008 a near miss occurred during exploration drilling that could have resulted in an oil spill if the barriers had failed.
The annual reports on trends in risk level published by the Petroleum Safety Authority Norway are an important tool for monitoring the development of risk levels in Norwegian petroleum activities. Since 2000 comprehensive data on accidents and unintended incidents in connection with oil and gas activities has been collected as part of this process. Up to the present, the data have been used to assess trends in risk levels for accidents to personnel and major accidents. In 2009 work was begun on the use of these data together with data from another established database (Environment Web) to monitor trends in the risk level for oil spills on the Norwegian continental shelf. This will provide a better basis for implementing preventive measures in areas where they will be most effective.
Together with the petroleum companies’ annual reports to the Climate and Pollution Agency on releases of oil and chemicals, the reports on trends in risk levels provide a good picture of developments on the Norwegian shelf. The risk data for 2001–09 and data from the Climate and Pollution Agency show that:
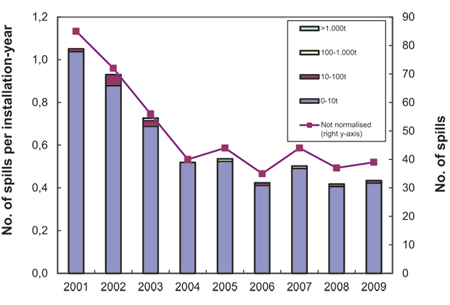
Figure 5.1 Number of near misses that could have caused a crude oil spill on the Norwegian continental shelf
Source Petroleum Safety Authority Norway
The total number of crude oil spills to the sea on the Norwegian shelf was more than halved in the period 2001–04 (from 85 to 40), and remained constant in the period 2004–09 (39 spills in 2009) (see Figure 5.1).
There was no clear trend in the size of crude oil spills in the period 2001–09 on the Norwegian shelf as a whole, but most of them were smaller than 1 tonne. Four of the largest spills on the Norwegian shelf in the period 2001–09 occurred during the five years prior to 2009. In 2007 there was a single spill of around 3 700 tonnes.
The number of near misses that could have led to spills on the Norwegian continental shelf declined throughout the period 2001–09, and the number of near misses per installation year in 2009 was the lowest for the whole period (see Figure 5.2).
Well control incidents and hydrocarbon leaks were less serious in 2008 and 2009 than in the period 2004–06, but after a generally positive trend in the last few years the number of near misses related to hydrocarbon leaks and well control incidents rose in 2009 for the Norwegian shelf as a whole.
Data on the availability of barriers intended to prevent near misses from developing into major accidents show stable levels for the Norwegian shelf as a whole, but some installations have substantially lower availability of barriers than the average for the industry.
Figure 5.2 Spills of crude oil to the sea on the Norwegian continental shelf in 2001–09
Source Petroleum Safety Authority Norway
Risk levels 2010–30
The level of activity is not expected to increase significantly up to 2030, when both the Snøhvit and the Goliat fields will be on stream. On the basis of assessments of the future level of activity in the management plan area, the Petroleum Directorate has also included an oil field with FPSOs and 11 production wells on stream. The scenario for 2030 also has an oil field with subsea templates with 11 wells on stream tied to an onshore facility by a 70-km-long pipeline. The Directorate included typical activities involved in well drilling in its evaluation of risk levels. However, the scale, type, location and technical solutions for future oil and gas activities are naturally very uncertain.
The probability of acute pollution is not expected to change significantly up to 2030, provided that the necessary preventive measures are implemented. Five priority areas of particular importance for maintaining low risk levels have been identified: choice of development concept/installation and other technical solutions, the actors involved, framework conditions, pace of development and icing conditions.
Reservoir and depth conditions are not considered to be particularly difficult in the assessed parts of the management plan area and have not been dealt with specifically in the description of risk-reducing measures.
The technical and operational barriers against oil spills that are to be used for Goliat are examples of preventive measures and are described in the next section.
Implementation of risk-reducing measures since 2006
A number of risk-reducing measures have been implemented since 2006 to maintain a low risk of accidents and further reduce the risk level. These include the measures implemented by the industry to prevent hydrocarbon leaks, maintain well integrity and improve chemicals management.
R&D projects have been begun or conducted on improving understanding of risk, adapting technology, planning and monitoring of operations, improving early detection of operational deviations, promoting more rapid and effective intervention, and improving access to essential information. R&D has also reduced the level of uncertainty for a number of factors that influence the risk level. For example several projects have been carried out to improve weather data and understanding of reservoirs and to provide a better overview of trends in the level of collision risk in relation to trends in maritime traffic.
The criteria for granting production licences have become stricter, so that only companies with operational experience and good financial capacity are eligible for difficult operations.
Cooperation between authorities in oil-producing countries has been strengthened and is resulting in transfers of experience, competence development and standardisation, all of which will reduce the probability of oil spills. A cooperation project under the Barents 2020 scheme has been established for petroleum activities in the High North. The project is headed by DNV and both Norwegian and Russian actors are involved. The aim is to identify the security challenges posed by oil and gas activities in the area, and recommendations will be made for HSE standards for oil and gas activities applicable to Norwegian and Russian operations in the Barents Sea.
The authorities should follow up petroleum companies closely in order to ensure sound management of the environmental risks inherent in oil and gas activities in the management plan area. For example, the plan for development and operation of the Goliat field contains an explicit description of site-specific factors that are considered to influence the risk of acute pollution and the measures that will be implemented to manage and reduce it. The technical and operational barriers used in this field to prevent acute pollution are considered to represent a minimum level for future developments in the area. The following are examples of such barriers:
well design, including a hole diameter that will reduce the volume of potential seepage;
well completion design with a life cycle that reduces the need for well interventions;
well programme, including pilot wells and drilling sequence;
robust design of well barriers, including dual safety valves in the wells;
only one reservoir to be open at a time;
decommissioning of all wells when the processing installation is decommissioned;
robust design and materials adapted to expected weather and icing conditions;
use of welded pipe joints to minimise leakage points;
shutdown valves on the riser on the seabed;
choice of materials, design and reliability of the subsea leak detection system.
Accident in the Gulf of Mexico and risk of blowouts
The Norwegian authorities are concerned about the accident in the Gulf of Mexico in 2010 and other similar accidents, particularly since the possibility of a major accident on the Norwegian continental shelf cannot be ruled out. The results and recommendations from investigations of the Deepwater Horizon accident are being followed up and evaluated by the different supervisory authorities in Norway, and also, as regards the assessment of environmental risk, across administrative boundaries. The authorities are giving priority to studies of the causes of the accident and the course of events, and are making active use of lessons learned from this accident in order to avoid similar incidents in Norway.
The Gulf of Mexico oil spill has resulted in a number of learning processes and improvements in Norwegian and international petroleum activities. One of the issues in focus is that of preparedness measures to halt blowouts at the source. At present drilling of a relief well is the only way of stopping a blowout if all other barriers have failed and cannot be repaired and if the blowout does not stop of its own accord (for example because the well has collapsed). In the Gulf of Mexico the blowout was finally stopped by technology developed by BP to cap the wellhead, cut off the oil stream and kill the well. In the light of this experience the Petroleum Safety Authority has requested the Norwegian petroleum industry to investigate emergency measures to deal with blowouts that are more effective than drilling a relief well. Work is also being done in this area internationally. For example four of the major companies in the Gulf of Mexico have undertaken to develop, within a short time frame, technology to stop blowouts at an earlier stage.
Textbox 5.2 Facts about the Gulf of Mexico oil spill
On 20 April 2010 an explosion occurred on the Deepwater Horizon drilling rig off the coast of Louisiana in the Gulf of Mexico, which resulted in a fire. The mobile offshore drilling unit was drilling on the Macondo Prospect at a depth of about 1 500 metres, about 80 km from the coast. The explosion killed 11 men and injured 17 others. The rig sank and this started a major oil spill that continued to flow until 15 July 2010.
The accident resulted in the largest marine oil spill ever recorded, amounting to an estimated total of almost 800 000 Sm3 (4.9 million barrels, corresponding to approximately the volume carried by two supertankers) during the 87 days before the well was capped.
Extensive resources were deployed to contain, disperse and remove the oil and limit the damage. At its peak the response involved around 50 000 people and more than 8 000 vessels. Six months after the accident, more than 25 000 people were still engaged in the clean-up operation. About 900 km conventionalbooms and 3 000 absorbent booms were deployed, and approximately 7 000 m3 dispersants were used altogether. About 1 040 km of the shoreline became covered in oil, 209 km of which was moderately to heavily polluted. In all, 8 183 oiled seabirds, 1 144 oiled sea turtles and 109 oiled marine mammals were found. At the worst almost 37 % of the US part of the Gulf was closed to all fishing. Although the area is being gradually re-opened, on 1 March 2011 a small area above the spill point was still closed.
Considering the size of the spill, the stretches of coastline that were seriously affected were relatively small. The surface temperature of the sea in the Gulf of Mexico is around 32 °C, and the high sea and air temperatures and strong sunshine had considerable consequences for the degree of weathering of the crude oil on the surface. Large quantities of oil were dispersed in the water column and did not reach the surface.
The first main report of the commission established by President Obama to investigate the accident was delivered on 11 January 2011. Some of the conclusions so far indicate that the accident could have been prevented. It has also been found that although the accident was not caused by external factors such as water depth or drilling conditions, these factors made it difficult to cope once the accident had happened. Weaknesses were identified in:
organisation and follow-up by the authorities;
the US regulatory approach and distribution of responsibility;
the management’s overall risk management system:
the organisational safety culture.
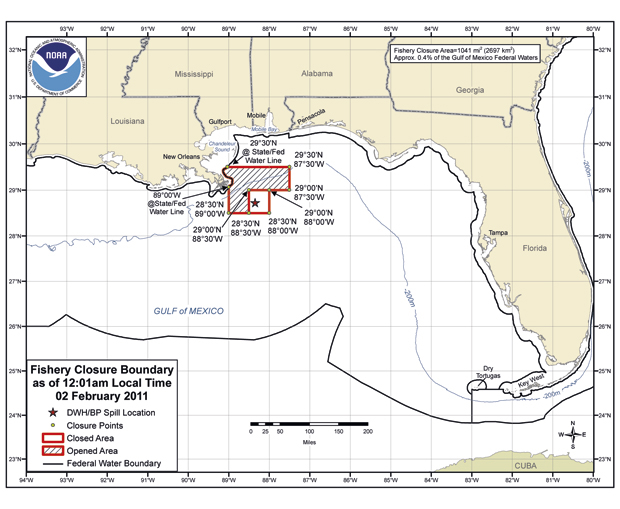
Figure 5.3 Areas closed to fisheries in the gulf of Mexico on 2 February 2011.
Source National Oceanic and Atmospheric Administration
Textbox 5.3 Follow-up of the Gulf of Mexico oil spill in Norwegian safety work
The Petroleum Safety Authority Norway has established a project group to systematise and evaluate the experience and investigations of the Mexico oil spill. Many of the recommendations of the presidential Oil Spill Commission are already part of the Norwegian HSE system. However, the report also describes a number of conditions that are not unique to the US and that should be examined more closely to see whether they apply to the Norwegian petroleum industry.
The Petroleum Safety Authority’s work has already had the following results:
Priority is being given to analysis of factors related to well integrity, design and construction.
The industry has been asked to evaluate its emergency response principles for stopping a subsea blowout and to examine the existing strategies for limiting damage until a blowout can be halted.
The industry has been requested to examine alternative methods for killing wells (in addition to relief wells) in order to reduce or halt the oil stream.
Stricter criteria for the awards of production licences have been applied from the 21st licensing round. For licence awards for deepwater and/or high pressure/high temperature (HPHT) areas, the operator and at least one other licensee are required to have experience of drilling at least one well on the Norwegian continental shelf as an operator, or similar experience. The requirement for at least one licensee to have drilled an HPHT well or a well in a very deep-water field as the operator continues to apply. This means that the safety authorities may not as a rule recommend the granting of 100 % ownership in any production licence for very deep-water or HPHT developments. The aim is to ensure that only the most experienced and competent operators operate in such areas.
The accident resulted in many tragic consequences, including loss of life, but it has also succeeded in moving questions about the environmental impacts of major oil spills and the capacity of oil spill preparedness and response to a high place on the agenda at national and international level. The accident shows that the most effective response measures are to prevent oil spills from occurring and to limit the volume of hydrocarbons that can be released.
There are reliable figures for the period 1988–2007 for the numbers of wells drilled, blowouts and serious well incidents that could have led to a blowout if the barriers had failed for the North Sea (Norway, the Netherlands and the UK), and the US part of the Gulf of Mexico. The most widely recognised source of blowout data is the SINTEF Offshore Blowout Database. Its data show that 95 % of blowouts occurred and two-thirds of the wells were drilled (20 blowouts and 19 870 wells) in the US part of the Gulf of Mexico, while 5 % of blowouts occurred and one-third of the wells were drilled (1 blowout and 9 986 wells) in the North Sea. Thus, the ratio of blowouts to wells drilled has been significantly higher in the US part of the Gulf of Mexico than in the North Sea. Before the Deepwater Horizon accident in spring 2010, the Bravo blowout in the North Sea in spring 1977 was ranked as one of the largest offshore blowouts.
5.1.3 Radioactivity
The potential sources ofreleases of radioactive material in the management plan area today are connected with the transport of spent reactor fuel and with nuclear-powered vessels. There is also a possibility that floating nuclear power plants will be built in the Russian part of the Barents Sea, which will increase the risk of pollution. The Russian authorities are developing floating nuclear power plants for use in relatively inaccessible locations in the Arctic, the first of which is scheduled to be completed in 2012. Transport or towing of such power plants through the management plan area would increase the risk. Today, an onshore nuclear accident, for example at the nuclear power plant on the Kola Peninsula or the reprocessing plant at Sellafield, would represent the greatest risk of inputs of radioactive material via air and water from sources outside the management plan area.
Maritime transport of radioactive material has increased since 2005. One transport of spent reactor fuel took place in 2009 and five in 2010, and a further increase is expected up to 2025. In principle there is no notification requirement for maritime transport of spent reactor fuel in international waters and Norwegian waters outside the baseline. However, the Emergency Response Department of the Norwegian Coastal Administration, the Vardø VTS Centre and the Norwegian Radiation Protection Authority have introduced a notification procedure that will ensure a reciprocal exchange of information when one of these agencies becomes aware of such a transport. In such cases the Maritime Directorate and the Norwegian Joint Headquarters will also be notified. The Radiation Protection Authority is the competent authority in the field of radiation protection and nuclear safety. The Authority is not formally notified until radioactive material is to cross the border or the baseline, but receives information about most transports through its own channels. Information about such transports is exchanged between the Radiation Protection Authority, the Norwegian Coastal Administration and the Norwegian Joint Headquarters, and the transports are kept under continual observation by the Vardø VTS Centre while they are in Norwegian waters.
There is no requirement to notify coastal states of maritime transport of radioactive material, but the International Atomic Energy Agency (IAEA) General Conference recommends that the practice of notification of coastal states by the sending state is followed. The Norwegian authorities will follow up the recommendation in order to strengthen and improve notification procedures. However, it should be noted that such transports are also covered by the Convention on the Physical Protection of Nuclear Material, which makes it a requirement to protect the confidentiality of any information received, in part to prevent attempts by unauthorised actors to interfere with the transport and threaten its safety.
In 2001 the IAEA concluded that the probability of a serious accident at sea involving transport of high-level radioactive waste was very low. The conclusion is based on the fact that high safety standards are maintained through the requirements established for the containers in which the waste is transported to the ship. The Agency considers that if this type of vessel meets with an accident it is unlikely that the radioactive material will leak out of the containers, but it also points out that any releases could lead to serious pollution.
There is considerable activity to reduce the risk of radioactive pollution in international forums such as the IAEA, OSPAR and the London Convention and Protocol, and bilaterally through for example the close cooperation between Norway and Russia. The following measures reduce the risk of radioactive releases and the probability of acute pollution incidents in the management plan area:
The Government’s Nuclear Action Plan focuses on nuclear safety in northwestern Russia and has led to increased attention being paid to risk-reducing measures, preparedness, monitoring and competence development.
In 2006 it was decided to include Svalbard and Jan Mayen in Norway’s nuclear accident preparedness, and contingency plans are being drawn up.
The Norwegian Coastal Administration and the Radiation Protection Authority have concluded a cooperation agreement on exchange of information, notification and a preparedness and response system for dealing with incidents at sea.
In September 2009 the last radioactive source in lighthouses along the coastline of northwestern Russia was removed.
Norway is providing assistance for the dismantling of decommissioned nuclear vessels. Of the 198 nuclear submarines that have been decommissioned, 120 were located in northwestern Russia. Norway has financed projects to secure spent nuclear fuel and dismantle five submarines. Today only two of the original 120 submarines remain to be dismantled. The original date for completion was 2010, but was delayed until 2011.
5.2 New analyses of environmental consequences and environmental risk for the areas off the Lofoten and Vesterålen Islands and Senja in the event of oil spills
Environmental risk expresses the probability of a spill of oil or other environmentally hazardous substances combined with the scale of the environmental damage expected, taking uncertainties into account. The environmental risk level is assessed by combining the risk of a spill with the influence area and the presence of vulnerable species and habitats. The species and habitats most vulnerable to an oil spill are seabirds, marine mammals, the shoreline and the recruitment stages of fish.
A traditional scenario-based approach is used to assess the possible impacts of oil spills, in which a relevant range of acute pollution incidents and their consequences are postulated. The following factors have a decisive influence on the assessment of the environmental consequences and environmental risk:
the probability that an incident will occur;
the choice of scenario and discharge point;
the oil drift model used (i.e. the vertical and horizontal spread of the oil);
the geographical distribution of environmental resources;
the vulnerability of environmental resources;
the method used to calculate/assess the environmental consequences and environmental risk.
A description of environmental risk does not provide a complete picture or measure of the way a particular incident will develop and what damage it will cause. Assessments of the risks to vulnerable environmental resources are always simplified, since they are based on a set of assumptions. This means that there are limitations and some level of uncertainty attached to the results.
5.2.1 Oil spill scenarios and discharge points on which the analyses are based
Nine oil spill scenarios were developed for use in modelling the drift and spread of oil in the event of a spill, and risk analyses were carried out for oil spills at selected discharge points off the Lofoten and Vesterålen Islands and Senja. Most of them are for oil and gas activities (and petroleum-related shipping). They are based on the types of incident and types and volumes of oil considered to be representative of petroleum activities in the management plan area. The discharge points (see Figure 5.4) were selected on the basis of assumptions about future petroleum activities (including petroleum-related shipping) and mapped petroleum prospects off the Lofoten and Vesterålen Islands and Senja, but a scenario for a major shipwreck southwest of Røst was also modelled. Table 5.2 shows an overview of the various scenarios and discharge points. The environmental risk analyses focused mainly on scenarios 2, 4 and 7. The analysis of scenario 8 is restricted to discharge point 2 in Nordland VII, and does not include the nearcoast discharge points in Nordland VI and VII or Troms II.
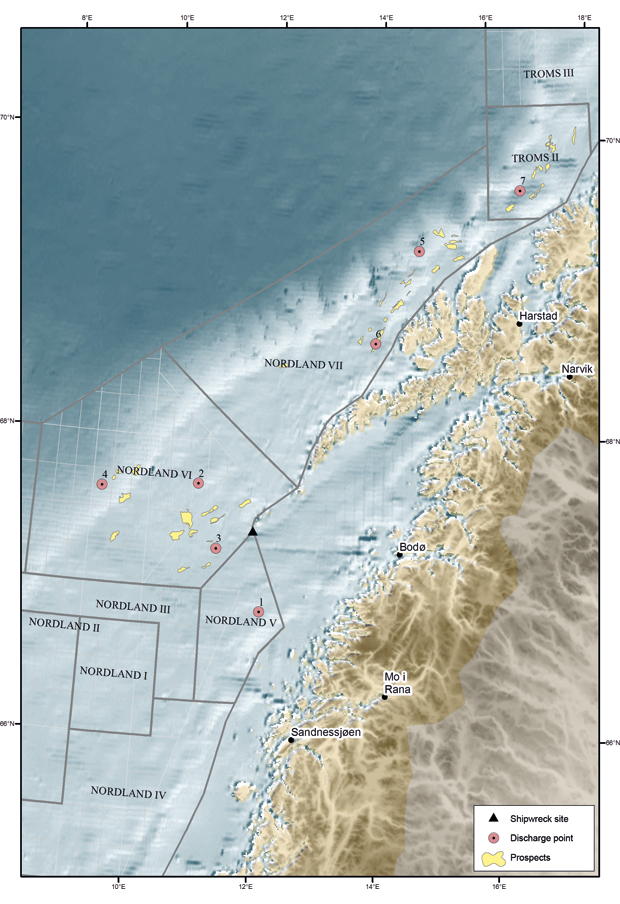
Figure 5.4 Discharge points used in the scenarios
Source Petroleum Directorate
Table 5.2 Oil spill scenarios
Scenario no | Spill rate (tonnes /day) | Spill duration | Spill volume (tonnes) | Scenario representative of incident type | Discharge point (Figure 5.4) | |
|---|---|---|---|---|---|---|
Oil drift forecasts | Environmental consequences analysed for discharge points | |||||
1 | 500 | 2 hours | 42 | B, E | 1, 2, 5, 7 | 2 |
2 | 35 | 14 days | 490 | D | 1, 2, 5, 7 | 1, 2, 5, 7 |
3 | 1 000 | 2 days | 2 000 | 1, 2, 5, 7 | 2 | |
4 | 4 500 | 2 days | 9 000 | A, C, F, G | 1–7 | 1, 2, 3, 5, 7 |
5 | 8 500 | 2 days | 17 000 | I, J | 1, 2, 3, 5, 7 | 2, 3 |
6 | 5 400 1 000 200 | 2 days 13 days 35 days | 29 000 | A (declining discharge rate) | 1, 2, 5, 7 | 2 |
7 | 4 500 | 14 days | 63 000 | 1, 2, 5, 7 | 1, 2, 5, 7 | |
8 | 4 500 | 50 days | 225 000 | 1–7 | 2 | |
9 | 15 000 | 4 days | 60 000 | Shipwreck* | Shipwreck | Shipwreck |
A = Blowout; B = Well leak; C = Pipeline leak; D = Riser leak; E = Process leak; F = Spill from storage tank; G = Spill during loading/unloading; I = Vessel collision with installation; J = Spill from shipping
* Shipwreck off Røst in Nordland VI.
Most of the incident types (blowout, well leak, spill during loading/unloading, etc) have a large sample space with regard to total spill volume (rate and duration), and the scenarios are based on representative spill volumes within the sample spaces. Scenarios 4 and 5 are of the same magnitude as the Ekofisk Bravo blowout in 1977. The Bravo blowout lasted for a week and released 10 000–17 000 tonnes oil; it is the largest oil spill from petroleum activities that has occurred on the Norwegian continental shelf. In addition, one scenario was chosen of a blowout of 4 500 tonnes oil per day lasting 50 days, which is intended to represent a very serious scenario for the Barents Sea–Lofoten area. The spill volume in scenario 8 is almost one-third of the spill in the Gulf of Mexico. The spill volumes in the various scenarios range from 42 tonnes to 225 000 tonnes oil.
After the Gulf of Mexico oil spill, the worst-case scenario was re-assessed. For the work on the management plan it was concluded that a scenario involving 4 500 tonnes oil per day for 50 days was still representative of a serious blowout that should be taken into account in decision-making for the Barents Sea–Lofoten area.
The Forum on Environmental Risk Management also pointed out the need to further develop the criteria for selecting information relevant to an environmental risk assessment.
5.2.2 Oil drift modelling
Oil drift was modelled for all the oil spill scenarios and discharge points shown in Table 5.2, and the results provide a basis for further assessment of environmental consequences and environmental risk. The resource estimate for oil is higher than for gas in Nordland VI and VII. In Troms II it is most likely that gas will be found, and condensate was therefore modelled for this discharge point. The modelling is focused on oil drift in the open sea and is less detailed for coastal areas. Emergency response measures taken in the event of a spill will limit the spread of oil and subsequent damage.
The simulations show that the duration and size of the spill influences the drift and spread of the oil and the influence area. The oil type and its properties are also important in determining the influence areas on the sea surface and in the water column. The results show that as a rule the extent of the influence area increases with the duration of a spill (see Figures 5.5 and 5.6). The spill rate also affects the extent of the influence area, but according to the simulations, less strongly than the duration. However, an increase in rate will result in larger volumes of oil in the influence area. The location of the discharge point in relation to land and coastal currents also has considerable influence on the drift and spread of the oil and the probability of stranding.
Spills from discharge points near the coast and further out to sea were modelled. Most of the discharge points are in the vicinity of the coastal current, but some are further out from land. The extent of landfall was calculated for all the scenarios modelled (different spill sizes) for all discharge points in Nordland V, VI and VII, with the exception of the seabed spill at discharge point 2 in scenarios 1 and 3. For many of the scenarios the simulations show a generally high probability of landfall: a probability of up to 30–80 % for scenario 4 and up to 70–100 % for the most serious scenarios. The shoreline extent of the influence areas for spills from all discharge points was relatively large in scenarios 2 to 9. This is mainly because the coastal currents carry the oil northwards along the coast. In Troms II the release of condensate from a nearcoast discharge point was modelled. As a rule condensate dissolves more rapidly in water than oil does, and the simulations show a smaller influence area for condensate than for oil, with no landfall for the smaller releases. However, the probability of landfall was high (30–40 %) for large releases of condensate from this discharge point.
There was a high probability of landfall of oil released from the nearcoast discharge points (Nordland V, VI and VII). If the release is prolonged, large volumes of oil are likely to reach coastal areas. Simulation of a blowout from a discharge point in Nordland VI further from the coast and outside the coastal current shows that the oil will affect open sea areas to a greater extent, but also indicates that it will be swept into the coastal current at the point where the geological continental shelf is at its narrowest, and then carried towards the coast of the Vesterålen Islands, including Andøya, and the mainland further north. A representative spill of 4 500 tonnes per day for 2 days from any of the discharge points apart from number 4 will have a very short expected drift time to shore: from a minimum of 1.5 days (Nordland VI, discharge point 2) to 0.3 days (Nordland VII, discharge point 6) up to 6.3 days further from the coast (discharge point 4). The average drift times for scenarios with landfall are 2.3 days for discharge point 1 (Nordland V), 4.1, 7.3 and 13 days for discharge points 3, 2 and 4 respectively (Nordland VI), 1 and 6 days for discharge points 6 and 5 respectively (Nordland VII) and 4 days for Troms II.
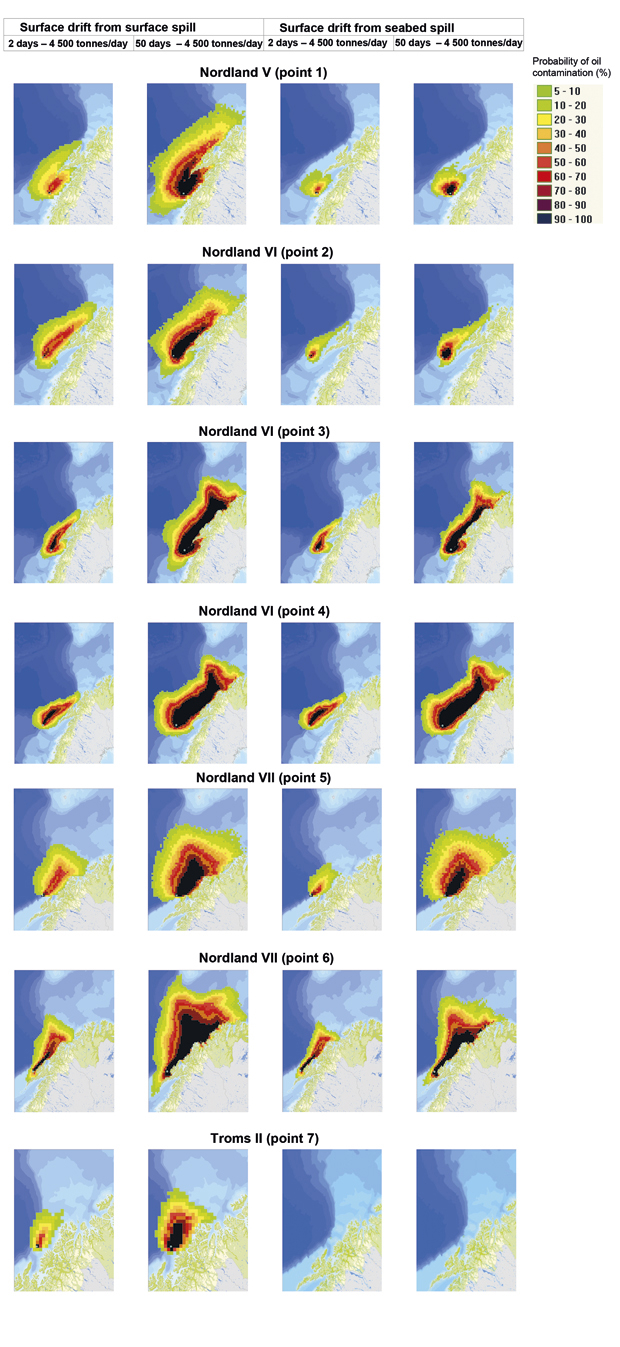
Figure 5.5 Results of modelling of oil spills off the Lofoten and Vesterålen Islands and Senja. The maps show the probability (%) of oil contamination on the surface (influence areas) for discharge points 1–7. The simulations are based on surface spills and seabed spills of 4 500 tonnes/day for 2 days and 50 days. The probabilities are calculated from 230–330 simulations for the 50-day spills and 1 120 simulations for the 2-day spills.
Source DNV
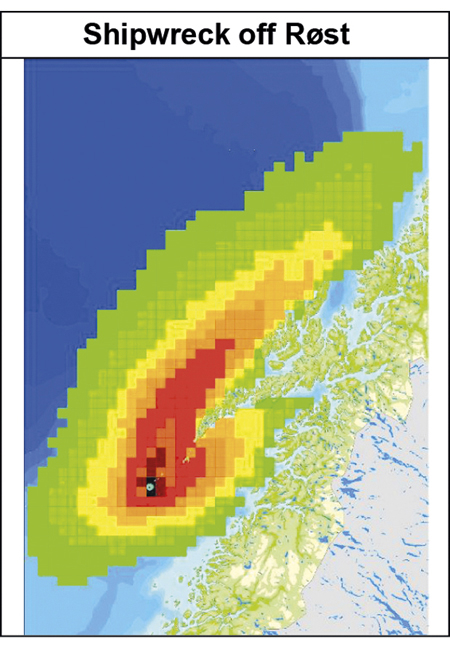
Figure 5.6 Result of modelling of an oil spill from a shipwreck off Røst in Nordland VI, with a spill of 15 000 tonnes/day for 4 days. The map shows the probability of oil contamination.
Source DNV
In the case of discharge point 6 (Nordland VII), which is 18 km off the coast of the Vesterålen Islands, modelling gives a high probability that the oil will contaminate long stretches of coastline. For 4 500 tonnes per day for 50 days simulations show an 80–100 % probability of landfall of oil from the Vesterålen Islands to Sørøya off Hammerfest.
Figure 5.5 shows the influence areas on the surface for a spill rate of 4 500 tonnes per day and a spill duration of 2 and 50 days respectively for the different discharge points. The modelling results for the other scenarios can be found in the background documents. Figures 5.5 and 5.6 show the probability of oil contamination in 10 km by 10 km grid cells for scenarios 2 and 4 and the shipwreck scenario. It should be noted that the influence areas do not show the area covered by a single spill but the overall area of contamination shown by all the simulations that have been run for each spill. The calculations of the environmental consequences in the next section do not take into account the emergency response measures that would be implemented and that could limit the spread of the oil and thus the damage caused.
Textbox 5.4 Choice of relevant scenarios from a safety perspective
Scenarios are also used in a number of different ways by the public administration. Modelling scenarios clarifies the type of preventive measures and preparedness and response that are necessary. Purely quantitative assessments based on historical data may not always be representative and provide little information that can be used in risk management. This applies especially to major accidents, which are low-probability but high-consequences events.
The assessments on which the choice of scenarios is based must therefore take several different types of information into account to compensate for the limitations in the data material and the approach. The assessments developed for the management plan are based on available experience and information on petroleum activities on the Norwegian continental shelf (including the Barents Sea–Lofoten area), accidents and management of the risk of accidents, and national and international statistics. The information must:
be relevant to the type of decision to be made,
contribute to a good, well-balanced understanding of risk (must explain the assumptions, element of uncertainty and limitations),
contribute to a good understanding of which measures will achieve the goal of maintaining a low risk level in the management plan area,
form a sound basis for decisions that will result in risk reduction.
5.2.3 Assessment of the environmental consequences and environmental risk
Environmental consequences
The assessments of environmental consequences in the present update make use of a great deal of new knowledge that was not available when the 2006 management plan was drawn up. The information comes from surveys, research and new methods and/or models for assessing the distribution of species and habitats and for calculating environmental consequences.
The environmental consequences for fish, fish eggs and larvae, seabirds, marine mammals and the shoreline were analysed in background reports for several of the discharge points and scenarios described above. The oil drift forecasts and environmental consequences analysed are shown in Table 5.2. The analyses of environmental consequences and environmental risk focused mainly on scenarios 4 and 7. The analysis for scenario 8 only included discharge point 2.
The scale of the damage will vary depending on whether the contamination affects fish, seabirds, marine mammals or the shoreline. The scale of the consequences of a particular oil spill also depends on the size and duration of the spill, the exposure time for species and habitats, the timing of the discharge and location of the discharge point, the potential exposure of vulnerable species and habitats, including the coastal zone, and the oil type. The presence of species that are vulnerable to oil varies over the year, and thus the damage potential of an oil spill will vary for different species according to the season.
Consequences for seabirds
The simulations run for scenarios 2 and 4 (representative of various types of incidents during petroleum activities) and scenario 7 (4 500 tonnes/day for 14 days) show that the consequences for seabirds vary. For the largest spill volume in these three scenarios (scenario 7), there is generally a probability of high percentage population losses (in the intervals 5–10 %, 10–20 %, 20–30 % and >30 %) for many of the species in the management plan area. For scenario 4, the results show that there is a probability of high percentage population losses for certain important species in the areas and a probability of population losses in the interval 1–5 % for a larger number of species. The consequences are generally smallest for scenario 2, but there is nevertheless a relatively high probability of population losses in the interval 1–5 % for several species. The consequences are smallest for discharge point 7 in Troms II, since it features condensate with a high degree of weathering. The influence area is therefore smaller than for oil.
No demonstrable consequences were found for scenario 2, since in this case the condensate did not reach the shore. However, large spill volumes from this discharge point are still associated with a high probability of population losses for certain species. The results for scenario 7 show that Atlantic puffin is most at risk, since there is an 85 % probability that 1–5 % of the population will die if there is a spill during the summer, while for a winter spill the probability is almost 80 %. The simulations for the nearcoast discharge points in Nordland V and VI show the greatest environmental consequences; even for the smallest discharge volume (scenario 2) there is a high probability of population losses for several of the species analysed (for example up to 90 % probability of a population loss of 1–5 % for puffin, and up to 80 % for common guillemot).
The simulations showed that the consequences of spills from discharge points on the seaward side of the coastal current were smaller for the scenarios involving the smallest spills, but serious for the largest spills. Environmental consequences have not been assessed for the nearcoast discharge point in Nordland VII (number 6). The oil drift results indicate that the environmental risk is high, since there is a high probability of oil contamination along long stretches of shoreline and of large volumes of oil combined with the presence of large numbers of vulnerable species and areas of vulnerable habitats in the water column, in the open sea and in the coastal zone. To learn more about the environmental consequences and risk associated with this scenario, it will be necessary to carry out environmental risk analyses using the data from oil drift modelling.
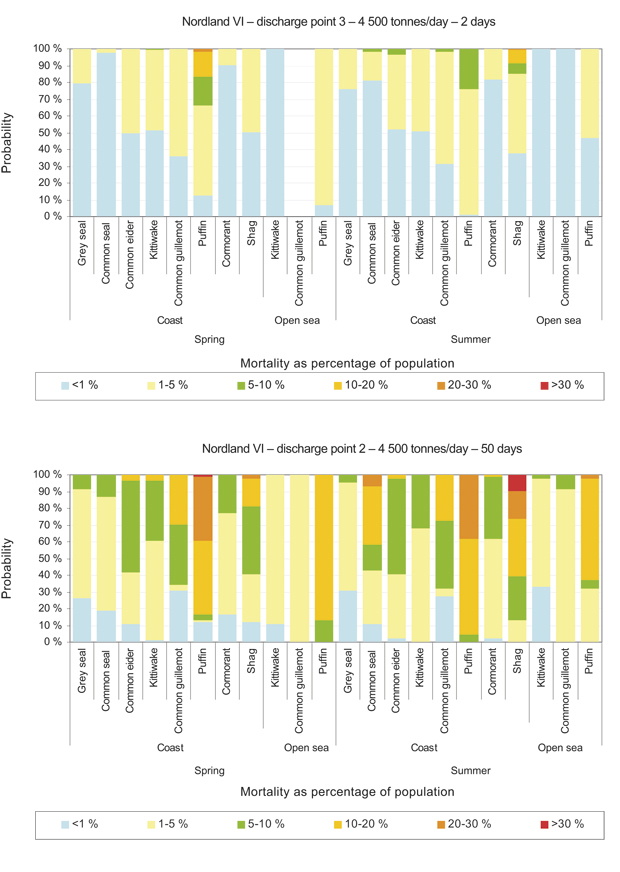
Figure 5.7 Consequences for seabirds and marine mammals. Probability of different levels of population loss for various species. Upper panel: consequences of a spill of 4 500 tonnes/day for 2 days at discharge point 3. Lower panel: a spill of 4 500 tonnes/day for 50 days at discharge point 2.
Source DNV 2010.
The Lofoten and Vesterålen Islands and the Barents Sea are very important areas for seabirds. The good food supplies in the Norwegian Sea and the Barents Sea support large populations of colony-nesting seabirds along the mainland coast, on Bjørnøya and in Svalbard. Because of the high density of seabirds and their species composition, these areas are vulnerable to oil contamination. Modelling indicates that oil spills at the discharge points used in the environmental risk assessments would mainly affect the large colonies on Røst, Værøy, Fuglenykene and Bleik and adjacent feeding areas. A major spill (scenario 7) would also affect Sør-Fugløy and Nord-Fugløy in Troms, and Lille Karmøy in western Finnmark. This area has large numbers of seabirds during the breeding season, when they are tied to their breeding habitats and therefore stationary. Simulation of the mortality caused by spills shows without exception that the consequences would be far more serious in the breeding season than at other times of year. In autumn and winter the birds are more evenly distributed along the coast, and the probability of high percentage population losses is lower. For all the analysed discharge points, the species that will be most severely affected is the puffin. The largest Norwegian colony is on Røst and could be directly affected by spills in Nordland V and VI. The size and duration of the oil spill and the exposure time for the birds influence the modelling results. In the event of a minor surface spill in Nordland V or VI, there is a probability of a population loss of 1–5 % for puffin. The blowout scenario with the lowest probability, a surface spill of 4 500 tonnes per day for 50 days from discharge point 2 in Nordland VI, would in the breeding season result in a 38 % probability of a population loss of more than 30 % and a 44 % probability of a loss of 20–30 %. The environmental consequences of this scenario have not been analysed for discharge points 1, 3 and 6 in Nordland V, VI and VII. Oil drift modelling shows that spills from these discharge points would affect the shoreline to a greater degree than a spill from discharge point 2, and the environmental consequences would be expected to reflect this. Discharge points 1 and 3 are upstream of the large seabird colonies on Røst, and the probability that these colonies and colonies further north will be affected is expected to be higher. The scenarios that have been analysed show that the shag would be the most severely affected coastal species, especially the colonies on Røst and Lille Karmøy.
The black-legged kittiwake and common guillemot are categorised as critically endangered (CR) and endangered (EN) respectively on the 2010 Norwegian Red List. Simulation of the different scenarios gives varying results for both species. A spill in Nordland V has a relatively serious damage potential. For the kittiwake, the consequences of a spill in Nordland V vary from a 60 % probability of a population loss of 1–5 % (minimum estimate for a spill of 35 tonnes/day for 14 days) to a 20 % probability of a loss of 10–20 % and a 5–10 % probability of a loss of 50 % (a spill of 4 500 tonnes/day for 14 days). Spills of longer duration and corresponding or higher rates would result in a higher probability of greater percentage losses. Since kittiwakes and common guillemots are found at the highest densities in Finnmark, the consequences for these species occupy a less dominant place in the simulation of the consequences for the Lofoten and Vesterålen Islands. However, both species have suffered a serious population decline, which makes them more vulnerable to any increase in mortality. Thus at the local level, oil contamination may have greater negative impacts than immediately indicated by the simulations. Mortality on the scale indicated for the largest scenarios analysed would increase the probability that the populations of kittiwake and common guillemot on Røst will die out. The birds are more evenly distributed along the coast in autumn and winter.
Consequences for the shoreline
The analysis showed that the duration of the spill was of considerable importance for the consequences for shore zone habitats. In general, the most representative spill and blowout scenarios have a probability of minor to moderate environmental damage combined with recovery periods of less than one year and 1–3 years respectively for shore zone habitats. A larger-scale incident of 4 500 tonnes per day for 14 days would have more serious consequences and involve a probability of substantial damage, with a recovery period of 3–10 years for shore zone habitats.
Consequences for fish
To harm aquatic organisms, the oil must be mixed into the water column, which means that a spill on the seabed could have more serious consequences than a surface spill. For these organisms, the length of time between the discharge of fresh oil and the point when the oil no longer releases water-soluble components is of crucial importance for assessing the potential damage. Eggs and larvae, which are the critical stages in fish life cycles, drift passively northwards with the current, and damage at these stages could reduce the year class involved.
Generally speaking, simulation of the various scenarios shows an 85–95 % probability that less than 1 % of a particular year class will be lost. The worst-case scenario shows a loss of 50 % of a year class from a spill in Nordland V. The probability of a loss of this magnitude is calculated to be around 5 % if the spill occurs at the time when fish are most vulnerable. There are other examples, involving smaller spills and larger spills at other times of year, where the consequences are marginal or zero.
The probability of harm to adult fish is mainly related to the uptake of oil components that reduce fish quality. However, adult fish are able to smell oil in the water column and will swim away. There have been cases where fish in fish farms, which cannot escape, have died as a result of the stress caused by their attempts to avoid the polluted water.
In order to assess spatial variation or patchiness in the survival of fish eggs and larvae there is a need for accurate observations of the temporal and spatial distribution of these stages. These data should be used for modelling when and where water masses containing damaging concentrations of oil components coincide with the presence of fish eggs and larvae.
Environmental risk
To assess environmental risk, the varying severity of the environmental consequences modelled must be combined with the probability of incidents that could cause these consequences. The probability of spills from oil and gas activities is discussed in section 5.1.2. In the analyses discussed here, the environmental risk has been assessed for three of the species for which the most serious consequences were found. The three species analysed were puffin (at the time of year when it is tied to the coast), shag and grey seal. The environmental risk was assessed for the most widely representative incident (scenario 4), for one of the large-scale incidents (scenario 7) and for the largest-scale incident (scenario 8). The analysis of scenario 8 is limited to discharge point 2. The results showed that in general the large-scale incidents (scenarios 7 and 8) would have the most serious consequences and have the highest probability of damage in the most serious categories for seabirds, marine mammals and the shoreline. However, the probability of such incidents is low. The results showed that scenario 4 would also have serious consequences and that the probability of such consequences was higher than for scenarios 7 and 8. Thus scenario 4 has the most representative risk level.
According to the analyses, the low probability of an incident plays a larger part in maintaining a low level of environmental risk than the level of environmental consequences.
Apart from the discharge point in Troms II, the analyses focused on the areas off the Lofoten and Vesterålen Islands, where the modelled spills would mainly affect the large seabird colonies on Røst, Værøy, Fuglenykene and Bleik. The results for environmental consequences and environmental risk for the Lofoten and Vesterålen Islands cannot necessarily be extrapolated to other parts of the management plan area.
The analyses of environmental consequences and environmental risks were mainly conducted for scenarios 2 and 7 and certain of the discharge points. In its report on the oil spill in the Gulf of Mexico, the Forum on Environmental Risk Management recommended that environmental risk analyses should also be carried out for the coastal zone and shoreline in the Vestfjorden and the Lofoten and Vesterålen Islands, Troms and Finnmark, and that they should include the larger modelled spill scenarios as well.
Shipwreck off Røst
The results show that a shipwreck off Røst with a total spill of 60 000 tonnes oil over 4 days would result in a high risk of environmental damage. It could lead to major damage to a number of seabird populations, the grey seal population and the shoreline. The largest Norwegian puffin colony is on Røst and would therefore be affected by such a spill. The consequences were estimated at a 30 % probability of a population loss of 30 % for puffin. If a shipwreck were to occur during the spawning-season cod fishery off the Lofoten Islands, it would have immediate and very serious consequences for the fisheries. If it were to occur in a period with high concentrations of cod eggs and larvae, it could also lead to a marked reduction in the year class in question. However, the traffic separation schemes, the emergency tugboat services and other maritime safety measures have helped to reduce the probability of this type of incident.
No analyses have been made for the other parts of the management plan area. The potential consequences of oil spills are generally considered to be the same as before. In 2010–11 the Norwegian Coastal Administration conducted comprehensive environmental risk analyses for maritime traffic along the coast of mainland Norway.
5.3 Preparedness and response to acute pollution: reducing the consequences of spills
The most serious scenario in the scientific basis for the management plan update and the additional modelling described above is a spill with a discharge rate of 4 500 tonnes oil per day lasting for 50 days. However, the environmental risk analyses for the Barents Sea–Lofoten area have not taken into account the effect of preparedness and response measures. The objective is for the preparedness and response to acute pollution to be designed and dimensioned to effectively keep the risk of damage to the environment at a low level.
A natural topic of discussion is how the Norwegian preparedness and response system could be used to reduce the environmental consequences of a spill on this scale and how to incorporate the lessons learned after the accident in the Gulf of Mexico. However, there are many dissimilarities between the Gulf of Mexico and the management plan area, such as climate, ocean currents, water depth, marine life and geology. The high spill rate in the Gulf of Mexico was related to the geological conditions in the reservoir. There is no evidence to suggest that the same geological combination of good reservoir properties, very high reservoir pressure, volatile oil and deep water is to be found in the management plan areas as in the Macondo prospect, and this should be borne in mind when the lessons learned from the accident are being evaluated.
The Gulf of Mexico spill caused the authorities concerned to re-evaluate the assessments of oil spills, including potential causal mechanisms, spill volume, duration, consequences and preparedness and response. The total spill volume in the Gulf of Mexico accident was estimated at almost 800 000 Sm3 oil and lasted for 87 days. Norway has no experience of dealing with oil pollution on this scale or at these depths.
A large-scale response operation was mounted in the aftermath of the Gulf of Mexico spill. Figure 5.8 shows estimated figures for the fate of the oil. The areas severely affected were small in relation to the size of the spill, and the visible acute environmental impacts were less serious than had been feared. This was because most of the oil either evaporated or was dispersed in the water column. However, a great deal more work is needed to determine the scale of the damage, and we do not know the effects of the large quantities of oil dispersed in the water column or on the seabed. Studies are being carried out on the long-term effects of the uptake of oil and dispersants by organisms.
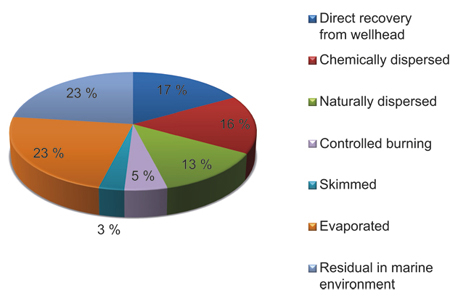
Figure 5.8 Oil budget for the Mexico Gulf accident
Source Report to the President. National Commission on the BP Deepwater Horizon Oil Spill and Offshore Drilling, January 2011.
Recovery of oil from the sea surface
The Norwegian preparedness and response system is mainly based on mechanical recovery of oil from the sea surface by means of booms and skimmers.
A major acute pollution incident in the management plan area that threatens the coastal zone would pose considerable operational challenges related to distance, infrastructure, darkness, weather and availability of equipment and personnel.
In the Gulf of Mexico extensive resources were deployed to contain, disperse and remove the oil and limit the damage, see Box 5.2. In spite of the scale of the response operation, only a small proportion of the total spill (3 %) was recovered from the surface by mechanical means. Since the spill occurred in deep water, much of the oil was dispersed in the water column and not all of it reached the surface. In addition large quantities evaporated and large quantities were chemically dispersed, see Figure 5.8. In Norway the figure for recovery of oil drifting on the sea during governmental clean-up operations has in most cases been 12–15 %, calculated as pure oil recovered in relation to total spill volume. This corresponds in general to international figures for mechanical oil recovery.
Oil dispersion
Chemical dispersion was one of the main measures used to limit the amount of surface oil in the Gulf of Mexico. Around 7 000 m3 dispersant was used. Norwegian operators do not have the logistical or operational capacity to use dispersants on this scale. Norway has total stocks of around 650 m3 dispersants, mainly held by the oil and gas operators themselves. It is too soon to conclude that the dispersants used in the Gulf of Mexico did not damage the marine environment or that dispersant use gave less overall damage than for example mechanical recovery or in situ burning.
Under the Pollution Regulations, dispersant use should be chosen when it will give less overall damage to the environment than any other method. The Norwegian Coastal Administration is reviewing the possibility of including dispersant use as a response technique in the governmental system. The Gulf of Mexico spill showed that preparedness and response to acute pollution should take into account that it may be necessary to use dispersants and shoreline-cleaning agents in addition to mechanical recovery. Thus it might be advisable to review the framework conditions for the use of different techniques and to seek to improve their effectiveness through R&D.
Natural dispersion and evaporation of oil
The potential damage from a spill is usually reduced by natural dispersion by waves, wind, sunshine and bacteria, and by evaporation of crude oil. A high proportion (23 %) of oil from the Gulf of Mexico spill was estimated to have evaporated. The surface temperature of the sea in the Gulf is around 32 °C, which means that weathering will proceed differently from weathering of a corresponding crude oil in Norwegian waters. The rougher wind and weather conditions in the management plan area would increase the dispersion of the oil through the water column, thereby reducing the risk of acute damage to the shoreline, but the potential for long-term effects of the dispersed oil would be higher.
In situ burning of oil
Controlled burning of crude oil on the sea surface was also used in the Gulf of Mexico. Norwegian operators have very little experience of this method, although it has been tested for oil spills in icy waters.
Shoreline cleaning
The type of accident largely determines how much of the oil is beached. Near-shore spills of heavy fuel oil from ships often make large-scale shoreline-cleaning operations necessary. So far, there have been no incidents where oil spills from oil and gas activities have reached land, but oil drift forecasts based on scenarios and discharge points in areas from Nordland to Troms show that the probability of landfall is high (see section 5.2.2).
Landfall of oil from ships has led to prolonged clean-up operations in Norway, for example after the spill of heavy bunker oil from the Full City off Langesund in summer 2009. It is not unusual for shoreline-cleaning operations to take up to six or seven months, even after the relatively small spills we have experienced.
In the event of a major spill in the management plan area, equipment from all governmental depots along the coast can be deployed, but normally the equipment in local depots in the area will be used. However, the availability of personnel is less reliable in this part of the country than in other, more densely populated, parts of the coast. The infrastructure also poses more problems than in other parts of the country. Thus if extensive shoreline-cleaning operations are needed, the capacity of the municipal emergency response system is likely to be limited.
There are many areas of the coast in the management plan area where it is difficult to deploy personnel and that are not accessible from the seaward side.
Textbox 5.5 Status and development of oil spill preparedness and response in the management plan area
Governmental oil spill response (responsible agency: Norwegian Coastal Administration)
The main depots of the Norwegian Coastal Administration in the management plan area are located in Bodø, Lødingen, Tromsø, Hammerfest, Vadsø and Longyearbyen, and there are supplementary depots at Sortland, Skjervøy, Honningsvåg and Båtsfjord. Two of the Administration’s oil recovery vessels and six Coast Guard vessels with oil pollution response equipment on board normally operate in the management plan area. The service vessels under the Governor of Svalbard can also be deployed in governmental emergency response. The Norwegian Coastal Administration has a surveillance aircraft for monitoring the spread of oil on the sea surface.
Municipal response
There are seven intermunicipal acute pollution control committees, in which all municipalities from Røst to Sør-Varanger participate. The municipal emergency response equipment consists primarily of light-weight booms and skimmers suitable for use along the shoreline and in coastal waters.
Private-sector response
The petroleum industry is required to maintain a level of preparedness and response that is dimensioned to deal with spills from oil and gas activities. This means that operators must identify their needs and performance requirements with regard to ocean-going response and emergency response in coastal waters and the shore zone as a function of estimated quantities of oil in specified sample areas along the coast. The Norwegian Clean Seas Association for Operating Companies (NOFO) is responsible for planning and implementation of emergency response measures on behalf of the operators. The governmental emergency response system is therefore designed mainly to deal with spills from shipping accidents rather than those from oil and gas activities.
Textbox 5.6 Preparedness and response measures implemented since 2006
Since 2006, both the authorities and the petroleum industry have implemented a number of measures to strengthen the preparedness and response to acute pollution:
Governmental and municipal measures
Emergency response equipment at all depots has been renewed, replaced and reallocated.
New Coast Guard vessels carrying oil spill recovery equipment have been phased in, which has increased capacity and mobility for ocean-going response, including equipment carried by the Coast Guard vessel KV Sortland.
The emergency cargo transfer capacity for bunker and cargo oil has been strengthened by the deployment of new equipment.
The competence of personnel in the governmental system has been strengthened by increasing the frequency of exercises.
The Climate and Pollution Agency and the Norwegian Coastal Administration have further developed decision-making tools for the use of dispersants as an emergency response measure.
The knowledge base for environmental risk and preparedness analyses has been strengthened, for example by testing and further developing three-dimensional modelling of oil drift.
The preparedness and response requirements for the petroleum industry have been tightened, and the licences awarded by the Climate and Pollution Agency contain more specific requirements for dealing with oil spills close to the source and in the drift trajectory towards the coast.
New regulations concerning the use of vessels in oil spill response have been issued. The aim is to enable vessels that are built, equipped and certified for other uses to be safely deployed in oil spill response operations.
Guidelines have been developed through a project headed by the Norwegian Coastal Administration for general competence-building for preparedness in coastal waters and shoreline clean-up, with contributions from NOFO, Statoil, the Directorate for Civil Protection and Emergency Planning, the Norwegian Fire Protection Training Institute and the Climate and Pollution Agency.
The Royal Decree of 17 February 2006 relating to nuclear accident preparedness was made applicable to Svalbard and Jan Mayen from 1 April 2006.
Private sector
NOFO has increased the number of high seas oil recovery systems, and improved and replaced equipment. It has also identified new technology needs and to this end is implementing a technology programme in cooperation with the Norwegian Coastal Administration.
In order to comply with the requirements for preparedness and response to acute pollution during planned operations over a limited period (exploration drilling), the operators have strengthened preparedness for coastal waters and the shoreline for certain segments of coast in the management plan area.
A research programme on beached oil has provided new knowledge about conditions for the use of different beach clean-up techniques, test methods for dispersants and shoreline-cleaning agents, and the weathering and spread of certain types of crude oil on different beach types.
The preparedness and response system established for the fields on the Halten bank, with a five-hour response time to the Norne field, can be used as the first response for operations in the southern parts of the management plan area. The emergency response system being established for the Goliat field will improve the preparedness level in the northern part of the area.
A multiannual research programme on oil spills in ice has raised the level of knowledge and improved the basis for decision-making as regards the establishment of preparedness and response for icy waters.
Overall effect of oil spill preparedness and response
It is clear from the scientific basis of April 2010 for the management plan update and the report by the Forum on Environmental Risk Management on the Gulf of Mexico accident that it is not possible to give a single straightforward description of what the overall effect of preparedness and response would be in the event of an oil spill in the management plan area. Dealing with a major oil spill in the area would involve considerable operational challenges, especially as regards coordination and monitoring of the response operation, access to personnel and equipment, and the effectiveness of booms, equipment and methods for recovering oil from the sea surface and shoreline in difficult weather conditions, when ice is present and in darkness. These factors will make oil spill response particularly difficult in the whole management plan area.
As in other sectors, governmental preparedness and response to acute pollution in the management plan area is dimensioned on the basis of risk analyses. A preparedness and response system cannot be designed on the basis of a worst-case scenario.
5.4 Important gaps in our knowledge
The work on the management plan is based on the assumption that all the relevant authorities contribute expertise in their own sphere of responsibility and compile a scientific basis for the plan. It is important to arrive at a common understanding of risk that is shared by all the authorities and experts, and to this end to further develop the criteria for selecting information relevant to an environmental risk assessment.
The methods for assessing the economic effects of accidents involving acute pollution should be further developed. This will improve the basis for making decisions on investment in prevention, preparedness and response.
There is still a need to improve the methodology for assessing the environmental consequences of acute pollution for fish, seabirds, marine mammals and the shoreline. There are still uncertainties as regards assessments of the consequences for fish, including how to deal with spatial variation or patchiness in survival of fish eggs and larvae. We also need to know more about survival from larvae to adult fish.
The petroleum industry should give priority in R&D to prevention of accidents that may result in acute pollution in general and in Arctic areas in particular. One priority area that has been identified is the development of technical and operational solutions for the management plan area that are adapted to conditions when icing is likely.