2.2 The Norwegian economic situation
Growth in the Norwegian economy has picked up this year, and registered unemployment has remained low. After declining considerably since the peak in 2022, consumer price inflation has been more stable over the past year. Norges Bank reduced the key policy rate in both June and September, and the September policy rate forecast indicates a gradual further decline in interest rates. In the period ahead, further employment growth and solid real wage growth are expected to contribute to appreciably higher growth in the Norwegian economy than it has been in the last two years. Unemployment is projected to remain close to the current level, while inflation is expected to move gradually towards the inflation target of 2 per cent.
Higher private demand boosts growth in the Norwegian economy
Prospects for higher income growth are expected to result in strong growth in household consumption and contribute to an increase in housing investment from very low levels. Furthermore, higher investment in power supply is expected to boost business investment, after falling last year. On the other hand, petroleum investment, which in recent years has contributed to sustaining growth in the Norwegian economy, is projected to fall from high levels. The contribution to growth from public demand is also expected to be slightly smaller in the years ahead than in recent years, see chart 2.8.

Chart 2.8 Development in mainland GDP by demand component. 1 Growth in per cent and contribution to growth in percentage points. 2024–2027. Projections for 2025–2027
1 Petroleum activities and ocean transport describe the demand from these industries towards the mainland.
2 Inventory changes and other statistical discrepancies.
Sources: Statistics Norway and Ministry of Finance.
So far, the major upheavals in international trade policy appear to have had little impact on the willingness to invest in Norwegian business and industry and household behaviour. Through summer, the conditions for international trade have also become somewhat more clarified. Until further notice, Norwegian exports to the US are subject to additional tariffs of 15 percent. Since goods exports to the US are relatively small (see further discussion in box 2.4), the effects of higher trade barriers to the US are expected to occur primarily through weaker growth abroad. So far this year, exports from the mainland have been markedly higher than in the same period last year.
Capacity utilisation is close to normal
Weak growth over the past two years has caused capacity utilisation in the Norwegian economy to decline after the cyclical peak in 2022. Capacity utilisation refers to how much of the total resources in the economy are utilised. Capacity utilisation is assessed on the basis of, among other things, developments in the labour market, output and prices. These are summarised in chart 2.9. Here, low growth and declining capacity utilisation in recent years are reflected in cooler colours in the chart. Several of the indicators are close to their historical average values, while both wage and price inflation are still higher. An overall assessment of the indicators indicates that the cyclical situation over the past year has been close to normal. Growth in the Norwegian economy is expected to pick up ahead, primarily as a result of a stronger rise in household demand. The projections in this report imply that growth in mainland GDP Norway will increase from 0.6 per cent last year to 2.0 per cent this year and 2.1 per cent next year, see chart 2.8. This is slightly stronger than projected trend growth in the economy and implies a mild cyclical upturn.
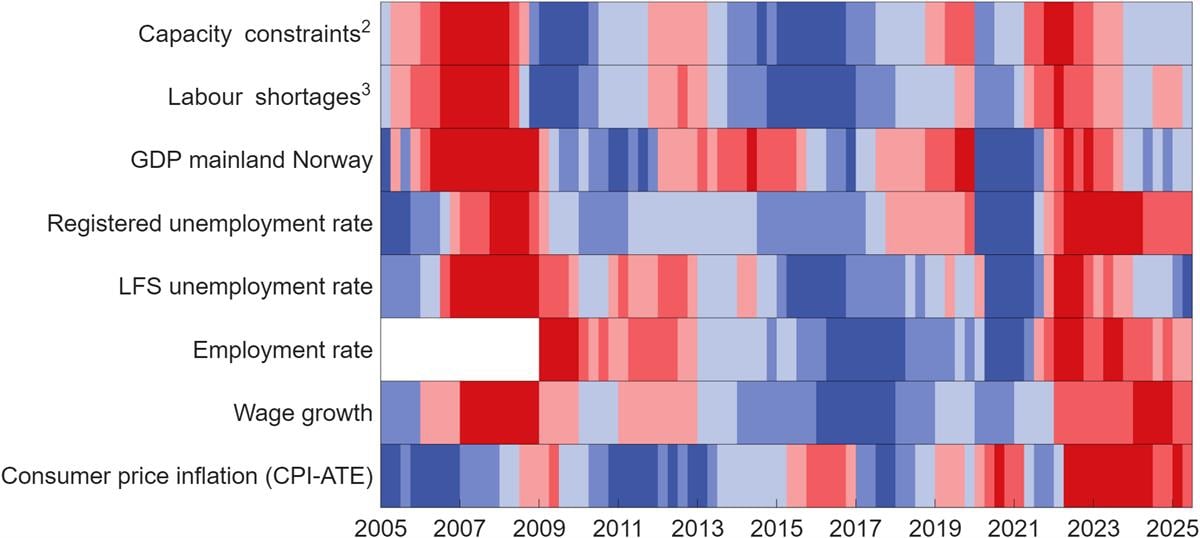
Chart 2.9 Selected indicators of capacity utilisation in the Norwegian economy 1 . First quarter 2005– second quarter 2025
1 Red colours are a sign of a boom with pressures in the economy, while blue colours are a sign of recession and spare capacity. The colour scale reflects how large the gap, or deviation from the average, is. The darkest colours represent the third of the observations with the largest positive and negative deviation. The indicators are measured as the deviation from the average in the period shown in the figure, with observations from the pandemic years 2020 and 2021 removed from the projection. The exceptions are inflation, which is measured as a deviation from the inflation target, and GDP, which is measured as a deviation from a simple trend. The trend is estimated using the Hodrick-Prescott filter, where the smoothing parameter is set at 40,000, but has not been adjusted for the abnormally low activity development through the pandemic.
2 Capacity constraints refer to the share of the contacts in Norges Bank's regional network that will have either some or considerable problems in increasing production/sales without investing additional resources.
3 Labour shortages refer to the share of the contacts in Norges Bank's regional network reporting that labour shortages are curtailing production/sales.
Sources: Norges Bank, Statistics Norway, Norwegian Labour and Welfare Administration and the Ministry of Finance.
High demand for labour
Demand for labour is high. Employment growth picked up somewhat in the first half of 2024, see chart 2.10. There are still many vacancies, although stocks have come down from the historically high levels after the pandemic. In recent quarters, the share of companies reporting capacity constraints or labour shortages has been close to its historical average. Registered unemployment has edged up but is still low. Unemployment measured by the Labour Force Survey (LFS) has risen since the beginning of the year, and corresponded to 4.4 per cent of the labour force in the first half of the year. This is somewhat higher than last year. Continued relatively high employment growth is expected ahead. Registered unemployment is expected to remain stable, see chart 2.11. See Section 2.4 for further discussion of the labour market.
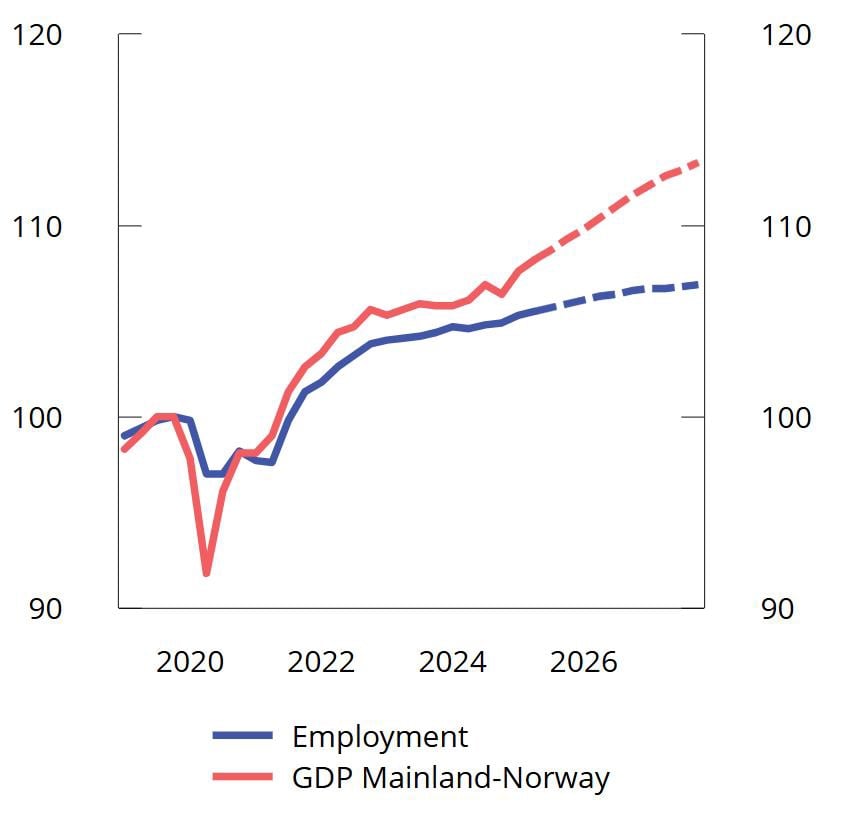
Chart 2.10 Development in mainland GDP and employment. Index. Fourth quarter 2019 = 100. Seasonally adjusted. Estimates for third quarter 2025–fourth quarter 2027
Sources: Statistics Norway and Ministry of Finance.

Chart 2.11 Unemployment as a percentage of the labour force. 1 Seasonally and trend-adjusted. Jan. 2006-Sep. 2025. Annual projections for 2025–2027
1 Unemployment figures for 2020 and 2021 have been excluded from the average because the labour market was heavily affected by lockdowns due to infection control measures in these years.
Sources: Macrobond, Statistics Norway, Norwegian Labour and Welfare Administration and the Ministry of Finance.
Inflation is gradually slowing
After a marked decline through 2024, consumer price inflation has varied around 3 per cent over the past year, see chart 2.12. The decline we saw last year has come to a halt. Adjusted for tax changes and excluding energy products (CPI-ATE), inflation was 3.1 per cent in August this year, about the same as August last year. Developments in prices for domestically produced goods and services are still pushing up inflation, while it is dampened by developments in prices for imported goods. These trends are expected to persist until the end of the projection period, see chart 2.13, while energy prices will again push inflation down next year. There are assumed no particular effects of trade conflicts on domestic inflation.
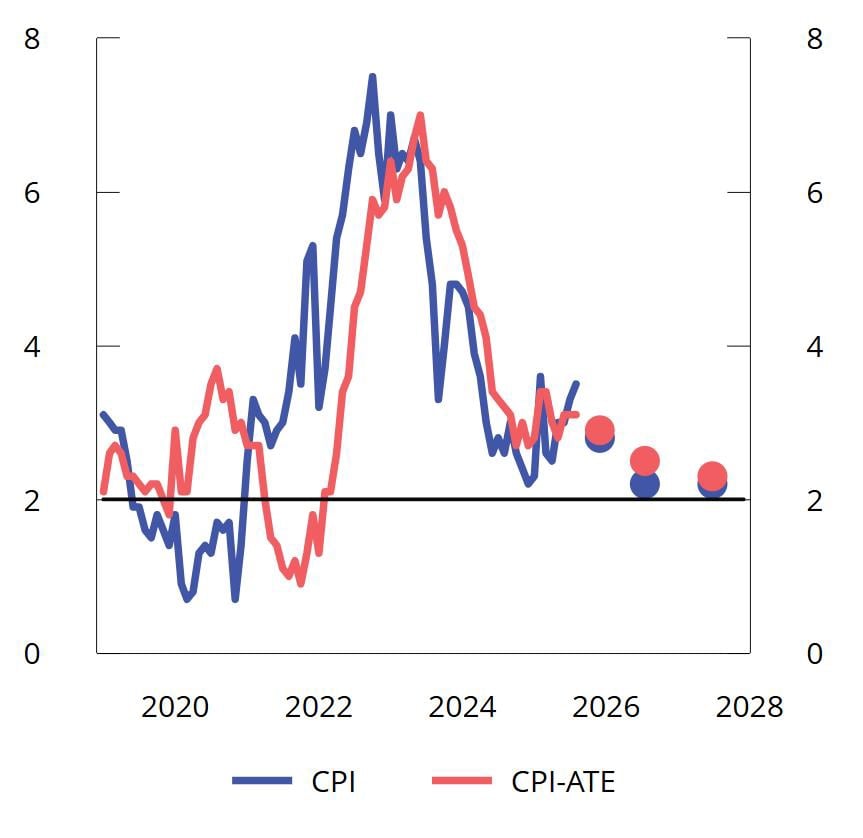
Chart 2.12 Twelve-month growth in CPI and CPI-ATE in per cent Jan. 2019-Aug. 2025. Annual projections for 2025–2027
Sources: Statistics Norway and Ministry of Finance.

Chart 2.13 CPI growth in per cent and contribution to growth in percentage points. 2024–2027. Projections for 2025–2027
Sources: Statistics Norway and Ministry of Finance.
Higher food prices are pushing up the rise in prices for Norwegian goods. In July, food price inflation was at its highest since the peaks of inflation in 2022 and 1981. Prices for services excluding rent have also risen more than normal. This reflects high wage growth over the past two years.
Prospects for continued high wage growth mean that consumer price inflation is expected to remain above the inflation target during the projection period, although it will likely decline. With the exception of services excluding rents, the monthly rise in goods and services groups in the CPI is approaching the levels observed prior to the high-inflation period. This suggests that the year-on-year rise in the consumer price index as a whole will gradually decline.
A number of politically decided measures influence the path of inflation. The maximum price of kindergarten has been reduced two years in a row, and has pulled down the twelve-month growth rate by 0.3 percentage point since last autumn, and will continue to have an effect until autumn 2026. Reduced electricity taxes and the introduction of the Norwegian price will also pull down the growth in energy prices.
Prospects for real wage growth in the coming years
High profitability in manufacturing and low unemployment have provided the basis for high wage growth in recent years, and it will likely remain relatively high in the period ahead. In 2024, annual wages rose by 5.6 per cent, after an increase of 5.2 per cent the year before.
Wage growth has remained high so far in 2025. Figures from the a-ordningen show that from the first half of 2024 to the first half of 2025, contractual monthly wages increased by 5.3 per cent, and in almost all industries wages increased by 5 per cent or more. There may be variation between industries in the extent to which this year's wage settlement has affected observed wage growth in the first half of this year.
This report assumes annual wage growth of 4.4 per cent in 2025, in line with the framework for the frontline wage settlement. A continued low share of labour costs may suggest that wage growth will remain elevated ahead, see chart 4.3. Somewhat lower annual wage growth is expected for the coming years, although still considerable real wage growth as a result of lower inflation, see chart 2.14.
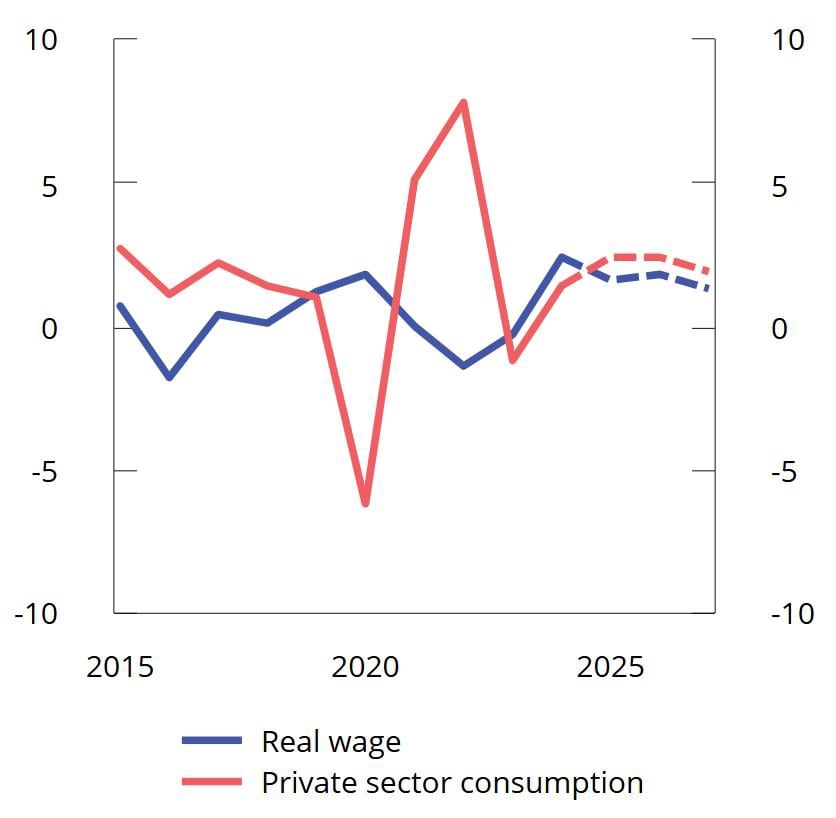
Chart 2.14 Private consumption and real wages. Percentage change from previous year. 2015–2027. Projections for 2025–2027
Sources: Statistics Norway and Ministry of Finance.
Higher growth in consumption ahead
Growth in household consumption has picked up markedly this year, following a slight rise through last year. This reflects strong growth in household real disposable income, which rose by 4.2 per cent last year. Prospects for continued high real wage growth, further employment growth and gradually lower interest rates mean that income growth is expected to remain high in the period ahead, boosting consumption. Higher housing prices is also expected to push up consumption growth. At the same time, it is assumed that households will save a slightly larger share of their income in the years ahead, following the low saving ratio in the post-pandemic period.
Housing investment is expected to pick up next year
Following a sharp decline in housing investment in 2023 and 2024, the outlook for the new housing market is now brighter. New home sales have picked up from low levels over the past year and a half, and the number of new housing starts has increased so far this year. Construction companies in Norges Bank's regional network expect further activity growth in the fourth quarter.
Housing construction has been very low in recent years, at the same time as demographic changes and migration patterns indicate a substantial underlying need for more housing to be built, particularly in and around the large cities. Together with the prospect of continued increased purchasing power and some further decline in interest rates, housing investment suggests that housing investment will pick up ahead. There is uncertainty as to how quickly housing investment will increase. This report assumes a marked increase, in line with previous experience following a sharp decline in housing investment.
The existing dwellings market has been characterised by high activity and higher prices, even though prices are still below previous peak levels in real terms, see chart 2.15. Housing price growth was abnormally high around the turn of the year. It then declined somewhat in the following months before picking up again in August. The upturn this winter reflects improved purchasing power, expectations of lower interest rates and probably also the reduction in the lending regulation's equity capital requirement for residential mortgages. Housing prices is expected to growth more than normal this year and next. This can reduce the price differences between existing dwellings and new homes and contribute to a pick-up in residential construction.
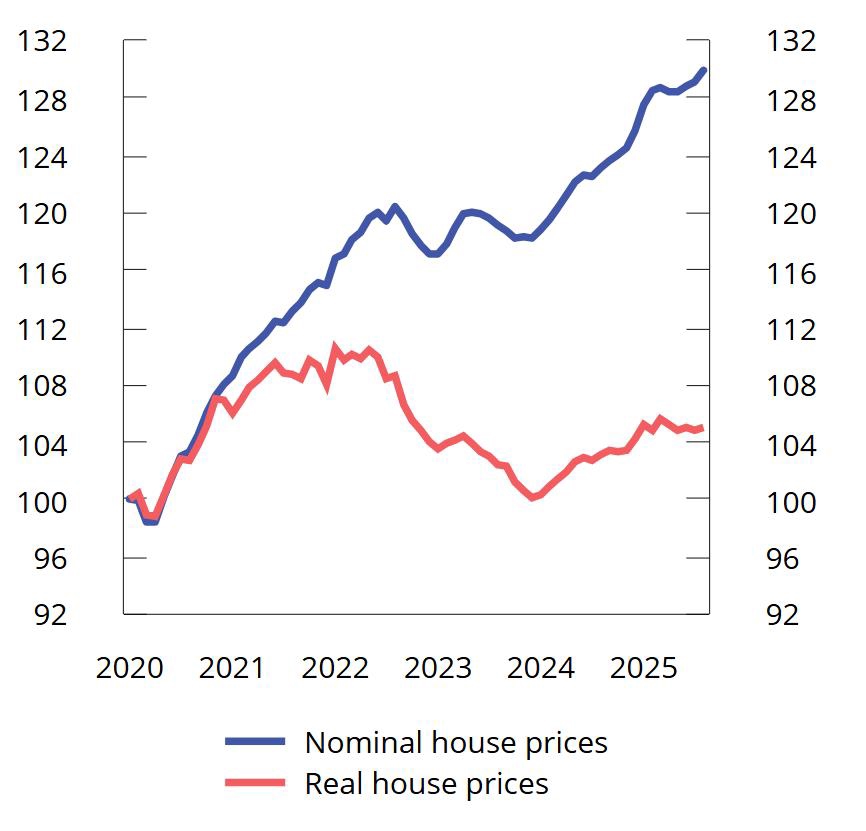
Chart 2.15 Prices of existing dwellings. January 2020 = 100. Seasonally adjusted. Jan. 2020-Aug. 2025
Note: Real house prices are calculated by deflating Real Estate Norway's seasonally adjusted second-hand housing price series by the seasonally adjusted consumer price index.
Sources: Property Norway, Eiendomsverdi, Finn.no, Statistics Norway and Ministry of Finance.
Power supply investment is underpinning business investment
After a gradual decline from 2019, mainland business investment has stabilised close to its historical average, measured as a share of GDP. After falling slightly last year, moderate growth is expected ahead, see chart 2.16.

Chart 2.16 Gross fixed capital formation. Mainland industries, petroleum and housing. NOK billion at 2022 prices. 2000–2027. Projections 2025-2027
Sources: Statistics Norway, the Ministry of Energy, the Norwegian Offshore Directorate and the Ministry of Finance.
Investments in the power supply are making a significant contribution to overall investment growth this year, and estimates from Statistics Norway's investment intentions survey indicate a further increase in power investment next year. In other industries, growth is more subdued. According to Norges Bank's regional network, the service industries, which account for about two-thirds of investment in mainland industries, expect no change this year and some growth next year.
Increased defence expenditure in Europe may boost activity in domestic manufacturing industry, but the investment intentions survey points to higher investment only from next year. The contacts in Norges Bank's regional network report that international trade conflicts have little effect on the willingness to invest, and that exports to the US can largely be diverted to other markets.
Lower growth impulses from petroleum investment
Petroleum investment has increased sharply over the past two years, particularly as a result of the tax rule changes adopted by the Storting in spring 2020. Reports from the oil companies to the Norwegian Offshore Directorate and Statistics Norway's investment intentions survey for the third quarter may indicate that petroleum investment will increase further in 2025, particularly for investments in producing fields.
Petroleum investment has long been expected to decline further out. So far this year, only one plan for development and operation (PDO) has been submitted and approved, which is in stark contrast to the high number of plans submitted before the end of 2022 to take advantage of the temporary tax rules. Petroleum investment is projected to decline in the coming years, particularly as a result of a decline in field development, see chart 2.16.
The krone has appreciated slightly this year
After depreciating markedly through 2022 and the first half of 2023, the krone exchange rate has been more stable over the past two years, see chart 2.17. In connection with the announcement of higher tariffs on US imports this spring, the krone depreciated considerably, but has since appreciated and is now slightly stronger than at the beginning of the year, as measured by the import-weighted krone exchange rate I-44. Even though global uncertainty has diminished somewhat through summer, there is still a risk of financial market turbulence and there is considerable uncertainty about future movements in the krone exchange rate. This report makes the technical assumption that the exchange rate will remain unchanged going forward. Technically, this means that the krone as an annual average will appreciate by about 1/2 per cent this year and by a further 1/2 per cent next year. The level of the krone exchange rate nevertheless indicates that it continues to contribute to solid earning capacity in the frontline sector.

Chart 2.17 Import-weighted exchange rate index (I-44) 1 . Jan. 1st 2019–Sept. 30th 2025
1 I-44 is a calculated exchange rate index based on exchange rates between NOK and the currencies of Norway's 44 most important trading partners measured by import value. A higher index value means a weaker krone, and the axes have therefore been inverted.
Source: Norges Bank.
Somewhat lower growth in mainland exports ahead
Mainland exports have increased markedly over the past four years. There has been particularly strong growth in service exports, partly as a result of strong growth in the tourism industry. In 2024, tourism accounted for almost 8 per cent of mainland exports, which is slightly higher than in the pre-pandemic years. High growth in exports of engineering products has also pushed up mainland exports. In recent years, a weak krone has contributed to export growth by improving the competitiveness of Norwegian manufacturing companies and by boosting tourism activity in Norway. Somewhat lower growth in exports is expected ahead, partly as a result of the post-pandemic recovery effect on tourism and the favourable growth stimulus of a weaker krone on exports has been exhausted.
Table 2.3 Key figures for the Norwegian economy. Percentage change from previous year, unless otherwise stated.
|
NOK billion1 |
||||||
|
2024 |
2024 |
2025 |
2026 |
2027 |
||
|
Private consumption |
2 051 |
1,4 |
2,4 |
2,4 |
1,9 |
|
|
Public sector consumption |
1 184 |
2,4 |
2,2 |
2,8 |
1,2 |
|
|
Gross fixed capital formation |
1 143 |
-1,4 |
1,4 |
0,6 |
2,1 |
|
|
Of which: |
Oil extraction and pipeline transport |
253 |
9,8 |
4,0 |
-7,0 |
-6,5 |
|
Industries in mainland Norway |
424 |
-2,9 |
2,4 |
2,9 |
2,3 |
|
|
Dwellings |
170 |
-19,1 |
-5,2 |
11,7 |
11,9 |
|
|
General government |
286 |
3,9 |
1,7 |
-2,6 |
2,3 |
|
|
Demand from mainland Norway2 |
4 115 |
0,3 |
2,0 |
2,6 |
2,2 |
|
|
Of which: |
Public sector demand |
1 470 |
2,7 |
2,1 |
1,7 |
1,4 |
|
Export |
2 468 |
5,2 |
-1,2 |
0,6 |
0,2 |
|
|
Of which: |
Crude oil and natural gas |
1 169 |
6,7 |
-2,7 |
-0,5 |
-1,6 |
|
Goods and services from mainland Norway |
1 111 |
4,0 |
2,8 |
2,4 |
2,3 |
|
|
Import |
1 760 |
4,3 |
1,4 |
2,0 |
2,4 |
|
|
Gross domestic product |
5 197 |
2,1 |
0,4 |
1,2 |
0,7 |
|
|
Of which: |
Mainland Norway |
4 050 |
0,6 |
2,0 |
2,1 |
1,8 |
|
Other key figures : |
||||||
|
Employment |
0,5 |
0,8 |
0,7 |
0,4 |
||
|
Unemployment rate, registered (level) |
2,0 |
2,1 |
2,1 |
2,1 |
||
|
Unemployment rate, LFS (level) |
4,0 |
4,5 |
4,5 |
4,5 |
||
|
Wage growth |
5,6 |
4,4 |
4,0 |
3,5 |
||
|
CPI |
3,1 |
2,8 |
2,2 |
2,2 |
||
|
CPI-ATE |
3,7 |
2,9 |
2,5 |
2,3 |
||
|
Crude oil price, USD per barrel (current prices) |
80 |
70 |
67 |
67 |
||
|
Three-month money market rate (level)3 |
4,7 |
4,4 |
4,0 |
3,6 |
||
|
Import-weighted krone exchange rate4 |
0,8 |
-0,4 |
-0,4 |
0,0 |
||
1 Preliminary national accounts figures for 2024 in current prices. Growth rates from this level are stated in volumes.
2 Excluding inventory changes.
3 Corresponds to the money market rate forecast in Norges Bank's Monetary Policy Report 3/25.
4 A positive number indicates a weaker krone.
Sources: Statistics Norway, Norges Bank, Norwegian Labour and Welfare Administration, Reuters, ICE, Macrobond and the Ministry of Finance.
Public sector demand
In recent years, public demand for goods and services has grown faster than the mainland economy as a whole. Updated national accounts figures indicate that public sector demand in 2024 was somewhat higher than assumed in the Revised National Budget earlier this year. This is primarily due to somewhat higher investment in the municipal sector.
For this year, the projection for public demand has been revised down since spring. This reflects in particular a lower estimate of consumption in the municipal sector. New information indicates that activity growth in the municipalities will be weaker than the average for the past ten years, both this year and next. Public sector investment is expected to fall next year. This is primarily because investment in the health trusts is expected to decline. See Chapter 3 for a discussion of fiscal policy and Section 3.4 for a discussion of activity in the municipal sector. For 2027, the public sector consumption and investment projections are based on technical assumptions concerning demographic trends, as well as the estimated effects of the Long-term Plan for the defence sector.
Box 2.4 Norwegian goods exports to the US
In April this year, the United States announced increased tariffs against most countries. Norwegian exports to the US are subject to additional tariffs of 15 per cent and sectoral duties on a number of goods.
The value of Norwegian exports of goods to the US in 2024 was NOK 62 billion. Of this, NOK 60 billion was goods from the mainland. Last year, the US was the third largest destination for exports of mainland goods after the Netherlands and Sweden, which amounted to NOK 68 billion and NOK 67 billion respectively. Exports of mainland goods to the EU as a whole are about seven times larger than exports to the US.
As a share of Norway's total merchandise exports, the export value to the US over the past 5 years has amounted to about 3 per cent. This is a good deal lower than in the 20-year period 2000–2019, when the proportion was almost 6 percent. The lower share to the US in recent years must be seen in conjunction with high petroleum prices, which means that the export value of oil and gas has been historically high, and that a relatively small share of exports of crude oil and natural gas goes to the US. As a share of mainland exports, exports to the US last year were 8.4 per cent, which is slightly above the average for the past 20 years.
Of the exports of goods to the US last year, the largest groups were machinery and transport equipment (23 per cent), seafood (21 per cent), oil products, etc. (19 per cent) and chemical products (11 per cent), see chart 2.18
Exports of machinery and transport equipment to the US have increased sharply in recent years. This applies in particular to machinery used in the energy and industrial sectors, including offshore. Of the exports of seafood to the USA, salmon dominates. The production of salmon and other Norwegian seafood is largely determined by supply-side conditions. Should seafood demand from the US decline as a result of higher tariffs, exports will probably shift elsewhere without much appreciable impact on production. Exports of petroleum to the US last year were mainly oil products, including petrol and diesel, while exports of chemical products mainly consisted of medicines and pharmaceutical products.

Chart 2.18 Composition of goods exports to the US in 2024. Percentage share
Sources: Statistics Norway and Ministry of Finance.