3 Wellbeing as a goal
There is currently no comprehensive measure of wellbeing that encompasses both subjective and objective components of importance for wellbeing.
The limitations of using a country’s GDP as a measure of societal development is the main message of the report “Beyond GDP”, often referred to as the Stiglitz Report (14). In this report prepared for the OECD, Stiglitz and colleagues describe how excessive reliance on GDP as a measure of economic performance misled policymakers who did not recognise the approaching 2008 financial crisis. The report emphasises the following:
“…change the focus of our statistics from measuring the size of economic production, which is what GDP is about, to measuring what shapes the wellbeing of people today and that of future generations… What you measure affects what you do” (p. 7).
In accordance with the recommendations of the Stiglitz Report, the Ministry of Health and Care Services commissioned Statistics Norway in March 2023 to develop an indicator framework for wellbeing that could form the basis for policymaking. The indicator framework is intended to provide an overview of the status and development of key factors that affect wellbeing. It will also play a key role in planning efforts, assessing measures and being able to make projections and modelling of the consequences of various measures. The framework will be used to assess the achievement of policy goals, and by monitoring the indicators over time, they can show whether policy goals are being achieved, such as economic security or a reduction in the number of people outside the labour market. The set of indicators should be able to help answer the question of whether the population is doing better or worse, in which areas and for which groups. The set of indicators could also form part of the knowledge base for developing political strategies and action plans, and it can be used in budget processes at various levels.
The current system for assessing government measures is based on the instructions for official studies and reports. This means, among other things, that socioeconomic analyses of measures that have significant benefit or cost effects must be carried out. This system will continue to underlie studies as a basis for decision-making. And better wellbeing for different groups could also be a goal for policy development within the current framework. However, the indicator framework could eventually contribute by supplementing the current basis for decision making.
There are a number of challenges associated with measuring wellbeing. Wellbeing consists of both objective and subjective components, and it is particularly the subjective components that are fundamentally difficult to measure adequately. These will, among other things, often depend on the expectations, conditions and genetics of individuals and groups. Caution must be exercised to avoid unintended distortions in the use of resources if this is to be given weight in policy development.
Generally, however, there are clear correlations between subjective wellbeing and many aspects of objective living conditions. Two OECD reports (15; 16) have examined the problems associated with measuring subjective wellbeing and have concluded that the most commonly used measures were relevant and provided valid information. The 2023 report (16) emphasises the benefits of using subjective wellbeing in policymaking. The use of indicators of a subjective wellbeing was recommended by both the first and second Stiglitz Commission (14). None of these reviews have concluded that the challenges associated with measurements mean that subjective wellbeing cannot be used as one of several indicators of societal development. Statistics Norway’s measurement system for subjective wellbeing is based on a thorough review of the research literature on measurement issues, including the OECD guidelines. However, it is important to be aware of pitfalls and interpretation issues when using this, as with all other welfare statistics.
Statistics Norway’s national measurements of the population’s wellbeing are based on three sources: respondents’ assessments of their own subjective wellbeing, descriptive indicators and register information. This information provides a good basis for knowledge about the population’s wellbeing and is an important supplement to the indicators in Statistics Norway’s proposed indicator framework. In this framework, subjective wellbeing is one of ten dimensions. The others consist either exclusively of objective indicators or in other cases, a combination of objective and subjective indicators. Objective measures include life expectancy, perpetually low income, NEET (Not in Education, Employment or Training) and deaths attributed to narcotics, intoxication or suicide. A nuanced measurement system must show the breadth and diversity of a population’s interests and concerns, and what is important in their lives. The subjective wellbeing is important, but it is not all that matters. The National Wellbeing Strategy has therefore used both subjective and objective components for wellbeing as a measure of and for societal development.
Chapter 4.1 provides a description of the national wellbeing surveys, while Chapter 5.1 provides a more detailed description of the indicator framework.
Based on regular measurements, follow-up of the indicator framework and legal and regulatory framework, wellbeing can be incorporated into goals and priorities both nationally and locally and become a component of the authorities’ decision-making processes. Countries that are at the forefront of efforts to implement wellbeing as a measure of societal development largely use economic instruments, e.g. through various forms of wellbeing budgeting.
In Norway, the Norwegian Public Health Act requires systematic overview work at regional and local level. County authorities and municipalities are therefore well placed to work in accordance with principles that are compatible with wellbeing as part of the decision-making basis for political prioritisation. At the government level, consideration will be given to developing a system for how wellbeing and distribution can be emphasised in plans and budgets across sectors. A figure providing an overview of the measures and actions that can be taken can be found in Chapter 5.2.6.
3.1 Equalising social differences in wellbeing
Inequality in material security or finances is often a key determinant of wellbeing and can be manifested through more qualitative experiences, such as the extent to which one experiences meaning, social support or life mastery. Socioeconomic differences are associated with social differences in wellbeing.
The national wellbeing surveys conducted by Statistics Norway since 2020 show that several groups score significantly lower on all 12 indicators of subjective wellbeing compared to the rest of the population. This applies to people who are unemployed, people in the lowest income bracket, people with a low level of education, people with disabilities or with symptoms of mental illness, and LGBTQ+ individuals. Other groups that score lower than the rest of the population on indicators 9 through 11 are people with low incomes, disabled persons, people under the age of 45 living alone, people aged 18–24 and students/pupils. Fylkeshelseundersøkelsene(2019–2022) [the County Health Surveys (2019–2022)] (available in Norwegian only) indicate that Sámi people in Nordland, Troms and Finnmark score the same as or somewhat lower than the rest of the population on questions about wellbeing (17).
The 2024 National Wellbeing Survey indicates that subjective wellbeing is unevenly distributed in the population, similar to previous surveys. People with a university or college education, people with a high income and employed people are among those who are most satisfied with life and that report a good wellbeing more often than others. People living with a partner or spouse are also among those who report higher than average satisfaction on many of the indicators included in the statistics. Unemployed people, people with health problems and single people are among the groups that are less satisfied with life and more often experience a low wellbeing. Non-heterosexuals are also among the most vulnerable groups.
Participation in working life may be important for wellbeing and there is a significant difference in wellbeing for unemployed and disabled persons and that of employed persons. Disabled people are a group with health issues who are entirely or partially outside the labour market. Those with long-term health issues and or symptoms of mental health problems, regardless of labour market status, are also among those groups with the highest proportion of reported dissatisfaction with life – 40 and 60 per cent respectively in 2024.
Sexual health is positively associated with both general health and perceived wellbeing (18). Individuals with a sexual orientation other than heterosexuality are also among those groups with the poorest subjective wellbeing. The 2023 Ungdata survey shows that young people with sexual orientations other than heterosexuality are less satisfied with life than those who are heterosexual. They are also less optimistic about the future, are more lonely, have poorer relationships in school and with parents, and are more often subjected to bullying and sexual abuse than others (19).
Parts of the immigrant population are also a vulnerable group. According to the Living Conditions Survey (Statistics Norway 2017) (20), immigrants have on average poorer living conditions than the general population in terms of finances, employment, working conditions, housing standards, social relationships and health. From 2020 to 2022, 28 per cent of all individuals with an immigrant background living in Norway had a persistently low income, compared with 11 per cent of the entire population (based on the EU603). Furthermore, 6 out of 10 children in the low-income group have an immigrant background, according to a report by Statistics Norway in January 2024 (21). Large families and low parental employment are among the factors that could explain this.
The immigrant group as a whole does not differ much from the rest of the population on many of the indicators, despite having poorer living conditions on average. At the same time, there are significant and most likely selective non-responses from immigrants in the surveys that could have impacted these results. Immigrants comprise a significantly varied group and the proportions stated in the tables may to some extent conceal the fact that there may be major differences in wellbeing between immigrants with different national backgrounds, basis for residence and length of stay in Norway. The aim should be to capture this part of the population to a greater extent, both as a whole and in the form of different groups.
The National Wellbeing Survey was carried out five years in a row, from 2020 to 2024. Coincidentally, the implementation of the first three surveys coincided with major changes in the world situation. The first survey in March 2020 was conducted during a period where society gradually shut down due to the pandemic. The following year, in March 2021, the population was living under a number of restrictions, and some places in the country, such as Oslo, shut down again. At the time of the survey in March 2022, the war in Ukraine had just broken out. The surveys in March 2023 and 2024 were conducted while the war in Ukraine was still going on and there was a period of steep price increases and rising interest rates. It is difficult to know for certain how the various circumstances have affected the results of the surveys, However, it is likely that people have felt more stress and anxiety than they otherwise would have.
The economic situation in 2023 and 2024, with steep price increases and rising interest rates, has also likely had an impact on the population’s general satisfaction. For instance, satisfaction with one’s own financial situation declined from 6.6 in 2021 to 6.2 in 2023 and 2024 on a scale of 0–10. Changes in how people experience their own personal finances varies among different groups, and the decline in satisfaction is greatest among those aged 25–44 and the working population. Older individuals and pensioners, on the other hand, did not generally report a decline in satisfaction with their financial situation.
On behalf of the Norwegian Directorate of Health, Statistics Norway has conducted analyses of social inequities in wellbeing (22). In these analyses, Statistics Norway has tried to determine which categories have had the greatest impact on wellbeing and have studied interaction effects that show whether the impact of certain categories (e.g. unemployment) vary due to another category (e.g. disability). The analyses show that most people in the population have one or more of the characteristics associated with a lower wellbeing and that a majority have two or more. The analyses also show that the impact on wellbeing largely depends on individual characteristics. For example, the report mentions that people under the age of 45 with a low income have a higher wellbeing (average 7.9) than the national average, while people who have little financial freedom and long-term health problems have a somewhat lower wellbeing (average 6.4) than the national average.
Wellbeing in Norway appears to be evenly distributed geographically. Statistics Norway’s 2024 national survey on wellbeing shows no significant differences in “satisfaction with life” between counties. Nor are there any significant differences with respect to centrality. The least central municipalities score just above the national average, 7.0 compared to 6.9. The County Health Surveys show significant differences between municipalities, but they do not appear to vary according to centrality. Other factors, most often the demographic composition, can explain these differences. It can be assumed that this even geographical distribution in wellbeing is related to Norway’s universal welfare schemes and services regardless of geography, and that the economy is generally doing well throughout the country.
There are somewhat greater geographical differences in subjective wellbeing when people are asked about satisfaction with specific aspects of life, such as where they live. Satisfaction with where one lives is lowest in the least centralised areas (7.6) and in Finnmark (7.3), while satisfaction is highest in the second most and moderately central areas (8.0) and in Vestfold (8.3).
The national, regional and local measurements of wellbeing, in addition to the choice of indicators in the indicator framework, as well as Statistics Norway’s report on social inequities in wellbeing, will provide more knowledge about differences in wellbeing and reasons for these differences. This can provide a better basis for policy development and have significance for achieving the goal of equalising social differences in wellbeing in Norway.
The majority of the population in Norway has, and has had a good wellbeing. This is likely due to specific historical and cultural conditions, which in total have given us the society we have today. At an overarching level, we have a welfare state that provides its citizens with a number of universal welfare programmes. Other important factors include the redistribution of wealth, trust between citizens and in the governance system, a well-functioning legal system, a transparent public administration and a well-regulated labour market.
Over the past few decades, Norway has therefore used various other measures and instruments to create the welfare state we have today, which is broader than what GDP is able to measure. Norway is also ranked second highest on the Human Development Index, which includes all countries in the world. The index was developed by the United Nations Development Programme (UNDP) to emphasise that economic growth alone is not sufficient to assess a country’s development. The index measures a country’s average achievements in three basic areas: Life expectancy, education and income (GDP per capita).
The Nordic countries all have high GDP and are stable welfare societies. They are among the ten countries with the highest scores for subjective wellbeing in the World Happiness Report published by the UN Sustainable Development Solutions Network (SDSN). However, Norway dropped from number 1 in this ranking in 2017 to number 7 for the third consecutive year in 2025, and inequalities in health and wellbeing are increasing. A report on inequality in health and wellbeing in Norway (the Marmot Review report) (23) describes Norway as a country characterised by a high and rising standard of living for large parts of the population, but also with significant and persistent social and economic inequality. The report points out that although Norway has a long tradition of welfare policies and structural goals, inequalities in health and social determinants still exist and are increasing.
Figure 3 illustrates how prosperity in Norway has significantly increased by around 70 per cent, while the percentage of those who consider themselves happy compared to not happy has been relatively stable or declining.
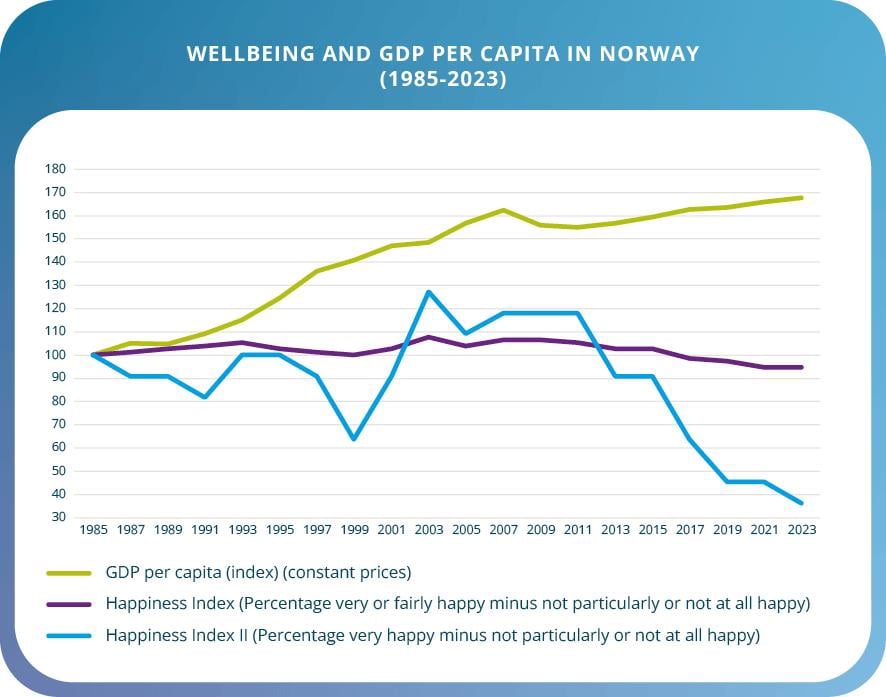
Figure 3. Subjective wellbeing and GDP per capita in Norway 1985–2023
The values are normalised to 100 for the 1985 base year to show relative development over time. Source: GDP figures and median income from Statistics Norway; figures on wellbeing/happiness from Norsk Monitor
Prepared by Henrik Lindhjem, Menon Economics
The decline in the happiness index from 2011 to 2023 has been particularly sharp in younger age groups. In these age groups, growing concerns about what the future will look like in terms of career and educational opportunities and finances may be explanatory factors. Other factors that appear to contribute to reduced happiness and satisfaction are dissatisfaction with social relationships, health, physical fitness and body image.
3.2 Wellbeing as a component of welfare policies
The aim of labour and welfare policies is to create financial security, to equalise differences in income and living conditions, and to contribute to help and self-help (24). Labour and welfare policies are therefore closely linked to wellbeing.
For the individual, employment provides income, a sense of belonging and better living conditions. Employment can be a key aspect of good living conditions that fulfils many material, social and psychological needs, provided there is also a good working environment. A high level of employment also means we can have good income security schemes that ensure income and freedom for those who are unable to work. This coincides with what is referred to as a subjective and objective wellbeing (cf. Chap. 2.3). Income and access to financial resources provide opportunities for consumption and investments and are important prerequisites for a high wellbeing. Welfare also depends on how the country’s income is distributed, on the population’s state of health and mortality, access to cultural, natural and recreational resources, access to leisure time and the extent of loneliness and crime. International studies emphasise a relatively close relationship between a country’s value creation, economic inequality and other indicators of living standards and welfare. However, it is worth noting that a high level of material wealth is not necessarily synonymous with a high wellbeing and good public health (25).
The Norwegian working life model is characterised by a high level of unionisation, a high prevalence of collective bargaining agreements and good co-operation between the parties, which has resulted in high productivity, strong competitiveness and considerable adaptability in Norwegian working life. The model has also contributed to a compressed wage structure and smaller economic differences.
Employment and a secure working life form the basis for good value creation. A high employment rate also finances welfare schemes. Income security schemes are designed to contribute to financial security for the individual, equalise differences and contribute to good economic growth. The contribution of income security schemes and public welfare services for reducing economic inequality is essential for improving the living conditions of vulnerable groups and has previously shown a correlation with the general wellbeing in the population. Labour market policies are intended to promote a good supply of labour, reduce and prevent unemployment and prevent people from being excluded from the labour force for long periods. Labour market measures are an example of an instrument designed to strengthen the individual’s ability to find work, which could contribute to an improved wellbeing for the individual.