4 Activities, value creation and management
Norway’s large, rich sea areas and up-to-date sea-based activities have given us a leading position as a maritime nation. Few other nations are as dependent on the contribution of sea-based activities to value creation and prosperity. Petroleum, shipping and seafood are Norway’s largest export industries, and there is considerable potential for future offshore renewable energy production. Travel and tourism in coastal areas, especially along the shores of the Skagerrak, also contribute substantially to economic value creation.
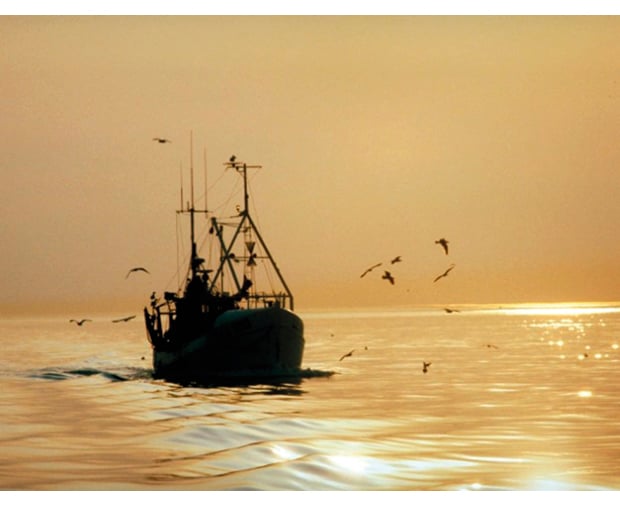
Figure 4.1 Fishing vessel
Source Photo: Institute of Marine Research
In 2009, petroleum activities in the management plan area generated value added amounting to NOK 310 billion, and provided 18 000 person-years of direct employment and 110 000 person-years of indirect employment. Value added from shipping was NOK 38 billion, with 26 000 person-years of direct employment and 19 000 jobs in related industries. The figures for travel and tourism are from 2007: value added was around NOK 25 billion and total employment was around 58 000 person-years in the North Sea and Skagerrak counties. In 2010, value added from core activities in the seafood industry, in other words fishing, whaling and sealing, fish farming, fish processing and wholesale, was NOK 28 billion, with a production value of NOK 91.2 billion and 24 300 person-years of employment. Offshore renewable energy production may be started in the management plan area in the future.
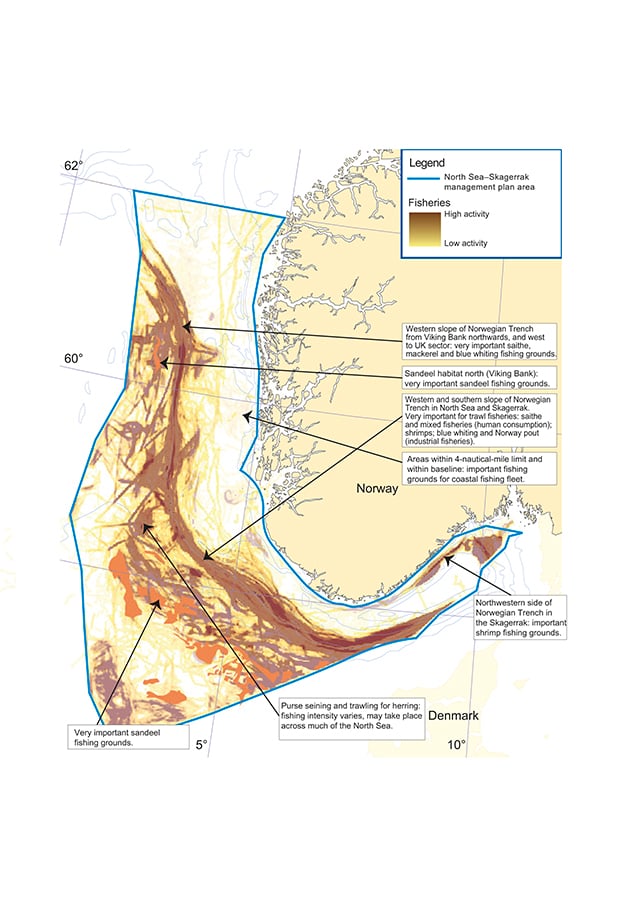
Figure 4.2 Important areas for fisheries in the North Sea and Skagerrak. Vessel activity (Norwegian and foreign vessels) in 2011.
Source Directorate of Fisheries, Norwegian Mapping Authority
4.1 Fisheries and seafood
The North Sea and Skagerrak are surrounded by densely populated land areas, and living marine resources in these waters have been heavily exploited for generations. Harvesting has often been above sustainable levels, and earlier overfishing has resulted in a decline in catch sizes. One reason for this situation is that since the North Sea–Skagerrak area is surrounded by so many coastal states, it is under greater pressure than the Norwegian Sea and the Barents Sea–Lofoten area, and the management challenges are therefore more complex.
4.1.1 Activity
Fisheries in the North Sea part of the management plan area are conducted by both Norwegian and foreign vessels. Norwegian vessels participating in fisheries for the largest commercial fish stocks, particularly saithe, mackerel and herring, also include vessels registered in counties that do not border on the management plan area. EU vessels that have been allocated quotas in Norway’s Exclusive Economic Zone during negotiations on bilateral agreements are also active in these waters.
Fisheries in the management plan area in the Skagerrak are conducted mainly by Norwegian, Danish and Swedish vessels. Most of the Norwegian vessels are from the counties bordering on the management plan area.
In the period 1990–2010, the share of the total catch value in Norwegian waters taken in the Norwegian part of the North Sea and Skagerrak varied from year to year, but was on average 25 %. The corresponding figure for catch quantity was on average 23 %, which shows that the return on catches in other Norwegian sea areas was somewhat smaller than in the North Sea and Skagerrak. The proportion of the total catch has shown a declining trend in the last 10 years, primarily owing to the increase in catch quantities from the major stocks in the Barents Sea during this period.
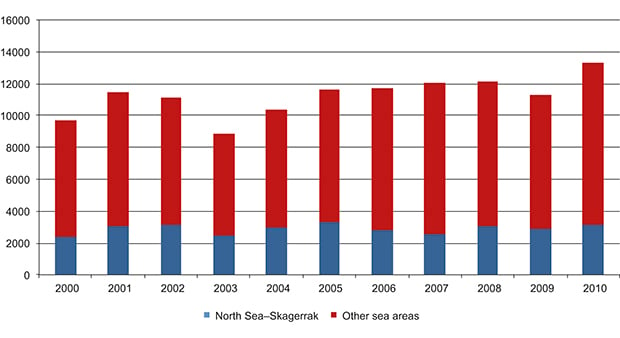
Figure 4.3 Value of fisheries in the North Sea and Skagerrak and other Norwegian sea areas, 2000–10. NOK million
Source Statistics Norway
The annual catch quantities in the North Sea declined in the period 2000–10, although the catch value increased by 34 %. Catch quantity dropped by 16 %. In 2010 the catch quantity was 550 000 tonnes, and the annual average for the period 2000–10 was 578 000 tonnes. Pelagic species accounted for 86 % of total catch quantity and 74 % of total catch value in this period. There were very large variations in catches of blue whiting, herring, Norway pout and sandeel.
Annual catch quantities in the Skagerrak also declined, by 39 % from 2000 to 2010. However, the landed value of the catches rose by 14 %. In 2010 the total catch quantity was 12 000 tonnes, while the average catch quantity for the period 2000–10 was 15 000 tonnes. Pelagic species accounted for half the total quantity and crustaceans and molluscs for 65 % of the total value, much of which was salt-cooked shrimp.
It is difficult to predict very long-term trends in the various stocks and in total catch quantity, since these are influenced by pressure from human activities as well as natural fluctuations. Several fisheries in the North Sea and Skagerrak have suffered a negative trend, partly owing to overfishing. Total catches of cod have declined from 200 000–300 000 tonnes in the 1960s to 20 000–30 000 tonnes today. However, the negative trend for a number of stocks is being reversed owing to improved management, so that harvests in the management plan area may increase in the future.
There are three factors in particular that will determine developments in the fishing industry in the management plan area up to 2030:
any changes in the EU Common Fisheries Policy;
the effectiveness of the Norwegian fisheries industry, and the development of management strategies in cooperation with the EU;
climate change and other pressures that have physiological effects on fish, and ecological interactions between fish stocks.
If developments in these three areas are positive, this will considerably strengthen the North Sea and Skagerrak as fishing grounds. Cooperation with the other coastal states will be essential for controlling the pressure from human activities on stocks that migrate between different countries’ Exclusive Economic Zones and international waters.
Most aquaculture activity along the coastline bordering the management plan area is concentrated in the counties of Western Norway, along the North Sea coast. Fish farms in the counties of Sogn og Fjordane, Hordaland and Rogaland hold 31 % of all licences issued for salmon and trout farming in Norway. Aquaculture is not regulated in the present management plan, but the industry is affected by environmental conditions in the North Sea and Skagerrak.
4.1.2 Value creation and employment
The seafood industry is Norway’s next largest export industry and the value added it generates has increased substantially in the last few years. Norwegian seafood products are continually winning new markets worldwide, and in spite of large fluctuations, there has been an overall rise in prices. Rising international prosperity is being accompanied by a growing focus on health and nutrition, providing further opportunities for the Norwegian seafood industry. However, the emphasis on quality has also increased, which makes even greater demands on catch handling, product quality and the environmental status of the nursery areas of fish and crustaceans. Norway’s future visions and goals for ensuring that its seafood industry is in the lead worldwide are described in a white paper on seafood (Meld. St. 22 (2012–2013) Verdens fremste sjømatnasjon, in Norwegian only).
For hundreds of years the fisheries industry has occupied a very important position both in Norway and in the other regions bordering on the North Sea and Skagerrak, and these waters are used by both the coastal and the ocean-going fishing fleets. Coastal fisheries off southern and eastern Norway, however, have become less profitable in the last few years because of negative trends in a number of populations such as cod, spiny dogfish and European eel. In response, restrictions have been introduced on fishing activities and on permitted target species. It is vital for the fisheries industry that environmental and fisheries management is successful in restoring the resource base to previous levels. This will also benefit other local activities and industries along the coast.
In 2009 Norwegian vessels caught around 0.5 million tonnes of fish and crustaceans in the North Sea and Skagerrak, with a catch value of almost NOK 2.5 billion. The total value of all catches in Norway that year was NOK 11.3 billion, so that catches from the North Sea and Skagerrak accounted for just over 20 % of total value in 2009.
In 2010, value added from the Norwegian seafood industry (including spin-off activities) totalled NOK 46.5 billion, employment was around 44 000 person-years and overall production value was NOK 137 billion. Core activities, in other words fishing, whaling and sealing, fish farming, fish processing and wholesale, generated NOK 28 billion in total value added, had a production value of NOK 91.2 billion and provided 24 300 person-years of employment. Every krone generated by core activities in the fisheries and aquaculture sector resulted in NOK 0.7 in value creation in other sectors (for example supply industries), and every person-year of employment resulted in 0.8 person-years in other sectors.
In 2010, the aquaculture industry in Western Norway generated value added of NOK 13.7 billion and employment of 13 294 person-years when the spin-off effects in the region and the rest of the country are included. The corresponding figures for Eastern Norway were NOK 2.7 billion and 3 702 person-years.
The number of fishers and fishing vessels in the management plan area declined by more than 30 % from 2000 to 2010, and fewer than 2000 vessels are now registered. This is primarily the result of a deliberate restructuring and rationalisation of the fisheries with a view to adapting the manpower and catch capacity to the resource base and thus improving profitability. At the end of 2010, there were 2 260 full-time and 680 part-time fishers living in the counties bordering on the North Sea and Skagerrak. The proportion of part-time fishers was largest in the Skagerrak area.
According to figures from the Directorate of Fisheries, employment in the aquaculture industry in Sogn og Fjordane, Hordaland, Rogaland and Eastern Norway increased by 21 % from 2000 to 2010, from 1777 to 2153 person-years. In the fisheries and aquaculture sector as a whole, however, there has been a slight decline in employment.
4.1.3 Fisheries management
The overall framework
As a coastal state and steward of living marine resources, Norway has national and international commitments under international law. The following are among the most important international agreements to which Norway is a party:
The 1982 Convention on the Law of the Sea of 1982 and the 1995 Agreement on implementation of the provisions of the Convention on the Law of the Sea (UNCLOS) relating to the Conservation and Management of Straddling Fish Stocks and Highly Migratory Fish Stocks (Fish Stocks Agreement);
The 1992 UN Convention on Biological Diversity;
The 1995 Code of Conduct for Responsible Fisheries from the Food and Agriculture Organization’s (FAO).
It is a guiding principle that marine resources should be based on the precautionary approach in accordance with international agreements and guidelines, and using an ecosystem approach that takes into account both habitats and biodiversity. These commitments have been emphasised in Norway’s Marine Resources Act.
The Marine Resources Act regulates all harvesting and other utilisation of wild living marine resources and genetic material derived from them. Under the Act, the management authorities must evaluate which types of management measures are necessary to ensure sustainable management of these resources. This management principle does not impose requirements for how, when or how often the authorities should evaluate measures, but makes them responsible for evaluating at regular intervals whether there is a need for some form of regulation. According to this principle, surplus living marine resources may be harvested, but this must be done in a way that ensures that future generations can do the same.
The International Council for the Exploration of the Sea (ICES) promotes and coordinates marine research in the North Atlantic area and disseminates the results. On the basis of scientific assessments, the ICES Advisory Committee (ACOM) provides advice on proposed management strategies, and recommends total allowable catches (TACs) for the various fish stocks every year. The Norwegian Institute of Marine Research participates actively in ICES and provides data from scientific cruises and mapping data, and performs a significant amount of the research on which ICES advice is based.
ICES’ recommendations on TACs are not politically binding, but there is a growing tendency in international fisheries management to set quotas in line with these recommendations. Another trend in the last 10 years is to adopt long-term management strategies and rules for harvesting important commercial stocks.
Textbox 4.1 The Norwegian sandeel management model
Sandeels are widely distributed in large areas of the North Sea, and were previously treated as a single stock shared between Norway and the EU.
In response to overfishing of sandeel in certain areas in the Norwegian part of the North Sea, Norway has introduced a new management model for the species. The aim is to build up viable spawning stocks throughout the distribution area of sandeel in Norway’s Exclusive Economic Zone. Following this model an area-based management plan with a limited open season has been developed. Closure of parts of the areas of sandeel habitat reduces the possibility of local overfishing.
The management plan for sandeel contains the following elements:
Background. Sandeels are highly stationary and an important source of food for larger fish, marine mammals and seabirds. For the ecosystem as a whole, it is therefore vital that sandeel are found throughout their natural area of distribution. There are strong indications that recruitment is generally stronger and more even in areas where there is a viable spawning stock.
Management objective. The objective of the new management model is to maintain viable local spawning stocks of sandeel throughout their range in the Norwegian zone. This will maintain the key role of sandeel in the ecosystem, and provide a basis for a high sustained yield by ensuring that sandeels can spread throughout their natural range.
Closure of areas. Under the new model, sandeel habitat in the Norwegian zone has been divided into six areas, each of which has two subdivisions (marked a and b, see Figure 4.4). If the population in one area is estimated to exceed a predetermined level, one subdivision (either a or b) of the area is opened for fishing but not both. Subdivisions are opened and closed alternately from year to year.
Close season. In order to take advantage of the rapid increase in sandeel biomass in spring (from the beginning of April), the fishery opens on 23 April and closes on 23 June, when older sandeels normally cease to emerge from the sand to feed. Closure prevents harvesting of juveniles, which often dominate the catches after this date.
Minimum size. The measures to prevent harvesting of juveniles also include temporary closure of sandeel areas during the fishing season if the intermixture of undersized fish (length under 10 cm) exceeds 10 % by number. The closed area is reopened after seven days, but if the proportion of fish below the minimum size is still too large, it will be closed for another seven days.
Implementation of the management plan. The Institute of Marine Research conducts acoustic surveys of sandeel abundance in April–May each year. On the basis of the surveys, the Institute advises on which of the six main areas should be opened to fisheries in the subsequent year and sets an overall quota for these areas. The figures may be adjusted in the light of data from the following year’s surveys. Although a limited catch from the opened areas is permitted, closure of one subdivision in each area should ensure viable local spawning stocks.
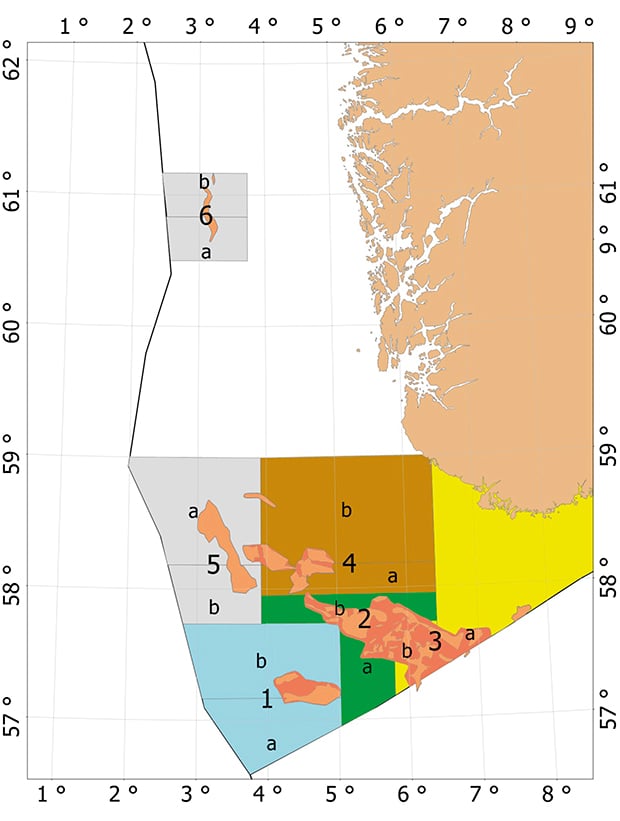
Figure 4.4 Area-based management of sandeel.
Source Institute of Marine Research
It will be important to make use of experience gained from the implementation of the management plan. The plan will be evaluated and if necessary adjusted at the end of every season.
Norway and the EU – cooperation on management in the North Sea and Skagerrak
Norway shares most of its fish resources with other countries, so that international cooperation on their management is essential. The EU is Norway’s main partner in the North Sea and Skagerrak. Under the United Nations Convention on the Law of the Sea, Norway and the EU have an obligation to cooperate on the management of shared fish stocks in this sea area.
In 1980 Norway and the EU concluded a bilateral agreement on fishing, which is implemented in the form of annual fisheries arrangements. The annual arrangements set out the agreed joint management measures, including long-term measures, and exchanges of quotas. They also include a wide range of provisions on technical measures and cooperation on control and enforcement.
TACs for joint stocks are shared on the basis of agreed allocation keys. Norway’s share is at present well under 50 % for most of the stocks apart from saithe, where we have 52 %. Thus Norway can only address management challenges through close, constructive cooperation with the EU.
Differences between the management models chosen by Norway and the EU can make cooperation challenging. The clearest example is the difference between Norwegian and EU discard policy. Norway has a ban on discards in Norwegian waters, and to back this up a number of measures have been implemented to avoid catches of fish that are likely to be discarded. The EU, on the other hand, has a discard requirement when a quota is exceeded or when the catch composition (size or species) is illegal. In addition there are differences between the technical measures required by Norway and the EU. Although in the last few years the parties have agreed on a number of measures to reduce discards, the widespread practice of discarding fish continues to be the most significant problem in the EU in the efforts to achieve sustainable management.
In 2011 the European Commission put forward a proposal for reform of its Common Fisheries Policy that included a ban on discards. The proposal has to be considered by the European Council and the European Parliament before being adopted, and Norway has expressed its willingness to support it. In November 2011 the fisheries ministers of Norway, Denmark and Sweden signed a joint statement on the introduction of a ban on discards of fish in the Skagerrak from 2013.
In spite of the considerable differences between the fisheries management regimes in Norway and the EU, the parties cooperate closely on other management issues, such as long-term management measures for joint fish stocks. The stock most urgently in need of rebuilding is North Sea cod.
Regulation of fisheries at national level
Once negotiations with other countries have been completed, it is clear how much of each stock Norway can harvest in the subsequent year, and the rules for the Norwegian fisheries can be adopted. The Directorate of Fisheries draws up proposals for quota regulations, which are discussed at an open consultative meeting at which a broad range of business associations and interest organisations are represented. On the basis of these processes, the Directorate sends draft regulations to the Ministry of Fisheries and Coastal Affairs, which adopts the quota regulations unless the Directorate itself is authorised to adopt them.
The regulations contain provisions on the allocation of quotas to vessel groups and individual vessels, the allocation of quotas for specific periods, bycatches, rules on replacing vessels, exemptions, and so on.
In addition to the annual quota regulations, Norway has a number of permanent national and local regulations. These include provisions on the use of gear, types of gear, mesh sizes, minimum sizes, the ban on discards, and requirements to use sorting grids.
Textbox 4.2 Important fisheries rules in the Exclusive Economic Zone of Norway south of 62 °N
Ban on discarding dead or dying fish.
Specific rules on mesh design and minimum mesh size in trawls and Danish seines, and technical provisions on gear selectivity.
Specific rules on mesh design and minimum mesh size when gill-netting for named fish species.
Provisions on minimum sizes and measures to limit catches of fish under the minimum size.
Provisions on bycatches to prevent fishing for larvae and undersized fish and prevent intermixtures of non-target species.
Permanent and temporary closure of areas to fishing with small-meshed trawls to prevent fishing for larvae and undersized fish.
Area-based regulation of sandeel fisheries to prevent depletion of local stocks.
Periodical opening of certain fisheries (for example the small-meshed trawl fishery for Norway pout) to ensure the fishery is directed as closely as possible towards the target species.
Requirement to use sorting grids when trawling for blue whiting, to reduce bycatches of whitefish (cod, saithe, haddock, etc.).
Closure of fishing grounds when there are large numbers of juvenile fish (Real Time Closure Schemes).
Restrictions on the use of specific types of fishing gear. These include measures such as close seasons, restrictions on the depths at which trawls may be used, requirements relating to the design of fishing gear, restrictions on the use of gear types, requirements relating to soak times for gill nets, and prohibitions on fishing for specific species during specific periods.
Closure of areas to lobster trapping.
Closure of coral reef areas to bottom fishing.
Bans on fishing for certain species.
Restrictions on bycatches
Bycatches are catches of all species other than the target species. Bycatches may consist of target species in other fisheries or of unintentional catches of species or sizes of fish that should not be harvested at all.
While some fisheries are relatively clean, others will always include a certain bycatch of other fish species. In addition, there may be bycatches of seabirds or marine mammals.
To ensure that bycatches are included in figures for the total harvest from a particular stock so that harvesting remains sustainable, a certain proportion is set aside to allow for bycatches when the TAC is shared between different vessel groups. For example, trawlers engaged in industrial fishing often take bycatches of North Sea herring. A certain proportion of the TAC is therefore set aside in the quota regulations to allow for these bycatches.
The Norwegian authorities seek to reduce unwanted bycatches by imposing requirements to use selective gear or sorting grids or by opening and closing fishing grounds as appropriate. Such measures are specifically designed to avoid bycatches of larvae, undersized fish and species with unfavourable stock status. Efforts are also being made to develop gear and fishing methods that will reduce bycatches of seabirds and marine mammals. However, fishing gear will always take a certain proportion of bycatch together with the target species. For fishing to be at all possible, and to ensure compliance with the Norwegian requirement to land all catches, it is necessary to permit a certain intermixture of other species.
4.2 Shipping
The North Sea–Skagerrak area is one of the most heavily trafficked in the world. There are several important transport routes, for example for vessels in transit along the Norwegian coast to northern waters, traffic to and from the Baltic Sea, and traffic between the major ports in Norway and other North Sea countries. The North Sea and Skagerrak are used by every vessel category and to transport all kinds of cargo.
4.2.1 Activity
There is a larger volume of shipping in the North Sea and Skagerrak than in other Norwegian sea areas, and it is more complex. Figure 4.4 shows that traffic is very heavy in the southern part of the area covered by the scientific basis for the management plan, and three-quarters of maritime transport in the North Sea takes place outside Norway’s Exclusive Economic Zone. General cargo vessels and tankers (oil and/or chemicals) account for 22 % and 11 % respectively of total distance sailed in the area covered by the scientific basis for the management plan. The larger vessels (gross tonnage over 5000) account for a larger proportion of distance sailed outside Norway’s Exclusive Economic Zone than inside it. Few of the largest vessels (gross tonnage over 50 000) call at Norwegian ports.
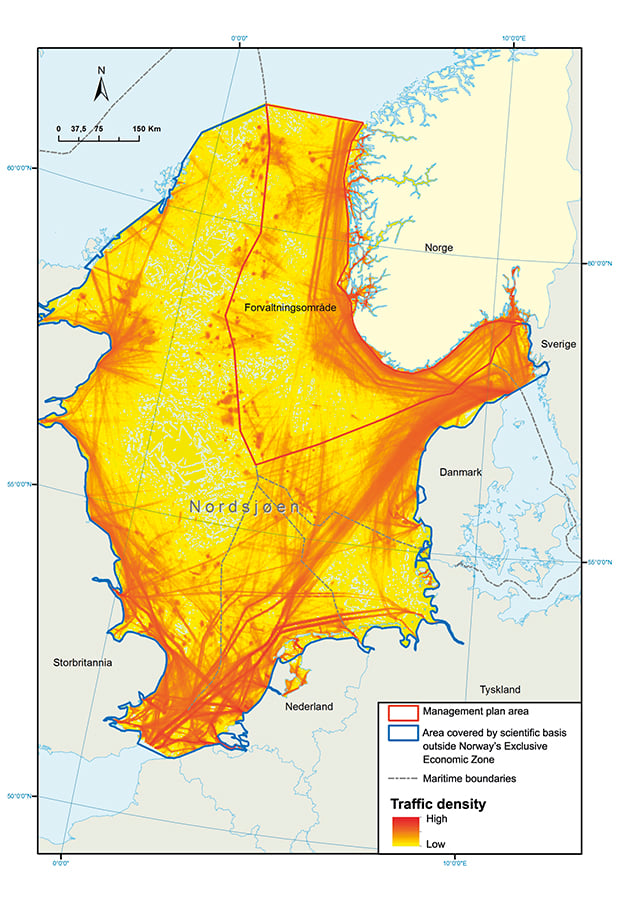
Figure 4.5 Shipping density in the North Sea and Skagerrak in June 2011, based on AIS data.
Source Norwegian Coastal Administration
Domestic maritime transport accounts for around 70 % of all calls at Norwegian ports bordering on the management plan area. however, in terms of volume (tonnes loaded/unloaded) international shipping predominates, accounting for around 65 % of the total.
The volume of goods loaded and unloaded in the ports bordering on the North Sea and Skagerrak compared with the total volume of goods for all Norwegian ports can be found from the annual figures published by Statistics Norway. The statistics cover 81 ports, 37 of which border on the management plan area.
According to the statistics, the total volume of goods transported through Norwegian ports was around 200 million tonnes a year in the period 2002–10. This includes both domestic and foreign vessels.
In 2002, 75 % of the total volume of goods for all Norwegian ports was handled at the ports bordering on the management plan area, while in 2010 the proportion had dropped to around 62 %. This is largely due to the decrease in the volume of oil loaded and unloaded at the port of Bergen, which dropped by around 37 % from 2002 to 2009.
A general increase in the volume of freight transport is expected in the years ahead. One of the new goals of the national transport plan is to shift more freight from road to sea and rail. Maritime transport projections indicate an increase in distance sailed of 11 % in the North Sea and Skagerrak as a whole from 2009 to 2030. The increase is expected to be greatest (18 %) outside Norway’s Exclusive Economic Zone. Within the economic zone, the largest increase in traffic is expected for gas tankers and cargo vessels, while the distance sailed is expected to decline for offshore, supply and fishing vessels. The transport of oil from the Baltic through the Skagerrak is expected to increase by around 40 % up to 2030. Any change in activities will alter the traffic picture, and the demand for maritime transport is also influenced by global economic cycles.
4.2.2 Value creation and employment
Maritime transport is the predominant form of transport for Norway’s foreign trade in goods. In the last five-year period, 20–28 million tonnes of goods were imported annually by ship, and 34–44 million tonnes were exported. In 2010, the share of total freight moved by maritime transport was 77 % for imports and 88 % for exports.
Maritime transport is also very important in the domestic freight market in Norway. In the last five-year period, sea and road accounted for over 90 % of freight transport. In 2010, maritime transport accounted for 42.4 % of domestic freight transport (excluding oil transports from the Norwegian continental shelf).
Table 4.1 shows value added generated by shipping-related industries in regions associated with the management plan area (the North Sea counties, the Skagerrak counties and the inner Oslofjord) in 2009. Total value added was calculated at NOK 54.0 billion, which is 4.6 % of total value added generated in the same area, and somewhat higher than these industries’ share of employment. Sixty-nine per cent of the value added was generated by core activities, and the remaining 31 % by spin-off effects. International shipping was the largest shipping-related industry, and generated value added of more than NOK 42 billion (including spin-off effects).
Value added from maritime transport and related industries is much higher in the inner Oslofjord and the North Sea counties than in the Skagerrak counties, almost NOK 20 billion a year in both regions. This corresponds to 5.3 % of the total value added for the North Sea counties and 3.1 % of the total for the inner Oslofjord. International maritime transport is the dominant sector, and in the inner Oslofjord accounts for almost 85 % of the value added from all shipping-related activities. For the North Sea and Skagerrak counties the figure is just under 80 %.
Table 4.1 Value added generated by maritime transport-related industries in the inner Oslofjord, Skagerrak counties and North Sea counties in 2009 (NOK million)
Value added, 2009 | Inner Oslofjord | Skagerrak counties | North Sea counties | Total, all three regions |
|---|---|---|---|---|
Total value added | 652 440 | 198 500 | 373 060 | 1 219 730 |
Foreign shipping (incl. supply vessels) | 14 240 | 3 810 | 14 190 | 31 520 |
Spin-off activities, foreign shipping | 2 850 | 400 | 1 740 | 10 950 |
Domestic shipping (incl. service industries) | 1 970 | 1 030 | 2 710 | 6 440 |
Spin-off activities, domestic shipping | 880 | 260 | 1 320 | 5 980 |
Sum, shipping-related value added | 19 940 | 5 490 | 19 950 | 54 890 |
Share of total value added | 3.1 % | 2.8 % | 5.3 % | 4.6 % |
Source SINTEF
In 2009 shipping-related industries in the three regions generated 45 000 person-years of employment, or 2.6 % of total employment. Of this, around 26 000 person-years were in core activities and the remainder in spin-off activities.
Table 4.2 shows employment generated by shipping-related industries in the three regions in more detail.
Table 4.2 Employment in maritime transport-related industries in the inner Oslofjord, Skagerrak counties and North Sea counties (person-years) in 2009
Employment, 2009 | Inner Oslofjord | Skagerrak counties | North Sea counties | Total, all three regions |
|---|---|---|---|---|
Total employment | 902 090 | 312 270 | 524 500 | 1 738 860 |
Foreign shipping (incl. supply vessels) | 2 410 | 2 720 | 2 770 | 7 890 |
Spin-off activities, foreign shipping | 3 860 | 630 | 2 580 | 14 620 |
Domestic shipping (incl. service industries) | 4 810 | 4 560 | 9 070 | 18 050 |
Spin-off activities, domestic shipping | 700 | 380 | 1 270 | 4 440 |
Sum, shipping-related employment | 11 780 | 8 290 | 15 670 | 45 000 |
Share of total employment | 1.3 % | 2.7 % | 3.0 % | 2.6 % |
Source SINTEF
Employment in shipping-related activities is highest in the North Sea counties, around 15 700 person-years, or 3 % of total employment in all three regions. The inner Oslofjord comes second, with around 11 800 person-years of employment, while the figure for the Skagerrak counties is around 8 300.
In the inner Oslofjord, foreign maritime transport including spin-off activities is the larger of the two shipping-related sectors, and provides around 6 300 person-years of employment. In the North Sea and Skagerrak counties, domestic maritime transport is larger, and provides 10 340 and 4 940 person-years of employment respectively.
Overall, domestic shipping is the largest of the shipping-related industries in terms of employment, while foreign shipping is largest in terms of contribution to GDP. The reason for the difference is that many of those employed in foreign shipping are hired labour from other countries, while domestic shipping employs a larger number of people registered in Norway.
Projected figures for 2030
The volume of shipping in the North Sea and Skagerrak largely reflects the level of activity in other sectors. Changes in the activity level in the petroleum sector, international economic fluctuations, development of alternative forms of offshore energy production and climate change are examples of factors that could affect activity in the maritime transport sector. The most important factors, however, are general economic developments and business development on land.
SINTEF has estimated value added and employment in the maritime transport industry in 2030. It is estimated that shipping-related industries in the three regions will generate around 44 000 person-years of employment 2030, or 2.3 % of total employment in the area. Of these, 28 710 person-years will be in core activities and the remainder in spin-off activities. Domestic maritime transport (including service industries) will generate the highest level of employment, and account for 61 % of maritime transport-related employment in the area as a whole.
Figure 4.6 shows the projected figures for value added for the whole area for 2030 compared with the figures for 2009. It shows clearly that foreign shipping (core activities) is the largest industry in terms of contribution to GDP in both years.
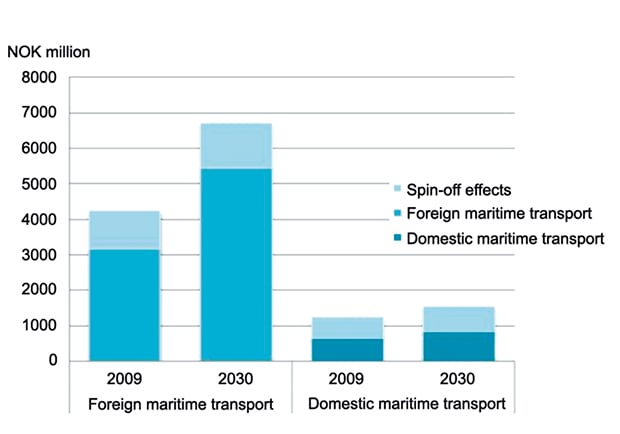
Figure 4.6 Value added from shipping in the three regions together – core activities and spin-off effects
Source SINTEF
Figure 4.7 shows the projected employment figures for 2030 for the whole area compared with the figures for 2009. It shows clearly that domestic maritime transport is the largest industry in terms of employment in both years, and that it will become increasingly important up to 2030. The opposite applies to foreign maritime transport.
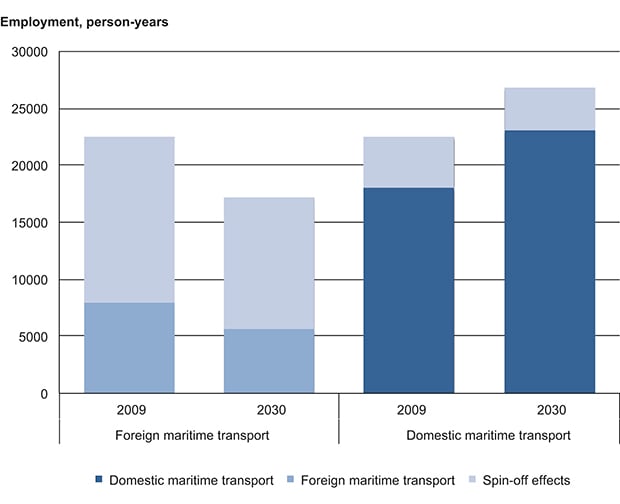
Figure 4.7 Employment generated by shipping in the three regions together – core activities and spin-off effects.
Source SINTEF
4.2.3 Management
Safety and accident prevention measures are a vital part of the management of maritime traffic. The main maritime safety measures are: 1) standards and controls for vessel construction, equipment and operation of vessels, 2) crew qualifications and working environment, 3) control of vessels (flag state control and port state control), 4) traffic regulation, 5) establishment and operation of maritime infrastructure and services.
New traffic separation schemes and recommended routes were introduced in the management plan area in June 2011 to route larger vessels (gross tonnage over 5000) and ships carrying dangerous or polluting goods much further away from the coast. These only apply to vessels in transit off the Norwegian coast and vessels sailing between Norwegian and foreign ports. They do not apply to fishing vessels or passenger or cargo vessels on fixed routes between Norwegian ports, but these vessels are not excluded from following the routing system. The objective of the routeing system is to reduce both the probability of accidents and the consequences of any oil spills in the event of accidents. The routeing measures also strengthen the effects of other maritime safety and oil spill preparedness and response measures.
In situations where a vessel represents an acute pollution hazard, one course of action is to bring it to a port of refuge or, in extreme cases, to scuttle it under controlled conditions to limit the extent of pollution. Whether or not to use a port of refuge depends on the particular situation, including weather conditions and technical factors associated with the vessel in distress. Since 2008 the Norwegian Coastal Administration has been working on identifying and evaluating possible ports of refuge.
The North Sea and Skagerrak have been designated by the International Maritime Organization (IMO) as Special Areas under the International Convention for the Prevention of Pollution from Ships (MARPOL) with regard to discharges of oil and garbage and emissions of sulphur oxides (SOx). This means that particularly stringent controls apply to discharges of oil and garbage. In the North Sea, which has also been designated as a sulphur oxide (SOx) Emission Control Area, there are stricter controls on SOx emissions in addition. A proposal to designate the North Sea a nitrous oxide (NOx) Emission Control Area is in the pipeline. Given these requirements, Norway will promote greater use of liquid natural gas as fuel for ships, which will reduce emissions of NOx, SOx and particulate matter.
The new rules for SOx emissions that will enter into force on 1 January 2015 will reduce emissions of both SOx and NOx.
Norway was one of the first countries to ratify the International Convention for the Control and Management of Ships’ Ballast Water and Sediments (Ballast Water Convention). The convention will enter into force after ratification by 30 states representing 35 % of the world’s merchant shipping tonnage. Pending this, Norway has adopted national regulations for the management of ballast water that regulate the depths at which ballast water may be exchanged, which took effect on 1 July 2010. In 2011 IMO adopted voluntary guidelines for the control and management of ships’ biofouling to minimise transfers of invasive aquatic organisms.
4.3 Petroleum activities
The North Sea was the starting point for Norway’s petroleum industry, and much of the area was opened for exploration as early as 1965. Production started in 1971 on the Ekofisk field. The North Sea still has considerable petroleum potential and will generate substantial value added for many years to come.
The petroleum industry is by far the largest of the industries in the management plan area in terms of both value added and employment.
Over the last 40 years a comprehensive set of tools has been developed that takes other industries and the natural environment into consideration in every phase of petroleum activity, from the opening of new areas for petroleum activities, via the award of production licences, exploration, development and operation, to field closure.
The North Sea differs from Norway’s other sea areas in the scale of oil and gas activities. In 2010, the North Sea fields accounted for about two-thirds of production on the Norwegian shelf. The geology of most of the area is known, there are fewer technical challenges than elsewhere, and there is a well developed or planned infrastructure.
The present management plan provides a good basis for sound management and a predictable regulatory framework for the oil and gas industry. Petroleum activities are already in progress or planned in large areas of the North Sea, and these activities must coexist with the fisheries and comply with general environmental requirements. Comprehensive legislation has been established to ensure this. The current legislation lays down strict requirements for the industry, and a wide range of measures have been implemented to ensure that fisheries interests and environmental concerns are taken properly into account.
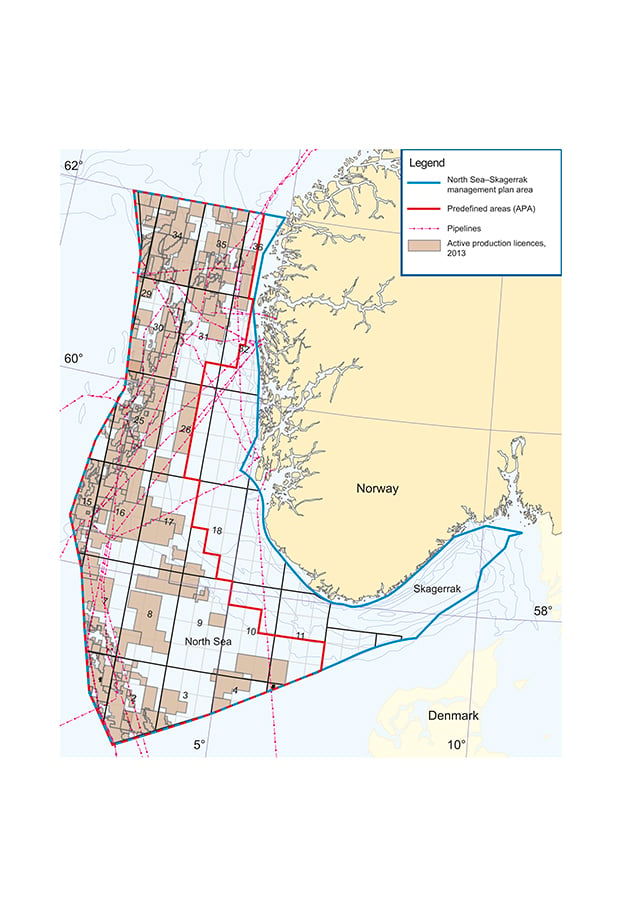
Figure 4.8 Petroleum activities in the North Sea.
Source Norwegian Petroleum Directorate, Norwegian Mapping Authority
4.3.1 Activities and resources
Exploration drilling and production
Since the oil and gas licensing round in 1965 and up to autumn 2012, 1410 exploration wells have been drilled and 659 production licences awarded in the North Sea. Many large discoveries have been made that are still on stream, and new large discoveries are still being made.
According to figures from 2010, a total of 68 fields are on stream on the Norwegian continental shelf, 55 of them in the North Sea. In the same year, the North Sea fields accounted for about two-thirds of production on the Norwegian shelf, or 153 million Sm3 oil equivalents. Ekofisk, Oseberg, Troll and Statfjord are large and important fields in the North Sea. In 2010, the first three of these accounted for 40 % of oil and gas production in the North Sea and 28 % of total production on the Norwegian shelf. The North Sea fields are mainly oil-producing.
Surveys of oil and gas resources
The North Sea is the most comprehensively surveyed petroleum province on the Norwegian continental shelf. Many wells have been drilled and the geology of most of the area is known. Up to the end of 2011, 85 % of Norway’s total production of oil and gas had come from the North Sea, and 56 % of the remaining resources on the Norwegian shelf are expected to be discovered in this sea area. The figures show that the North Sea still has great potential for further discoveries, even large ones, as shown by the Johan Sverdrup oil discovery (16/2–6).
Production forecasts
The forecast for the petroleum sector up to 2030 is based on the authorities’ forecasts of future petroleum production on the Norwegian continental shelf, which in turn are based on the petroleum companies’ reports and the Petroleum Directorate’s resource estimates. The forecast for the North Sea is based on the assumption that production will be relatively stable up to 2020, followed by a decline up to 2030. After 2020 an increasing proportion of the estimated production is attributed to undiscovered resources, and the figures are more uncertain. Since this forecast was made, there have been new large discoveries in the North Sea, and production in this area is therefore expected to be higher than previously forecast, especially in the period 2020–30.
4.3.2 Value creation and employment
The oil and gas industry is Norway’s largest, measured in terms of value added, state revenues and export value. It currently generates about one-fifth of Norway’s total value added and a quarter of state revenues. Oil and gas account for half of the total value of Norway’s exports. Since the start of oil and gas production, the value added generated by the industry has amounted to around NOK 9000 billion at the current monetary value. The petroleum industry and related activities account for over 90 % of value added from sea-related industries in the North Sea and Skagerrak and the adjoining counties. In 2009, value added from oil and gas extraction in the North Sea amounted to around NOK 310 billion.
About 43 000 people are directly employed in the oil and gas industry in the country as a whole, and over 200 000 jobs are directly or indirectly related to the activities on the Norwegian continental shelf.
The oil and gas industry generates more jobs than any other activity in the management plan area. In 2010, about 18 000 persons were directly employed in oil companies that operate the fields in the North Sea, but suppliers and subcontractors also account for a large number of jobs, an estimated 110 000. The figure is expected to increase marginally up to 2020, and to decline to around 60 000 by 2030.
Suppliers to the petroleum industry come from many different sectors. This means that demands from the industry influence activities in a broad range of sectors, such as construction, transport, retail, banking/insurance and other private services. The substantial growth in the petroleum supplier industry over the last 10 years has resulted in higher employment, turnover and value added.
The economic region with the largest number of person-years in the petroleum supplier industry is the Stavanger region, but robust industries have developed in other parts of the country as well, for example in the Bergen region, the Kongsberg/Asker region, Sunnmøre, Sunnhordland and Southern Norway.
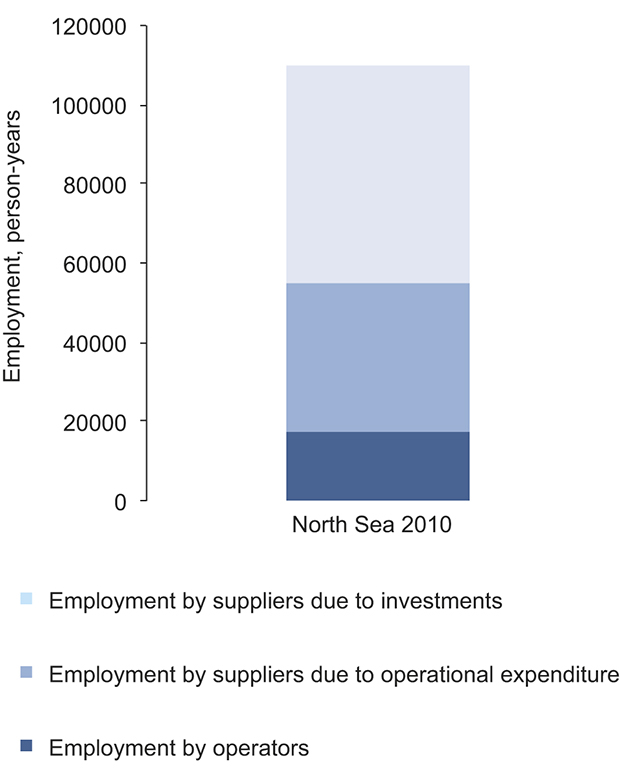
Figure 4.9 Total employment effects attributed to oil and gas activities in the North Sea.
Source MENON and IRIS
In addition to the spin-off effects in Norway, oil and gas activities have helped to build up a competitive Norwegian petroleum supplier industry that over the last 10 years has experienced substantial growth in international sales.
4.3.3 Framework and management
Each of the management plans establishes an overall framework for petroleum activities in the sea area in question. The management plans clarify where petroleum activities will be permitted within areas that have already been opened and within a specific time frame. The framework for activities in areas that have been opened may include environmental and fisheries-related requirements, spatial restrictions and restrictions on when drilling is permitted, and applies to new production licences regardless of whether they are issued during numbered licensing rounds or through the system of awards in predefined areas (APA).
Environmental requirements are applied to all phases of oil and gas activities, from decisions on whether to open areas, via exploration, assessment of whether a field should be developed, the production phase (in specific licences and annual amendments to the licences) to shutdown and decommissioning of installations.
Granting of production licences
The Norwegian continental shelf is generally divided into mature and frontier areas, and large parts of the North Sea are now mature areas. Oil and gas production in these areas goes back more than 40 years, which means that the geology of most of the area is known, there are fewer technical challenges and there is a well developed or planned infrastructure. It is very likely that new discoveries will be made in these areas, but less likely that they will be large, even though the successful exploratory activities of the last few years indicate that this cannot be excluded. Small discoveries are seldom worth developing on their own, and production will therefore have to depend on use of the existing infrastructure.
The Government introduced the APA system in 2003 to ensure that mature areas are thoroughly explored. The awards are made in an annual licensing round. Within the framework established in the management plans, petroleum-related assessments are used to determine which areas are to be included in the APA system and which should be announced in numbered licensing rounds. This arrangement is an important feature in the management of petroleum resources, and has proved to be an effective licensing policy and to contribute to sound utilisation of resources.
The Government has evaluated the APA system in a consultation round in which all the relevant actors were invited to contribute input on their experience of the system. On the basis of the evaluation, the Government decided in summer 2011 to continue the APA system as an annual licensing round for all mature areas on the Norwegian shelf. It was also decided to introduce public consultations in connection with the APA licensing rounds in the same way as for the numbered licensing rounds. If the areas are covered by an integrated management plan for a sea area, the authorities will ask to be notified of any important new information obtained since the adoption of the plan that is relevant to the plan’s provisions on where petroleum activities are to be permitted, and whether new or amended environmental or fisheries-related requirements are needed. The consultation round will thus ensure that relevant information acquired between updates of the management plans is taken into account. The numbered licensing rounds apply to frontier areas on the Norwegian shelf. The most recent allocation of blocks in the North Sea was in 2006. Numbered licensing rounds are normally held every other year. Petroleum companies are invited to nominate blocks. On the basis of these nominations and its own evaluation, the Petroleum Directorate then recommends which blocks should be announced. The Ministry of Petroleum and Energy makes a further assessment of which blocks should be announced, and holds a public consultation on its proposal. On the basis of the assembled responses, the Government makes a united decision on the areas to be announced, and a licensing round is held for these blocks. After the applications have been processed, negotiations are held with the applicant companies on the licensing conditions, and the Government makes the final decision on which companies are to be awarded licences.
The Skagerrak
The Skagerrak was opened for oil and gas activities in 1965 together with the rest of the North Sea, without a preliminary impact assessment. However, after the end of the 1970s there was little interest in exploration activities in the area. In 1987 preparations were started for an impact assessment under the Petroleum Act for the whole of the Skagerrak. This was presented in 1994 in a white paper on challenges and perspectives for petroleum activities on the Norwegian continental shelf. Based on the white paper the Storting decided to open part of the Skagerrak for limited exploration activities in 1994. An area north of 57° 40’ N and east of 8° 30’ E is open for exploration activities under certain conditions. A licence may be awarded to drill up to four exploration wells in the area before any proposal to open the area for further activity is submitted to the Storting. Several dry wells have been drilled just west of the area, and according to the Petroleum Directorate, the potential is greatest in the southern part. The remainder of the Skagerrak is not open for oil and gas activities, and little seismic data is available.
Legislation
The key legislation for the management of Norway’s petroleum resources is the Petroleum Act and the Petroleum Regulations. They include provisions on exploration licences, production licences (including for petroleum extraction), shutdown, environmental impact assessments, materials, information and management systems for activities.
The Pollution Control Act and Pollution Regulations contain provisions relating to pollution from oil and gas activities. New regulations on health, safety and environment in petroleum activities and certain onshore facilities entered into force on 1 January 2011. The regulatory framework now consists of:
The Framework Regulations (which deal with health, safety and the environment in petroleum activities and at certain onshore facilities). The supervisory authorities are the relevant ministries, the Petroleum Safety Authority Norway, the Climate and Pollution Agency and the health authorities.
The Management Regulations (which also deal with the duty to provide information), which apply to offshore activities and certain onshore facilities. The supervisory authorities are the Petroleum Safety Authority Norway, the Climate and Pollution Agency and the health authorities.
The Technical and Operational Regulations for onshore facilities (these regulations have the same general structure as the Activities Regulations and the Facilities Regulations). The supervisory authorities are the Petroleum Safety Authority Norway and the health authorities.
The Activities Regulations, which apply to offshore activities. The supervisory authorities are the Petroleum Safety Authority Norway, the Climate and Pollution Agency and the health authorities..
The Facilities Regulations, which deal with the design and outfitting of offshore facilities The supervisory authorities are the Petroleum Safety Authority Norway, the Climate and Pollution Agency and the health authorities.
At important stages and decision-making points in each project, operators must seek approval from the Petroleum Safety Authority Norway and apply to the Climate and Pollution Agency for a discharge permit (which includes requirements for emergency preparedness and response) under the Pollution Control Act. Operators must also apply to the Norwegian Radiation Protection Authority for a discharge permit in the case of radioactive substances. In addition the Ministry of Petroleum and Energy awards annual production licences and flaring permits, and the Petroleum Directorate awards drilling permits for exploration wells. Operators must demonstrate that they have sufficient control to ensure that activities will proceed in accordance with the legislation.
International instruments
The Convention for the Protection of the Marine Environment of the North-East Atlantic (the OSPAR Convention) provides a comprehensive framework for protection of the marine environment against pollution and other environmental pressures. The OSPAR Commission adopts legally binding decisions and issues recommendations for action to combat pollution and protect the environment. These include common provisions and recommendations aimed at preventing and eliminating pollution and environmental damage from offshore oil and gas activities. Norway has incorporated OSPAR decisions on produced water, the disposal of disused offshore installations, and the use and production of chemicals into Norwegian law.
Common requirements for reporting and monitoring make it possible to evaluate progress and monitor environmental status and pressures on the marine environment so that further action can be taken if necessary.
4.4 Offshore renewable energy
One of the Government’s climate policy goals is for Norway to become a low-emission economy by mid-century. This will require restructuring, among other things to produce more renewable energy. Offshore renewable energy production includes offshore wind power, wave power, marine current power, tidal power and osmotic power. At present, offshore wind power is a marginal sector in Norwegian waters. Apart from a floating wind turbine off Karmøy, there are no offshore renewable energy installations in the management plan area. Although there is great potential for offshore energy in Norwegian sea areas, developments in the years ahead are uncertain, among other things because of the high costs.
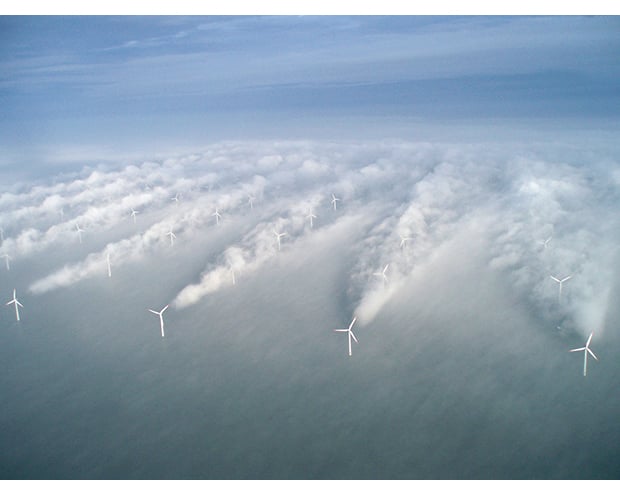
Figure 4.10 Turbulence from Horns Rev offshore wind farm.
Source Photo: copyright Vattenfall
4.4.1 Possible future developments in wind power
The degree of wind power development and other offshore renewable energy production will depend on whether technological advances and framework conditions, such as economic considerations and conflicts of interest, make such production profitable. There are a number of technologies available for development. Wind power is the form of offshore energy most likely to be developed in the management plan area. In 2010 a working group led by the Norwegian Water Resources and Energy Directorate conducted a rough screening of Norwegian sea areas to identify those suitable for wind power development. The group identified 15 areas, five of which are in the management plan area.
In 2011 and 2012 the Water Resources and Energy Directorate conducted a strategic environmental assessment of the 15 areas identified by the working group. The assessments included environmental, economic and business interests associated with these areas and their suitability in technological and economic terms.
After a comprehensive assessment, the Directorate recommended that priority should be given to a total of five areas, four of which are in the North Sea (Figure 4.11). The latter are: Frøyagrunnene, Utsira North, and Southern North Sea I and II. In Statnett’s opinion, it will only be possible to connect one of the areas Southern North Sea I and II to the electricity grid by 2025. The Water Resources and Energy Directorate considers that the technical and economic feasibility of these four North Sea areas is very good, and that the cumulative effects on the environment and the consequences for activities in other sectors are acceptable.
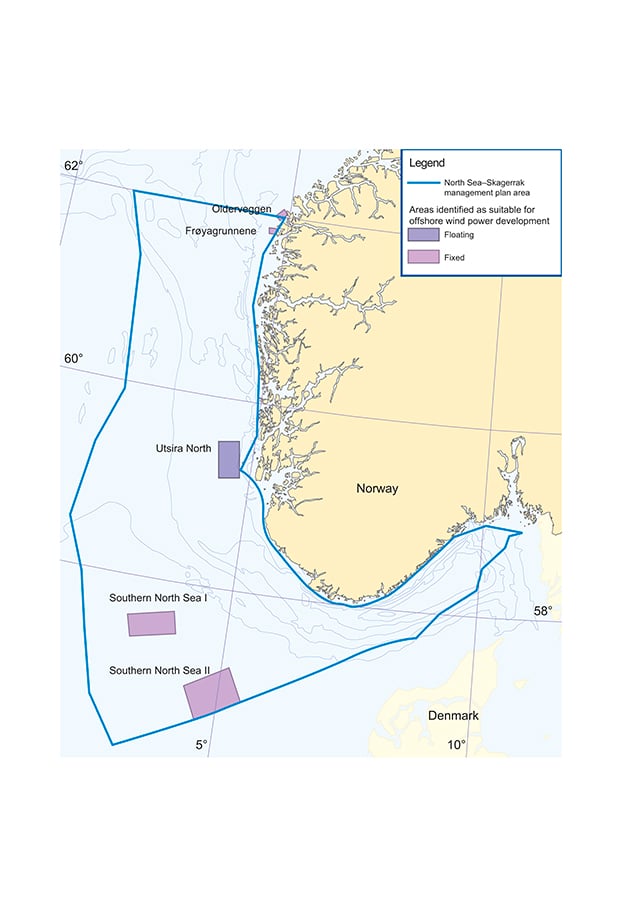
Figure 4.11 Proposed areas for floating and fixed wind power installations.
Source Norwegian Mapping Authority, Water Resources and Energy Directorate
Offshore renewable energy installations can make particular areas wholly or partly unsuitable for other activities. Large-scale offshore wind farms will affect relatively large areas; each turbine occupies an area of around 1 km2, and the turbines are linked by a network of power cables on the seabed, which are joined to a cable that transmits the generated electricity to shore. The four North Sea areas identified as priority areas by the Water Resources and Energy Directorate measure from 58 km2 to 2591 km2. Each wind farm will occupy an area of 40–400 km2. If the areas are fully developed, the total area affected will be up to 750 km2, assuming a turbine size of 5 MW and that only one of the areas Southern North Sea I and II is developed. The possible spatial overlap with other activities is described in more detail in Chapter 5.
Offshore wind power is a growth industry in Europe, driven by the EU’s Renewable Energy Directive, the poor conditions for onshore renewable energy production and the fact that a number of countries have introduced support schemes for specific types of technology. By mid-2012, just over 4 GW of wind power capacity had been developed in European marine waters, and installations with a potential capacity of 20 GW were either under development or had been granted a development permit. The European Wind Energy Association has estimated that 40 GW of wind power capacity could be developed by 2020. In the UK alone, a total of 25 GW of wind power capacity will be in production or under development by 2020. An installed capacity of 25 GW generates around 100 TWh/year of electricity. In comparison, Norway’s total electricity production is around 130 TWh/year.
Taken together, the four priority areas for development in the North Sea would produce 1.6–3.7 GW. In 2012, 30 wind farms, with a total capacity of 4.6 GW, had been installed and connected to the grid in the whole of the North-East Atlantic (the OSPAR area) (Figure 4.12). A further 61 wind farms had been authorised.
4.4.2 Possible value creation and employment in the future
The consequences of wind power development for employment and the business sector in the 15 areas were assessed in connection with the strategic impact assessment conducted by the Water Resources and Energy Directorate. Value creation was measured in NOK per MW and employment in terms of person-years per MW generated by the development and operation of wind farms over a 25-year period.
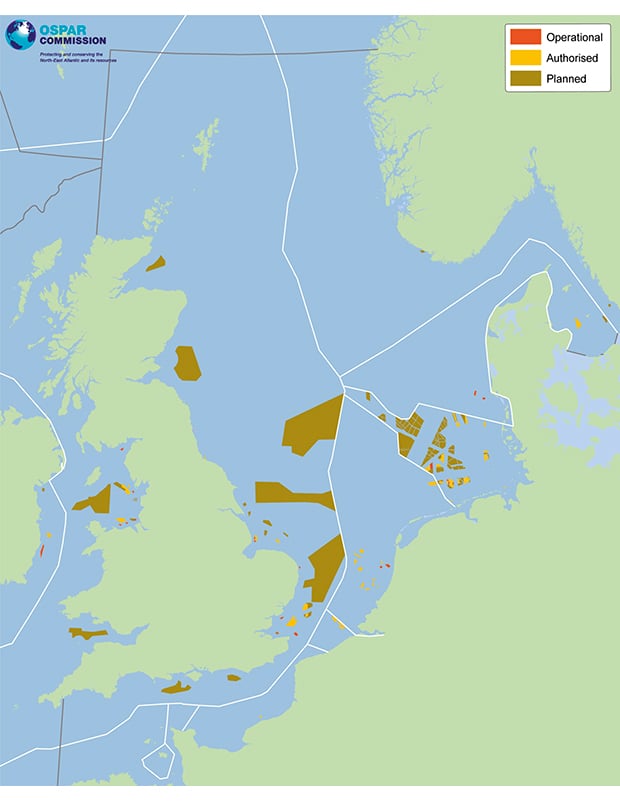
Figure 4.12 Planned, authorised and operational wind farms in the North Sea area.
Source OSPAR database on offshore wind farms
The results showed that large-scale development in areas far from existing onshore infrastructure (ports and the electricity grid) or in deep water have the largest estimated potential for national value creation. In the North Sea this applies particularly to Southern North Sea I and II and Utsira North. For the first of these areas to be developed, the national share of total value creation is estimated at just over NOK 60 million per MW over the full life cycle of the installations, and national employment is estimated at around 50 person-years per MW. In the strategic impact assessment, the Directorate estimated that the average annual number of person-years would be around 150 for the smallest area (Frøyagrunnene) and 900 for the largest area (Southern North Sea II). However, almost 80 % of the labour is expected to be needed during the construction phase. The profitability of these developments for the local business sector will depend on the number of persons employed at the wind farms in relation to the number employed in the adjoining economic region.
4.4.3 Management
National framework
The Act relating to offshore renewable energy production (the Offshore Energy Act) entered into force in 2010. A strategy for offshore renewable energy had been put forward together with the bill (in Proposition No. 107 (2008–2009 to the Storting). The Offshore Energy Act provides a framework for regulating offshore renewable energy production, and as a general rule applies outside the baseline and on the continental shelf, although it may also be made applicable inside the baseline. Under the Offshore Energy Act, offshore renewable energy production may in principle only be established after the public authorities have opened specific geographical areas for licence applications. The Act also stipulates that strategic impact assessments should be conducted under the auspices of the authorities before the decision to open geographical areas is made.
A public consultation on the strategic impact assessment on wind power was held, with a time limit for responses on 4 April 2013. The Government will follow up the assessment with a view to opening areas for licensing. The final decision on which areas are to be opened for licensing is taken by the King in Council. Under the Offshore Energy Act, environmental impact assessments must be conducted in connection with licence applications and when the detailed plans are drawn up. Licence awards and approval of the detailed plans must be based on the findings of the impact assessments and otherwise as far as possible on environmental considerations and other user interests.
International framework
There is no EU legislation that directly regulates matters of central importance for offshore energy. In 2008 the EU Commission presented the plan Offshore Wind Energy: Action needed to deliver on the Energy Policy Objectives for 2020 and beyond. This states that wind energy will play an essential role in meeting the objectives of the new Energy Policy for Europe and that a more strategic and coordinated approach will be important for exploiting Europe’s wind resources. The Renewable Energy Directive (2009/28/EC) set a target of a 20 % share of energy from renewable sources to be reached by 2020.
In September 2012, the Commission presented the Communication Blue Growth as part of the EU Integrated Maritime Policy. The Communication stated that the Commission will assess options for giving industry the confidence to invest in ocean renewable energy, and that the aim is to address ocean renewable energy issues in a Communication in 2013.
EU countries are required by the EIA Directive to conduct environmental impact assessments before developing offshore renewable energy installations. Such activities must also take place within the framework set out in the EU Marine Strategy Framework Directive, the aim of which is to achieve good environmental status for the EU’s marine waters by 2020.
The OSPAR Commission has published Guidance on Environmental Considerations for Offshore Wind Farm Development.
4.5 Travel and tourism and leisure activities
Access to the sea and opportunities to stay by the seaside and enjoy activities such as boating, swimming and fishing are important for a large proportion of the population, and form a basis for the tourist industry. And opportunities to enjoy the seaside are strongly dependent on a clean, rich and productive marine environment – a living sea means a living coast.
4.5.1 Value creation and employment
The sea and coast are very important areas for the travel and tourism industry and for leisure activities in Norway. The coastline bordering the management plan area is very attractive and heavily used by the local population. The coastal and marine environment is important for this sector in a variety of ways: it provides enjoyment, opportunities to engage in a variety of activities, and health benefits. In addition, the coastal and marine environment is an important basis for economic activity in the travel and tourism industry at both local and national levels.
It can sometimes be difficult to draw a line between recreation and commercial activities in analyses of the travel and tourism industry. Travel and tourism and leisure activities are often two sides of the same coin, since a number of tourist activities are based on people’s desire to engage in outdoor recreation and enjoy nature.
According to the tourism satellite accounts from Statistics Norway, the total output of the tourism industry was just over NOK 181 billion in 2009. Provisional figures for 2009 indicate that the industry generated employment of 139 000 person-years, equalling 6.5 % of total employment in mainland Norway.
In the same year, total value added for the tourism industry was estimated at almost NOK 79 billion, or 4.3 % of GDP for mainland Norway. The proportion has been more or less stable since 2003. It is not possible to deduce from the statistics how large a share of the industry is related to the use of coastal and sea areas.
The North Sea–Skagerrak area is very attractive for tourism and recreation. It is difficult to provide a full picture of the value added generated by tourism that is specifically linked to the management plan area, but the following examples indicate the importance of this area for the tourism industry.
Value added and employment in the travel and tourism industry
Statistics Norway’s tourism satellite accounts provide figures for value added in the tourism industry by county. In 2007, the tourism industry in the North Sea and Skagerrak counties provided NOK 25 billion in total value added, NOK 11 billion of which came from hotels and restaurants. However, we have no information on how much of this is generated by the use of coastal and sea areas in the North Sea and Skagerrak.
The satellite accounts show that in 2007 tourism provided 58 000 person-years of employment in the counties bordering on the North Sea and Skagerrak. Of these, 16 800 in the North Sea counties and 12 600 in the Skagerrak counties were employed in hotels and restaurants.
Production in the hotel and restaurant sector
The tourism satellite accounts also provide figures for production by county and for hotels and restaurants, transport, and culture and entertainment. However, we have no information on how much of this is related to the areas closest to the coastline.
Figures for 2007 show that hotels and restaurants generated around NOK 13 billion in the North Sea counties and around NOK 8 billion in the Skagerrak counties.
Calculations show that in the coastal municipalities in the management plan area, 25 % of sales in the hotels and restaurant sector were made within the 100-metre belt along the shoreline.
Projected figures for 2030
The tourism industry is one of the world’s fastest growing industries, and the aim is to ensure that the Norwegian tourism industry has a share in this growth. The Government’s 2012 tourism strategy Destination Norway sets out three goals for the industry:
higher value creation and productivity,
a larger number of year-round jobs and more robust businesses, especially in rural districts,
more unrivalled attractions that draw visitors with a high willingness to pay.
The Government is giving explicit priority to the tourism industry. The strategy sets out three priority areas for the Government’s future efforts in this field:
organisation,
development of tourist attractions and destinations,
sales and marketing.
4.5.2 Leisure activities along the coast
The coastline of the North Sea and Skagerrak provides opportunities for a wide range of leisure activities and recreational interests. More than 80 000 holiday cabins in the counties bordering on the management plan area are situated less than 1 km from the shoreline. Around 50 000 are in the Skagerrak counties from Østfold to Vest-Agder, while the remaining 30 000 or so are situated in the three North Sea counties.
The proportion of holiday cabins within 1 km of the shoreline for each of the Skagerrak counties is 93 % in Østfold, 91 % in Vestfold, 85 % in Telemark, 95 % in Aust-Agder and 74 % in Vest-Agder.
Table 4.3 Number of holiday cabins by distance from the shoreline for the coastal municipalities in the management plan area and the inner Oslofjord.
County | 0–100 m | 100–500 m | 500–1 000 m | Over 1 000 m | Total | Sum 0–1 000 m |
|---|---|---|---|---|---|---|
Østfold | 6 245 | 7 274 | 989 | 1 166 | 15 674 | 14 508 |
Vestfold | 5 407 | 5 533 | 939 | 1 110 | 12 989 | 11 879 |
Telemark | 4 372 | 1 973 | 301 | 1 200 | 7 846 | 6 646 |
Aust-Agder | 4 749 | 2 258 | 142 | 367 | 7 516 | 7 149 |
Vest-Agder | 5 459 | 2 357 | 432 | 2 845 | 11 093 | 8 248 |
Rogaland | 6 309 | 4 225 | 907 | 5 436 | 16 877 | 11 441 |
Hordaland | 11 551 | 5 464 | 947 | 10 997 | 28 959 | 17 962 |
Sogn og Fjordane | 2 945 | 1 275 | 338 | 5 398 | 9 956 | 4 558 |
Akershus | 2 199 | 3 623 | 878 | 1 646 | 8 346 | 6 700 |
Oslo | 623 | 22 | 3 | 1 650 | 2 298 | 648 |
Buskerud | 1 312 | 1 662 | 285 | 1 163 | 4 422 | 3 259 |
Source Statistics Norway
The table shows that over 42 % of all holiday cabins in the coastal municipalities are situated within the 100 m belt along the shoreline, and around 70 % within 500 m of the shoreline.
«Blue parks» – outdoor recreation and marine protected areas
Ytre Hvaler national park was established in 2009 and covers an area of 354 km2, of which only 14 km2 is land and the rest is sea and seabed. This means that a unique marine area is protected from activities that could impair its environmental value, such as development and large-scale commercial activities. At the same time, this maintains very favourable conditions for outdoor recreation. Ytre Hvaler is Norway’s first «blue» national park. Other marine areas have been protected together with adjoining areas on land, for example around Svalbard and Jan Mayen.
Textbox 4.3 Recreation days in holiday cabins and contribution to value creation in the management plan area
In all, there are around 80 000 cabins within 1 km of the shoreline in the coastal municipalities bordering on the management plan area. Figures from earlier work by the Institute of Transport Economics indicate that these cabins are likely to be in use for roughly 8–12 million days a year. This can be used as an estimate of recreation days in the area.
The figures can be split between the North Sea counties, with an estimated 3–5 million recreation days a year, and the Skagerrak counties, with an estimated 5–7 million. The Institute of Transport Economics has estimated consumption per cabin user per day at around NOK 225. This includes food and beverage services, transport, petrol and other car-related expenses, supplies, activities and other expenses, but not maintenance or building work.
Using this as a basis, total consumption for all recreation days at holiday cabins in the management plan area is estimated at around NOK 1.8–2.7 billion a year. However, there may be an overlap between permanent residents and cabin users in these calculations.
Efforts to safeguard important marine areas and their species and habitat diversity for the future have been in progress for a long time under the national marine protection plan. In 2004 a broad-based advisory committee identified 36 important marine areas along the coast, which are being evaluated as part of these efforts. Work on the marine protection plan will be continued. A public consultation on draft Regulations relating to the protection of three marine protected areas under section 39 of the Nature Diversity Act (Saltstraumen in Nordland, Tautraryggen in Nord-Trøndelag and Framvaren in Vest-Agder) was begun in January 2013, with a view to their adoption in summer 2013. The Saltstraumen maelstrom is the world’s strongest tidal current, while Tautraryggen is an example of Norway’s unique cold-water coral reef complexes. Framvaren is known to researchers worldwide because of the highly unusual chemical conditions, which make it a natural historical archive that goes back several thousand years.
Fishing tourism
Recreational fishing has a long history in Norway, and in the last few decades it has become commercialised. A number of studies have been made to determine the extent of sea fishing tourism, and in 2010, 80 foreign travel and booking agents were found to have offered stays at tourist facilities for sea fishing, which means that the numbers have doubled in the last 10 years. The number does not include rental agents hiring out premises that are suitable for fishing, or private lets.
In 2005 the Institute of Transport Economics estimated the total number of tourists engaged in sea fishing who had travelled to Norway by car at 274 500. The study did not include tourists who came by bus or plane.
There are a number of different estimates of the economic value of sea fishing tourism in Norway. The most comprehensive survey was published in 2002, using figures from 1999/2000. On the basis of figures from over 900 enterprises, it was estimated that fishing tourism brought in NOK 2.2–2.4 billion a year. The counties bordering on the management plan area accounted for 46 % of this, amounting to around NOK 1 billion a year, or NOK 1.3 billion at the 2011 monetary value. A more recent study by NORUT Northern Research Institute showed that direct revenues from overnight accommodation and boat hire offered by a selection of fishing tourism enterprises amounted to NOK 220 million, almost NOK 80 million of which came from enterprises in Southern and Western Norway. The figures do not include spin-off effects, activities based on rentals by private citizens, which is a widespread practice in Southern Norway, or investments in facilities and equipment at the national level.
4.6 Other possible future industries
4.6.1 Marine bioprospecting
Bioprospecting can be described as a systematic and targeted search for components, bioactive compounds and genetic material in organisms for commercial exploitation. These organisms can be found on land, in the sea, on the seabed and in oil reservoirs under the seabed. They include all types of organisms – microorganisms such as bacteria, fungi and viruses and larger organisms such as plants, shellfish and fish.
In spite of the fact that the sea covers more than 70 % of the earth’s surface, and that evolution in the marine environment began several million years before evolution on land, little research has been done on marine biodiversity. Many marine organisms are likely to have properties that can be exploited and used in the manufacture of new products and processes in a number of industrial sectors. Marine bioprospecting therefore has a potential for value creation, and Norway is considered to be in a good position to make its mark internationally in this field.
The Government has defined marine bioprospecting as a priority area, and substantial funds are being channelled into incentives for R&D. The aim is to activate the entire range of value creation potential opened up by marine bioprospecting.
A public consultation on draft Regulations relating to the collection and utilisation of genetic resources (the Bioprospecting Regulations) was started in December 2012, with a time limit for responses of 5 April 2013.
4.6.2 Mineral extraction
At present, there is no mineral extraction from the seabed in the North Sea and Skagerrak or in other Norwegian sea areas. There has been little exploration of the seabed in the management plan area, and it is therefore possible that seabed mineral potential will be discovered. Better mapping and the development of new technology may lead to value creation from seabed mineral deposits.
We have good data from the 1990s on the sand and gravel deposits on the seabed of the Skagerrak. Mapping of this sea area has shown that the areas with most potential for mineral extraction are deposits of sand and gravel at depths of less than 150 m on the North Sea Plateau and the southern and western slopes of the Norwegian Trench. A belt of sand and gravel up to 40 cm thick extends for more than 50 km along the eastern edge of the North Sea Plateau. In some areas with strong bottom currents the sand is moved along the seabed, and in some places even gravel may be moved. There are also deposits closer to the Norwegian coast, both beyond and inside the baseline. These are mainly moraines, for example in the Jomfruland area. Although number of countries around the North Sea extract sand and gravel from the seabed, this is not done in Norwegian waters. In the longer term, Norway’s sand and gravel have potential economic value. Shell sand would be a valuable resource in the coastal zone, where there are deposits between islands and skerries in sounds with strong currents and in wave-exposed areas. There is some small-scale extraction in Aust- and Vest-Agder and along the coast of Western Norway.