3 Status of Norwegian nature
3.1 General information about Norwegian nature
Norway is an elongated country with rich and varied nature. Norway spans areas from the open oceans to mountains, with variations from warm low-lying areas in the south to cold areas in the high mountains in the north and on Svalbard. The varied topography and geology also create variations in nature. The great variations seen across short distances are rare from a global perspective. Norway has 26 geographical vegetation regions. In comparison, Denmark has 2, Finland has 10 and Sweden has 17 such regions. Within each geographical vegetation region, major variations in soil, terrain and local climate may determine where different species become established. The cold climate in the north is demanding and the species that are found here adapt well to low temperatures and a short growing season.
Globally, as a rule, more species can be found the closer you get to the equator. Nevertheless, there is a relatively high diversity of species in the low-lying regions of Norway, and during seasonal bird and fish migration, very high levels of certain species can be observed in Norwegian regions. Many species thrive in the warm, nutrient-rich regions in the lowlands and many rare and endangered species and habitat types are largely concentrated around the Oslo Fjord region, along the coast of Southern Norway and, to some extent, Western Norway, as well as the regions around the Trondheim Fjord. These areas have a climate and soil conditions that are attractive for both biodiversity and human settlement. There is therefore a relatively large concurrence between regions with a large proportion of rare and endangered species and habitat types and population density in Norway, see Figure 3.1.
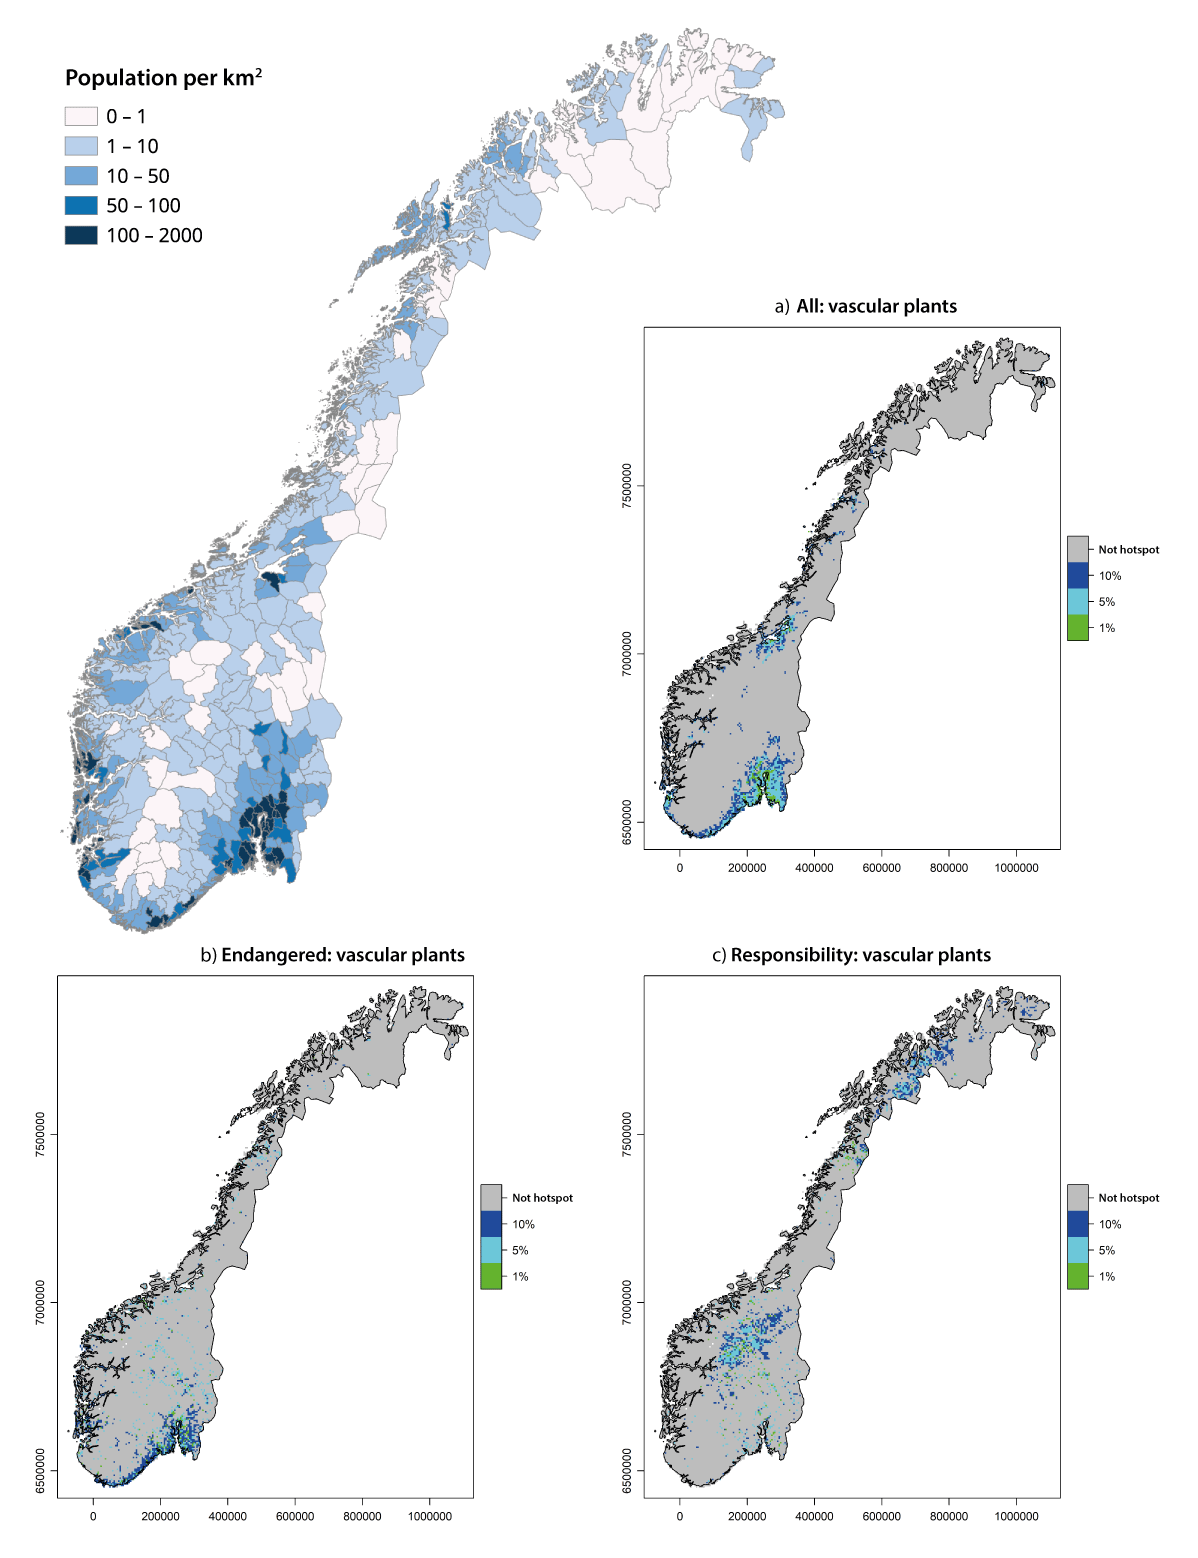
Figure 3.1 Population density in Norway and distribution of vascular plants
Population density in Norway (left) compared with the distribution of key habitats, or hotspots, for Norwegian vascular plants (right): areas where, based on natural conditions, one would expect to find the greatest occurrence of all vascular plants (A), endangered species of vascular plants (B) and endangered species of national responsibility of vascular plants (C). Vascular plants refer to all plants except moss and green algae, 1795 species were included in this analysis.
Source: Statistics Norway, with data from Table 11342 and map data from geonorge.no and Olsen et al. (2022)
It is believed that there are about 72,000 species in Norway (excluding bacteria and viruses). Around 47,000 species have been identified, while approximately 25,000 species are unknown. Most known species live on land (34,237 species, or 73 per cent), followed by species in salt water (8298 species, or 19 per cent) and in fresh water (4356 species, or 9 per cent). The most species-rich group of species is insects, which consist of both the most known and likely the most undiscovered species. Fungi, vascular plants and lichen are other groups that are rich in species. The diversity of unknown species in these groups is also significant. Six to ten per cent of the world’s moss and lichen species live in Norway, and 55 out of 58 European peat moss species. Norway also has 14 per cent of all hop species worldwide.
Norway has 976 species defined as national responsibility species1 and Norway has a special responsibility to conserve these species. Some responsibility species are abundant in Norway but rare elsewhere in Europe, such as the lemming and dwarf birch. The Norwegian Biodiversity Information Centre estimates that Norway has 282 endangered species that are also defined as national responsibility species. Of the endangered species, the majority are vascular plants but there are also several endangered national responsibility species within the groups of moss, lichen, fungi and flies. The endangered national responsibility species are primarily found in the mountains in Southern Norway and the hinterlands of Northern Norway and Troms (for an overview of endangered national responsibility species that are vascular plants, see Figure 3.1, c). There is no corresponding list of responsibility habitat types. Nevertheless, the Bern Convention has identified biotopes that Norway has a special responsibility to conserve, such as raised bogs, peat bogs, floodplain forests, delta and caves.
The Norwegian Red List of Ecosystems and Habitat Types from 2018 and the Norwegian Red List of Species from 2021 provide an overview of the risk of biotopes and species becoming extinct in Norway.
As part of the work on the Red List of Species in 2021, a total of 23,405 species were assessed. Of these, 4957, i.e. 21 per cent, were added to the Red List. This means that they are classified as Regionally Extinct (RE), Critically Endangered (CR), Endangered (EN), Vulnerable (VU), Near-Threatened (NT) or Data Deficient (DD). Of these species, 72 per cent (3565) are also experiencing ongoing population decline, with the majority experiencing a decrease of more than 30 per cent, see Figure 6.7.2 The remaining 18,448 species (78.8 per cent) are considered Least Concern (LC) and have not been added to the Red List. Species classified as Critically Endangered, Endangered or Vulnerable are collectively referred to as endangered species. These species are at high to extremely high risk of extinction in Norway if prevailing conditions continue. Of the species on the Red List, 2752 are classified as endangered. This constitutes 11.8 per cent of the assessed species. Separate assessments have been conducted for vascular plants, freshwater fish, birds, lichen, mammals and springtails on Svalbard. A total of 541 species have been assessed on Svalbard as of 2021. The Svalbard Red List of Species includes 116 species, which equates to 21.4 per cent of all assessed species.
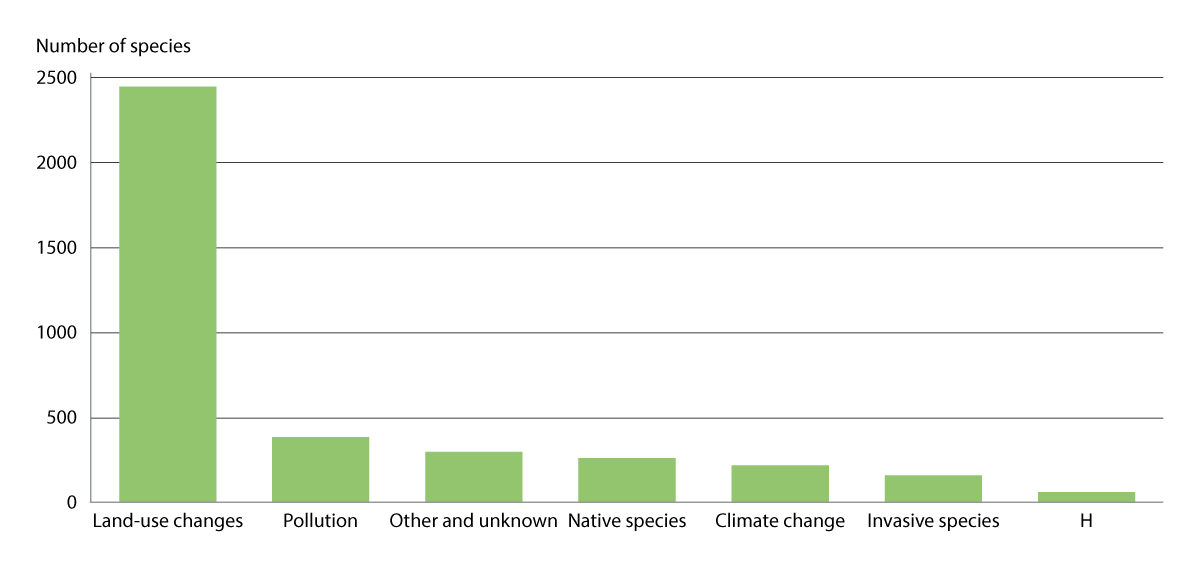
Figure 3.2 Negative impacts on endangered species
Impact factors on endangered species in mainland Norway with ocean regions sorted by the number of impacted species. «Other and unknown» includes completely unknown factors, random mortality, natural disasters, human disruption, impact outside of Norway and other factors that cannot be classified under the other main levels.
Source: The Norwegian Biodiversity Information Centre (2021)
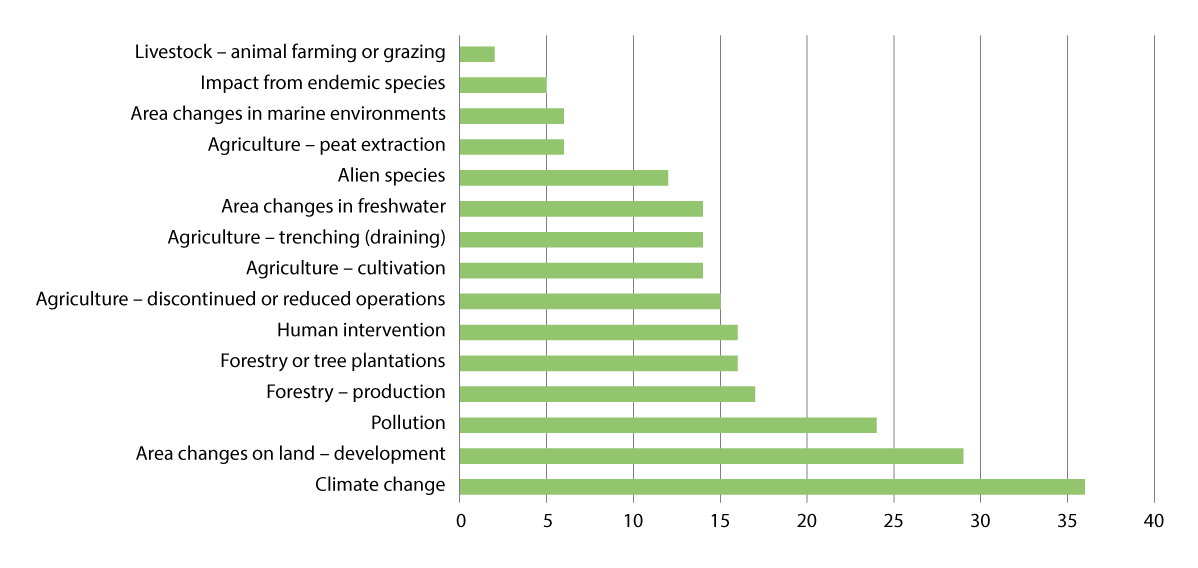
Figure 3.3 Drivers of change on endangered and near-threatened habitat types
Impact factors on endangered and near-threatened habitat types with an overview of how many habitat types are impacted by the different factors. Some habitat types are impacted by multiple factors. Overall, various changes in land and ocean use, including agricultural changes, are the largest impact factors, followed by climate changes. Bottom trawling is included in the «Habitat impact in marine environments» classification. More biotopes have been assessed on land than in the oceans.
Source: Ministry of Climate and Environment with data from the Norwegian Biodiversity Information Centre and based on Figure 2 of the Norwegian Biodiversity Information Centre (2018).
Textbox 3.1 Knowledge of the state of nature
Assessment system for ecological condition: The assessment system for ecological condition was designed by an expert committee appointed by the Ministry of Climate and Environment and was used for the first time in 2020. Parts of the scientific system are still in development. So far, the ecological condition of mountains, forests, Arctic tundra and oceans has been assessed for the first time using the scientific system and the experiences from this work can contribute to improving the system. In the scientific system, ecosystems are considered intact when they are not significantly affected by post-industrial or transformative human impact without the aim being to achieve a natural state. In the cultural landscape, nature takes shape through interactions between species and the use of land and marine areas, and separate criteria have therefore been designed in the scientific system to describe good condition subject to human impact. The system does not cover waterways and coastal regions, as Norway has, for a long time, had a separate classification system for aquatic environments that is harmonised with other countries that implement the EU Water Directive. The Ministry of Climate and Environment has initiated an evaluation of the scientific system for ecological condition.
The Norwegian Nature Index: The nature index shows the condition and development of biodiversity with an emphasis on the population trend in species. The nature index summarises the condition and development of biodiversity in seven major ecosystems: oceans, coastal regions, freshwater, wetlands, forests, mountains and open lowlands. The nature index also helps identify key knowledge needs to ensure improved monitoring of Norwegian nature. The index shows the condition of biodiversity in an ecosystem using a value between 0 and 1 based on different indicators. The reference state is the value of the indicator in a virtually natural state without human impacts and is shown using the value 1. For cultivated landscapes, shaped through long-term traditional human impact, the reference state is defined based on a fertile ecosystem with minimal levels of other types of human impact. The 2020 nature index summarises information about 260 indicators facilitated by experts from specialist institutions in Norway and has been calculated for the years 1990, 2000, 2010, 2014 and 2019. In the scientific system for ecological condition, the nature index is used as an indicator for assessing biodiversity, one of the seven unique characteristics of the ecosystem. The integrity of an ecosystem is the weighted average of scaled indicators representing the biodiversity in the ecosystem in question. The nature index is therefore not suitable for comparing condition and trends between different ecosystems.
The Norwegian Water Regulation: According to the classification system provided by the Norwegian Water Regulation, all fresh water and coastal water must be placed in an ecological and chemical status-class. This makes it possible to compare status and trends in Norwegian aquatic environments. Ecological status is based on parameters within biological, physical-chemical and hydromorphological quality elements. The classification thresholds for some of the parameters have been derived from an inter-calibration effort in Europe, as part of which countries with similar water types have agreed on harmonised classification thresholds. Chemical integrity is determined based on the concentration of substances defined as prioritised in the Norwegian Water Regulation. The classification is performed by comparing the measured values in the environment with the threshold values, also referred to as the environmental quality standard (EQS).
In addition to the above, there are also many other sources of knowledge about nature.
In the Norwegian Red List of Ecosystems and Habitat Types from 2018, 258 habitat types were assessed. Of these, 123 have been added to the Red List (corresponding to 48 per cent) and 74 (corresponding to around 29 per cent) are considered endangered. No habitat types in mainland Norway with ocean regions or on Svalbard have been lost in the past 50 years.
Norwegian nature consists of a mosaic of small and large instances of habitat types and species that combine to form ecosystems. The state of nature in Norway is, in many areas, better than in many other countries, but there are significant challenges here too.
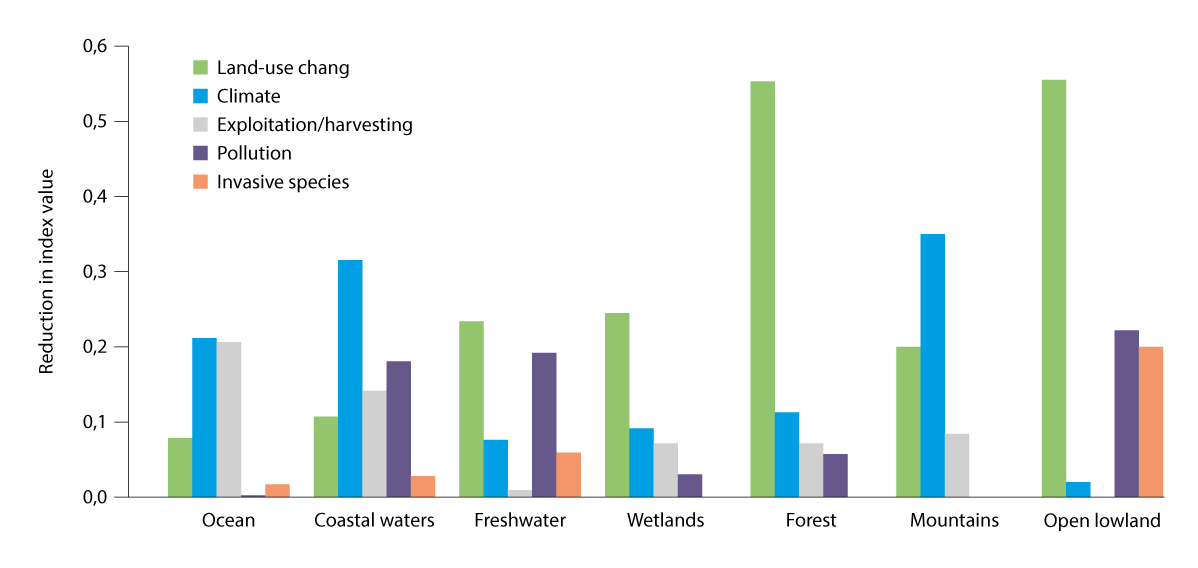
Figure 3.4 Drivers of change on ecosystems based on the nature index
Effect of the five main drivers on the nature index value for each ecosystem. A high value/column means that the driver has a major negative effect on the nature index value for the ecosystem in question. The effect of the drivers cannot be aggregated, as many indicators are sensitive to various drivers.
Source: Nature index (undated)
According to the Norwegian Red List of Species (2021) and Ecosystems and Habitat Types (2018), changes in land and ocean use constitute the greatest threat to both species and habitat, see Figures 3.2 and 3.3.3 Changes in land and ocean use affect nine in ten endangered species, including through development projects that contribute to loss of land, forestry and discontinuation of agricultural activities. Development projects that contribute to loss of natural land have been addressed in further detail in Chapter 5.4. As is also the case globally, other important impact factors include alien species, climate change, pollution and over-harvesting. Climate change is already having a negative impact on ecosystems and its importance will increase in the future. In the oceans, harvesting is a particularly important impact factor alongside climate change, see Figure 3.4. Condition and drivers vary between ecosystems and this chapter provides an overview of the status of the different major ecosystems.
3.2 Review of the integrity and impacts on the major ecosystems
3.2.1 Oceans and coasts
Norwegian sea areas comprise more than six times the area of the mainland, and the Norwegian coastline exceeds 100,000 kilometres, including islands, skerries and islets. This is equivalent to 2.5 times the circumference of the Earth at the equator. The coastal waters within the baseline (i.e. internal waters) comprise an area of almost 90,000 km2. The nearshore area extends to one nautical mile outside the baseline. The major ecosystem of «oceans and coasts» comprises coastal waters and the parts of the Barents Sea, Norwegian Sea, North Sea and Skagerrak, that are under Norwegian jurisdiction, as well as the land-water interface along the coast of mainland Norway and Svalbard. The northern parts of the Barents Sea and Norwegian Sea are considered part of the polar ecosystem, addressed in Chapter 3.2.7.
The coastal waters of Norway embody great variations in environmental conditions, with regard to depth and light conditions, terrain, substrate types, exposure to waves and currents, salinity and ice conditions. This results in different types of seabed and waterbodies along the coast. Seaweed communities, kelp forests, tidal water meadows and swamps and seagrass meadows form «blue forests», primarily in coastal waters. These areas are important to biodiversity, key primary producers and as food sources for a number of important species such as cod, pollock and crabs. Furthermore, the blue forests help bind and store carbon, purify water, attenuate waves and reduce erosion. In the oceans, sessile animals such as mussels and several coral species also form their own biotopes. Animal dominated communities are also key areas for biodiversity and provide a number of important ecosystem services such as food and raw material production and carbon binding and storage.
Ecosystem condition
The Norwegian Water Regulations applies to coastal waters. Of natural water bodies, 86 per cent of coastal waters have good or very good integrity according to the Water Regulations. If you include heavily modified bodies of water (see Chapter 3.2.2) the figure is 84 per cent. The quality elements under the Water Regulations were primarily developed to provide an indication of the impact of eutrophication and, to some extent, organic loading, sedimentation, chemical pollution and physical modification. However, the quality elements are not currently very well suited for providing an indication of the ecological status in coastal waters with regard to biodiversity. As noted in White paper no. 21 (2023–2024) Norway’s Integrated Ocean Management Plans, the Government will consider whether additional levels of biodiversity should be included as quality elements for coastal waters under The Norwegian Water Regulations.
The Norwegian nature index shows for coastal waters has been stable since 1990, with a weak negative trend over the past five years. The value at the latest assessment in 2019 was 0.67.
With regards to oceans, the scientific system for ecological condition shows that the Norwegian Sea and the Barents Sea only to a limited extent are affected by human activity. The ecosystem in the North Sea and Skagerrak is significantly impacted by human activity.
In the Barents Sea, climate and physical environment are significantly impacted by man-made drivers, which is evident from increased temperatures and reduced sea ice coverage. Based on available data, there is evidence to support that human impact on the Arctic ecosystem in the northern part of the Barents Sea is limited. In the southern, sub-Arctic and ice-free part of the Barents Sea, no significant changes to ecological integrity have been documented. At the same time, there is significant uncertainty linked to the conclusions, due to the short time series for the biological indicators. Temperatures are expected to continue to increase in the area, and this will result in the observation of substantial changes to biological indicators in the future.
In the Norwegian Sea, the status is good, with limited man-made impacts on the ecosystem, but the ecological condition status of this sea area has only been assessed for one of the eleven identified ecosystem types. There is limited or no monitoring data available for the other parts of the Norwegian Sea. There has been an increase in temperatures and signs of ocean acidification, as well as a decline in the population of mackerel and Norwegian spring-spawning herring due to the recommended quotas being exceeded, and there has also been a decline in the population of seabirds.
Ecosystems in the Norwegian sector of the North Sea and Skagerrak are significantly impacted by human activity. Here, the condition is no longer good, and an overall assessment of the ecological condition shows significant deviations from the reference state. The North Sea and Skagerrak are particularly affected by climate change and fisheries, leading to changes to key groups of zooplankton, fish populations, shrimp and bottom habitats. Bottom trawling has resulted in a large proportion of the seabed and benthic fauna being impacted. Increased temperatures have resulted in a decline in key zooplankton species, which in turn has resulted in failed recruitment on the part of key species such as cod and herring.
The condition of the Norwegian sea areas has been addressed in further detail in Report to the Storting no. 21 (2023–2024) Norway’s Integrated Ocean Management Plans.
In 2019, Norwegian sea areas had a combined nature index of 0.70. The value was relatively consistent for all ocean regions with the exception of Skagerrak, where it was 0.6. The nature index for oceans has varied somewhat over the past 30 years, with positive trends from 1990 to 2010, while there has been a slight negative trend over the past decade. Overall, the trends in the nature index were positive over the 1990–2019 period. The trends look relatively similar across the sea areas, with the exception of the North Sea. Large natural environmental and population variations in highly managed populations combined with relatively limited data make it difficult to distinguish clear trends for biodiversity as a whole.
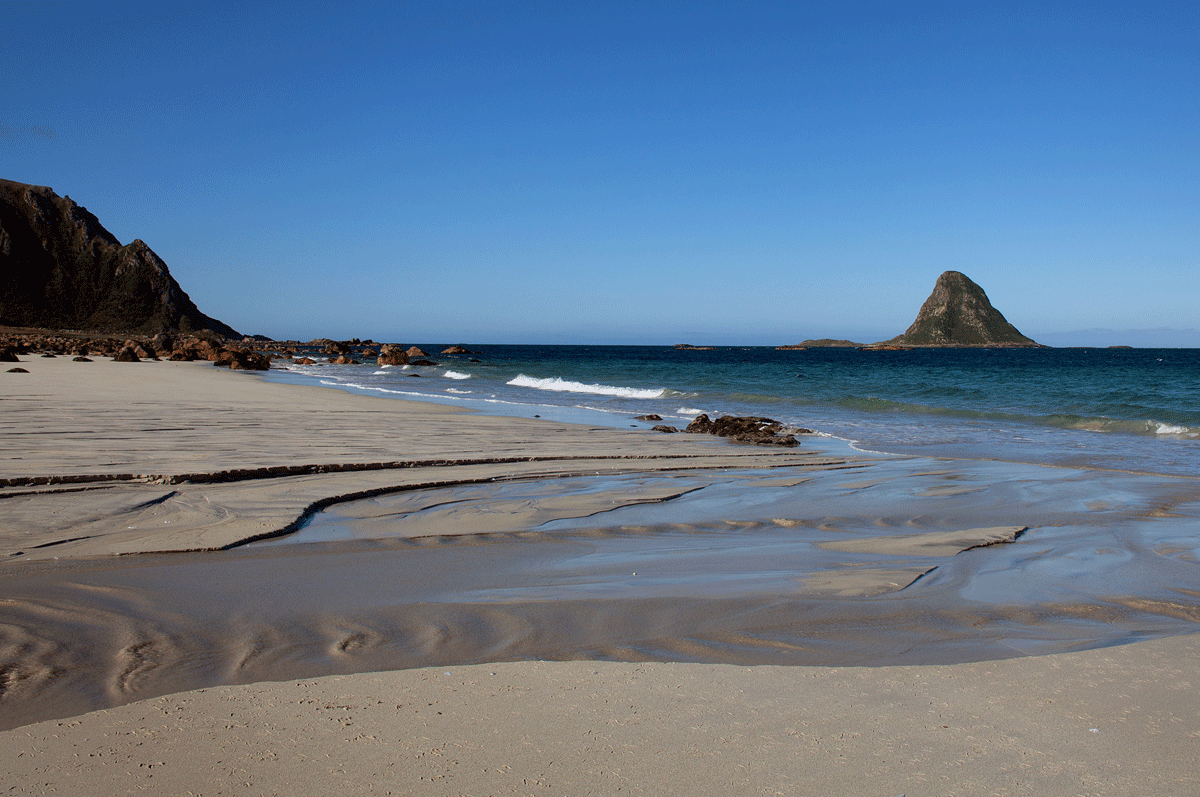
Figure 3.5 Ocean and coastal ecosystem
Bleik island near Andøya.
Photo: ©Anne Elisabeth Scheen
Endangered species and habitat types
There has been a clear negative trend for endangered marine species and biotopes in the red lists for species and biotopes, with a real exacerbation of the situation for 21 per cent of the species and biotopes. Loss of habitats is one cause of decline for many species, such as species that are dependent on sea ice. A number of species of seabirds, aquatic mammals, cartilaginous fish and benthic fauna are red-listed, and the trend is most negative for seabirds. The number of Norwegian seabirds is estimated to have decreased by 80 per cent during the 1970–2020 period. Of the typical seabird species, 63 per cent are on the red list. For aquatic mammals, narwhals and bowhead whales are experiencing a positive trend, while grey seals, bearded seals and harbour seals are experiencing a negative trend. For fish, there is a positive trend for Norwegian haddock, spiny dogfish and Atlantic bluefin tuna, while there is a negative trend for Arctic cod, common Norwegian haddock and lampreys, etc. For marine areas, 11 of the 15 assessed biotopes are on the red list. Kelp forests in Northern Norway are red-listed due to grazing sea urchins, while sugar kelp forests in Southern Norway are red-listed due to eutrophication and global warming.
Drivers of change
The climate and various human activities affect the condition of Norwegian ocean and coastal regions. Climate change shows impact through raised temperatures and ocean acidification in several regions, decreased sea ice in the Arctic parts of the Barents Sea and clouding of the water, particularly in the North Sea and Skagerrak. Along the coast, more and heavier rainfall is resulting in increased run-off from soil and rock, which accelerates the transport of nutrients and particles into the sea. The main sources of the discharge of nutrients to the marine environment are aquaculture, agriculture, wastewater, industry and background run-off. Aquaculture affects coastal waters, including through the discharge of nutrients, particulate organic matter, pharmaceutical products/delousing agents and copper, as well as the use of wild-caught cleaner fish. This can have an impact on the ecosystem around the facilities.
The most important maritime sectors are fishing, oil and gas and shipping. In future, new industries such as offshore aquaculture, offshore wind, transport and storage of CO2 and mining in the seabed will also constitute relevant impacts. Tourism and recreation, as well as the research and defence sector, also use ocean and coastal space. The impacts take the form of fishing and harvesting, pollution including underwater noise, alien species and physical disruptions. Work is ongoing to analyse the overall impact on marine life.
3.2.2 Rivers and lakes
The major ecosystem rivers and lakes comprises all freshwater in Norway. That is rivers, lakes, streams, dams, groundwater and brackish water. There are more than 23,000 rivers and over 6800 lakes in Norway. In total, these account for around 6.2 per cent of mainland Norway. The integrated management of bodies of water is outlined by the Water Regulation.
Textbox 3.2 Water management plans
In accordance with the Water Regulations, water management plans are drawn up for freshwater, coastal water and ground water in all water regions. Regional water management plans are one of the most important tools to fulfil the Water Regulations’ objectives of integral protection and sustainable use of water. The regional water management plans and associated action programmes will be updated every six years and reported on in line with the EU member states’ implementation of the Water Framework Directive. The management plans describe the environmental targets that must be met in water bodies. The action programme sets out the actions required to achieve the targets.
Water management plans are regional plans under the Planning and Building Act and are drawn up and adopted by the regional authorities as the regional planning authorities. The plans, including environmental targets for land and water use and action programmes, will form the basis for the regional agencies’ activities, as well as local and central activities and planning in the regions.
The current regional water management plans were approved by the Government in 2022 and apply to the 2022–2027 period. The current plans include more than 12,000 actions and measures in Norwegian rivers, lakes and coastal waters. Most measures relate to agriculture, wastewater, hydropower and restoration, acidic precipitation and environmental pollutants.
Ecosystem condition
Of Norway’s natural bodies of water in rivers and lakes, 75 per cent are of good or very good ecological status, corresponding to 82 per cent of the total length of Norwegian rivers and 76 per cent of the area of lakes as of May 2023.4 This does not include heavily modified bodies of water. If we include heavily modified bodies of water, for which the target is good ecological potential, the environmental targets are met for 71 per cent of the bodies of water. Highly modified bodies of water refer to surface water that has undergone physical or hydrological changes as a result of activities of public utility, such as hydropower and transportation facilities.
The Norwegian nature index shows that freshwater had a value of 0.74 in 2019. The status in Northern Norway is slightly higher than in other parts of the country. The status is lower in Southern Norway and parts of Western Norway due to extensive, long-term acidification, while parts of Eastern Norway, Western Norway and Central Norway have, among other things, excessive levels of nutrients released from wastewater and agriculture. Many water systems in all regions are impacted by hydropower developments, especially in Western Norway and Northern Norway.
Since 1990, a number of actions have been initiated to improve status in freshwater, such as liming of water systems, actions to limit emissions from agriculture and the wastewater sector and physical restoration actions to improve migration and restore habitats. Nevertheless, the nature index shows a stable trend in the freshwater ecosystem from 1990 to today. Similar trends can be seen throughout the country, which could indicate that the positive impact of the initiated actions has been counterbalanced by different negative impacts. For example, the acidification of water and waterways has been reduced, but there are still challenges associated with increased over-fertilisation from agriculture in several places. Climate change may lead to increased run-off of nutrients from agriculture in future.
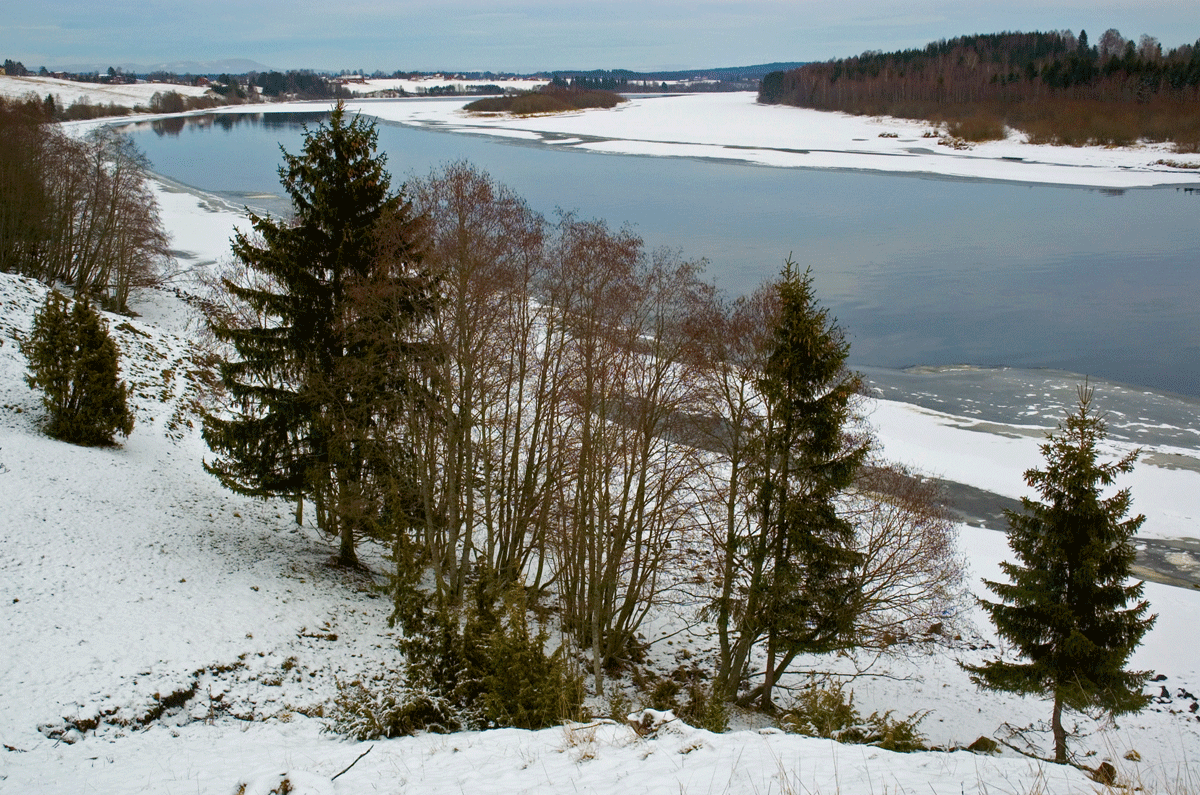
Figure 3.6 Rivers and lakes ecosystem
The Glomma, Norway’s longest river, is partially ice-free in winter.
Photo: Bård Bredesen
Endangered species and habitat types
The Norwegian Red List for Ecosystems and Habitat Types includes six habitat types in freshwater and seven landscape types that are closely linked to freshwater that are endangered or near-threatened, deep, humic lakes, for example, are endangered. Several of these, as well as several other habitat types, have been identified as especially important habitats for endangered or near-threatened species or as areas with a high species diversity.
There are several freshwater species on the Norwegian Red List for Species (2021). A total of 32 per cent (330 species) of the assessed species for which freshwater is the main habitat have been classified as endangered. Among the endangered species, sea lamprey and salmon are classified as near-threatened, Arctic lamprey and freshwater pearl mussels are classified as vulnerable, and the European eel and true glass snails are classified as endangered. Plenty of research focuses on salmon and other salmonids and the most extensive knowledge platform therefore relates to wild salmon. A number of endangered species and habitat types are dependent on water systems even though freshwater does not constitute the main habitat for the species, or the habitat type is covered by water for less than 50 per cent of the time. This includes riverbank species and habitats, which are dependent on an ecological function from the water system, such as rapids or regular flooding. According to the Norwegian Water Regulation, these are included as supporting elements in the classification of water bodies.
Several of the freshwater habitat types are key areas for reproduction for migratory species and are therefore essential to the survival of the species. This applies, for example, to several fish and amphibian species that require connected areas to complete their life cycle. Vulnerable freshwater habitats have been mapped only to a limited extent and there is a need for further knowledge. A change is being made to the way freshwater habitat types are mapped by the Nature in Norway5 project and this is expected to affect the next update to the Norwegian Red List for Ecosystems and Habitat Types.
Drivers of change
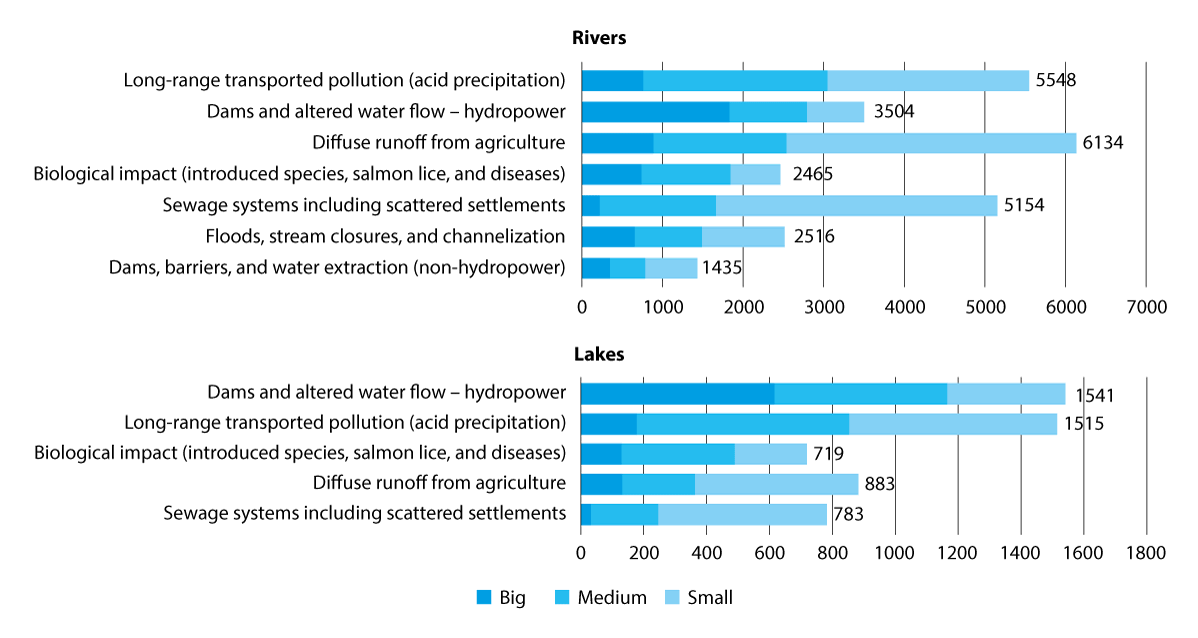
Figure 3.7 Major drivers of change in bodies of water
The number of bodies of water and key drivers of change in aquatic environments in Norwegian rivers and lakes. Drivers are ranked by order of greatest impact. Moderate or high impacts are considered to result in degradation of environmental integrity.
Source: The Norwegian Environment Agency with data from VannNett Portal (vann-nett.no) as of August 2024
Textbox 3.3 Wild salmon
The Norwegian Scientific Advisory Committee for Atlantic Salmon (VRL) is an independent committee appointed by the Norwegian Environment Agency. VRL prepares an annual report on the status and development of Norwegian wild salmon populations. According to the latest VRL report, the number of salmon returning from the oceans to Norway to spawn in 2022 was among the lowest number ever recorded. VRL is also responsible for the classification of salmon in accordance with the quality standard. The classification takes place every five years and two classification rounds have taken place so far. The last classification from 2021 showed that 18 per cent of salmon populations had good or very good status, 30 per cent had moderate status, 11 per cent had poor status and 41 per cent had very poor status. Most populations are adversely affected by escaped farmed salmon and salmon lice, followed by hydropower developments and interventions in water systems. Two thirds of the populations did not achieve adequate quality based on the sub-standard for genetic integrity. The impact from aquaculture appears to be the most severe for both salmon and sea trout. This is because the impact rate is significant, persistent and, in some areas, increasing with a risk of further harm from salmon lice, escaped farmed salmon or infections in wild populations. These drivers are examples of harm occurring in freshwater even though the impact itself takes place in the marine environment. Other drivers have been heavily reduced or have a decreasing impact. This includes acidic precipitation, the Gyrodactylus salaris salmon parasite and overfishing.
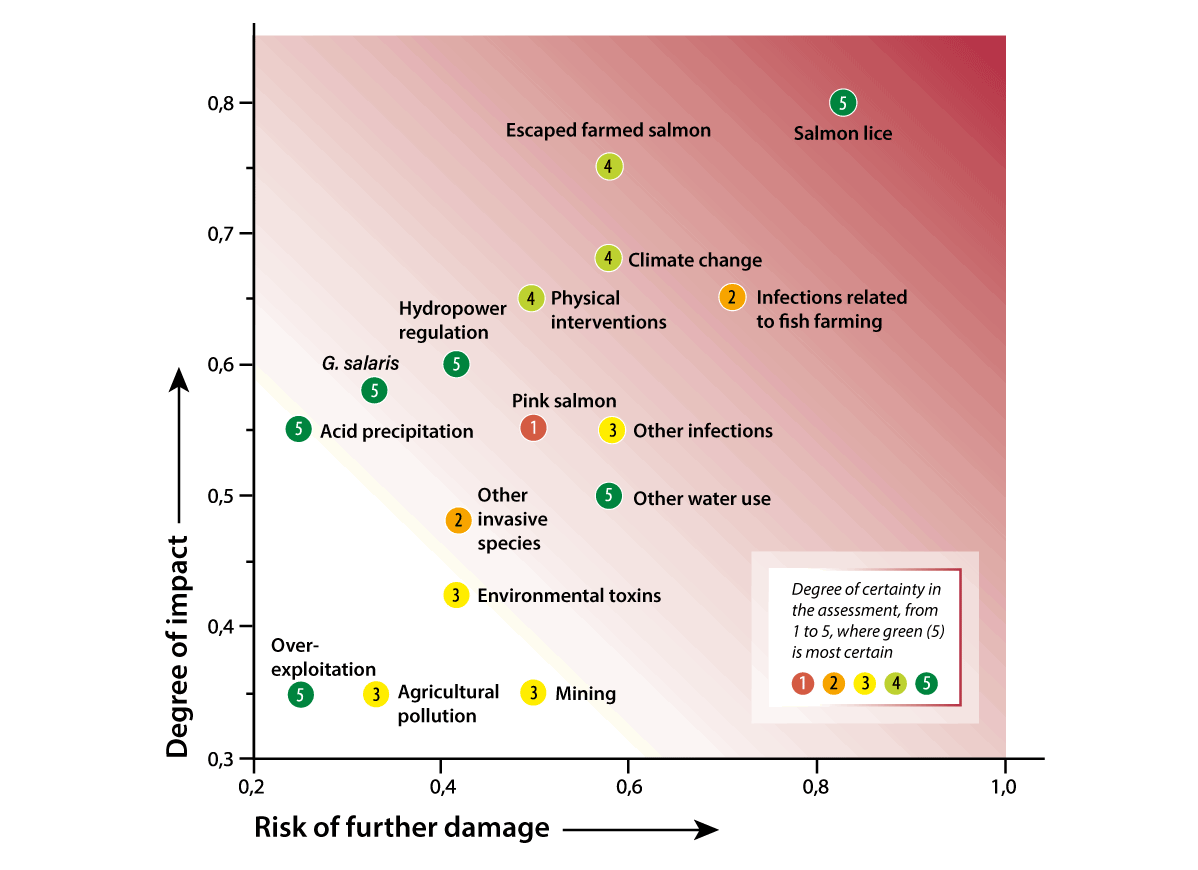
Figure 3.8 Impact on salmon populations
Different threat factors for wild salmon have been placed in an impact and risk diagram. The background colour shows the severity (the darkest colour has been used to indicate the greatest severity). The colours of the points symbolise the degree of certainty in the assessment, based on how well-documented the effect is and how harmonised the documentation and experts are in the assessment under a five-part scale.
Source: The Norwegian Scientific Advisory Committee for Atlantic Salmon (2023)
There are many factors that affect the main freshwater ecosystem. Figure 3.7 shows the most frequently occurring factors in relation to the number of bodies of water assessed as having moderate to high impact on the aquatic environment in lakes and rivers respectively. The effect on the aquatic environment depends on the scale of the driver and the ecological vulnerability. Long-range pollution in the form of acidic precipitation will result in acidification, while run-off from wastewater will primarily result in eutrophication. Alien species or diseases are also main drivers of change and include drivers in the form of salmon lice and escaped salmon from salmon farming. Physical interventions, such as hydropower developments, result in habitat changes that can lead to less favourable conditions for aquatic organisms. Several of the major development projects dating back to before 1980 do not fulfil modern environmental requirements such as the level of the flow of water or well-functioning fish passages. Hydropower developments affect water systems throughout the country and a significant proportion of controlled rivers and lakes do not achieve good status and have been categorized as heavily modified bodies of water with adapted environmental targets.
3.2.3 Wetlands
Wetlands include bogs, springs, riparian zones, river deltas and other flooded land. Norway has a wide variety of habitats and flora and fauna in wetlands. Wetlands are found throughout the country, except for in the high-alpine zone, and there is great regional and local variation. Most areas with wetlands comprise different types of bogs and Norway is among the European countries with the most bogs. NIBIO estimates that the total area of intact bogs and swamp forests in Norway is 41,655 km2 (about 13 per cent of the land area).6 Of this, 28,777 km2 consists of bogs (about 9 per cent of the land area) and 12,878 km2 consists of swamp forests (about 4 per cent of the land area). Maps created by NINA using remote sensing and artificial intelligence yield higher estimates.7
Ecosystem condition
The Nature in Norway mapping system defines bogs and riparian zones as wetlands and places the other habitat types (springs, river deltas, underwater meadows, etc.) in the river and lake and ocean and coast ecosystems. Based on this distinction, the ecological condition of wetlands will be assessed using the scientific system for ecological condition during 2026. In 2019, the nature index for wetlands was 0.68. According to the nature index there was a slight negative trend between 1990 and 2019 overall for the monitored species and habitat types in wetlands, with conditions virtually unchanged for the country as a whole between 2010 and 2019. A positive trend was observed in Northern Norway during the same period, while Western Norway experienced a negative trend. The nature index provides information about the condition of the wetlands that still exist. The area occupied by wetlands has decreased significantly in recent years and the nature index therefore does not provide a complete overview of wetlands in Norway. In 2018, the review of ecosystem services from wetlands showed that there has been an extensive decrease in the area of wetlands along the coast, particularly in over-populated areas.
Textbox 3.4 Nature Strategy for Wetlands
The 2021 «Nature Strategy for Wetlands» is a response to the «Nature for Life» white paper, which set out that targets should be established for the condition that must be maintained or achieved in Norwegian ecosystems and that the use of instruments must be adapted in order to achieve these targets, with the aim of management based on defined targets for ecological condition being in place by 2020.
The strategy sets out the expected condition in wetlands if no new instruments or actions are introduced to improve the situation (the business-as-usual scenario) and how great the impact from different sectors could be. In this scenario, the trend would remain negative for both dispersion and ecological condition in the wetland ecosystem. This was the first time impacts and actions from different sectors were viewed in such a broad context: from local authorities’ land management, communication, defence, energy supply and agriculture to area protection and climate actions.
Many different industries and activities contribute to the negative trend for wetlands, while at the same time the industries and society as a whole benefit from the services of wetlands. The nature strategy assessed the importance of wetlands in achieving the policy targets for the different sectors, balanced the different considerations, sector targets and climate and environmental targets against one another and established a target for the condition of the wetlands ecosystem:
(1) slow down the current rate of area decline in wetlands and (2) improve the ecological condition of wetlands.
The strategy presents 27 actions and instruments to achieve the target. The strategy is being followed up by the various responsible authorities. The Ministry of Climate and Environment maintains an overview of the status of and follow-up on the strategy in consultation with the relevant ministries. The aim is for the strategy to be evaluated after six years and revised after twelve years. A decision will then be made as to whether it is necessary to amend the target level.
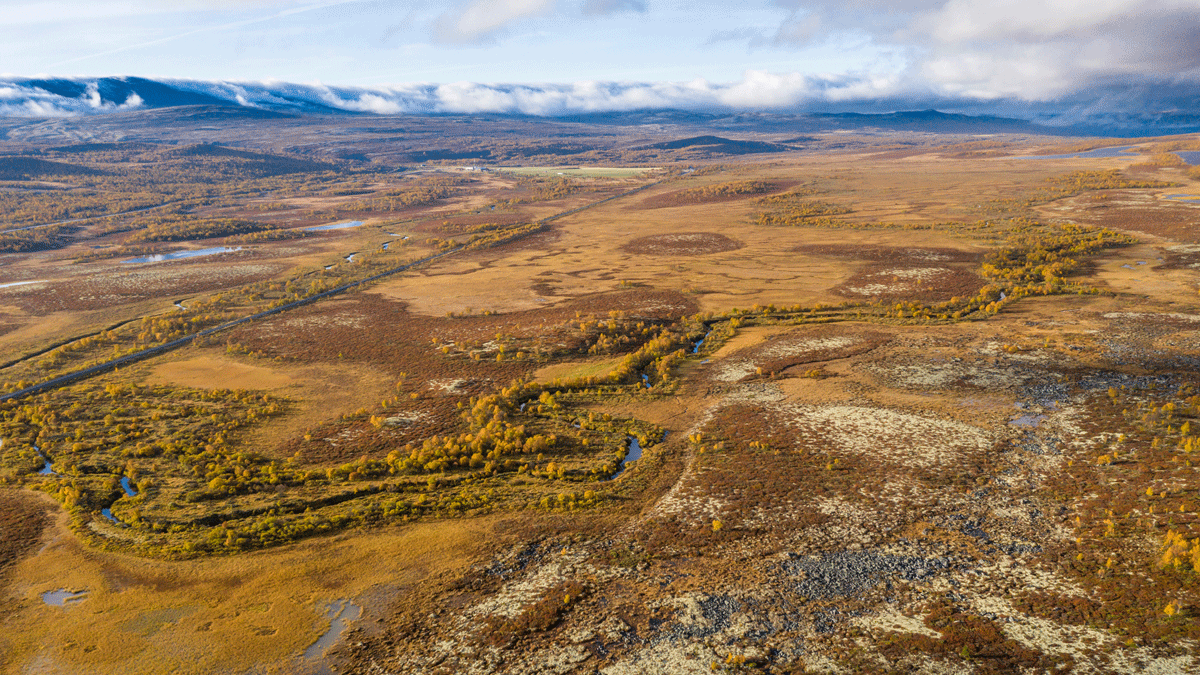
Figure 3.9 Wetlands ecosystem
Fokstumyra Nature Reserve covers a large and incredibly varied bog and wetlands area with a very rich and diverse bird life.
Photo: Kim Abel
Endangered species and habitat types
The Norwegian Red List for Ecosystems and Habitat Types from 2018 defines 32 habitat types for the main wetland ecosystem. Of these, 14 are classified as endangered and 4 are classified as near-threatened. Palsa mires are endangered, and monitoring shows a negative trend that was consistent throughout the country from 1990 to 2010. Since 2010, the negative trend has decreased for palsa mires in Southern Norway but continues in Northern Norway. Climate change is expected to further worsen the condition of palsa mires in the future.
Of the endangered species, 289 predominantly live in wetlands, which corresponds to 10.5 per cent of the endangered species. Furthermore, 167 species in wetlands are classified as near-threatened. Many of these are vascular plants, beetles, flies and mosses.
Drivers of change
Land use interventions constitute the greatest driver of change in wetlands. Fragmentation, training of a river, damming, peat harvesting, cultivation and industrial development projects and other built-up areas are all examples of land use changes that have a negative impact on wetlands. Wetlands along the coast in particular have been subject to extensive reduction and wetlands in the lowlands of Southern Norway face great pressure. Wetlands are also affected by climate change. This constitutes the greatest negative driver on the palsa mire biotope, a type of bog consisting of peat mounds with a frozen core.
3.2.4 Forests
Forests include all wooded areas, including mountain birch forests, and are defined as areas with a crown coverage of more than 10 per cent, where trees can grow to at least five metres tall. Forests and other wooded areas cover 44.5 per cent of the mainland areas. Forests alone make up 38 per cent of the land mass, or approximately 121,600 km2. Of this, 71 per cent is productive forests8 and 29 per cent is unproductive forests9.
The discussion of the Menu of Measures for forests in Chapter 5.3.1 provides a more detailed account of the knowledge of the status and impacts that were important during the Government’s work on identifying targets and actions for the main forest ecosystem.
Ecosystem condition
Like the other natural ecosystems on land, the reference state for forests have been defined as an ecosystem with limited impact from human activity. At the same time, there is also an aim of conducting effective Norwegian forestry. The ambition is therefore not for the reference state to be the target for the state of Norwegian forests.
The ecological condition of forests was assessed for the first time using the methodology set out in the assessment system for ecological condition in 2020. The condition was assessed at an index-value of 0.42.
The Ministry of Climate and Environment and the Ministry of Agriculture and Food commissioned the Norwegian Environment Agency and the Norwegian Agriculture Agency to draw up a joint knowledge platform on the ecological integrity of Norwegian forests and to provide an account of any actions that contribute to maintaining or improving the ecological integrity of forests. The agencies noted that the scientific system provides a highly simplified representation of ecological integrity at national and regional level based on few indicators that are weighted the same. The system does not differentiate between different types of forests and the land use in these and has therefore not been designed with targeted forests management in mind. The system is also not designed to measure changes to the area dispersion of an ecosystem.
These factors would be appropriate to emphasise in the further development of the contents of the scientific system with regard to forests.
In order to assess targets, balance different interests and initiate concrete actions in areas that are managed in relation to different policy targets, more detailed and area-differentiated knowledge is required. The Menu of Measures for forests therefore emphasises 13 selected indicators that can be affected by forestry actions, restoration actions or the absence of action, with a focus on productive forests. The Government’s Menu of Measures for forests is presented in Chapter 5.3.1.
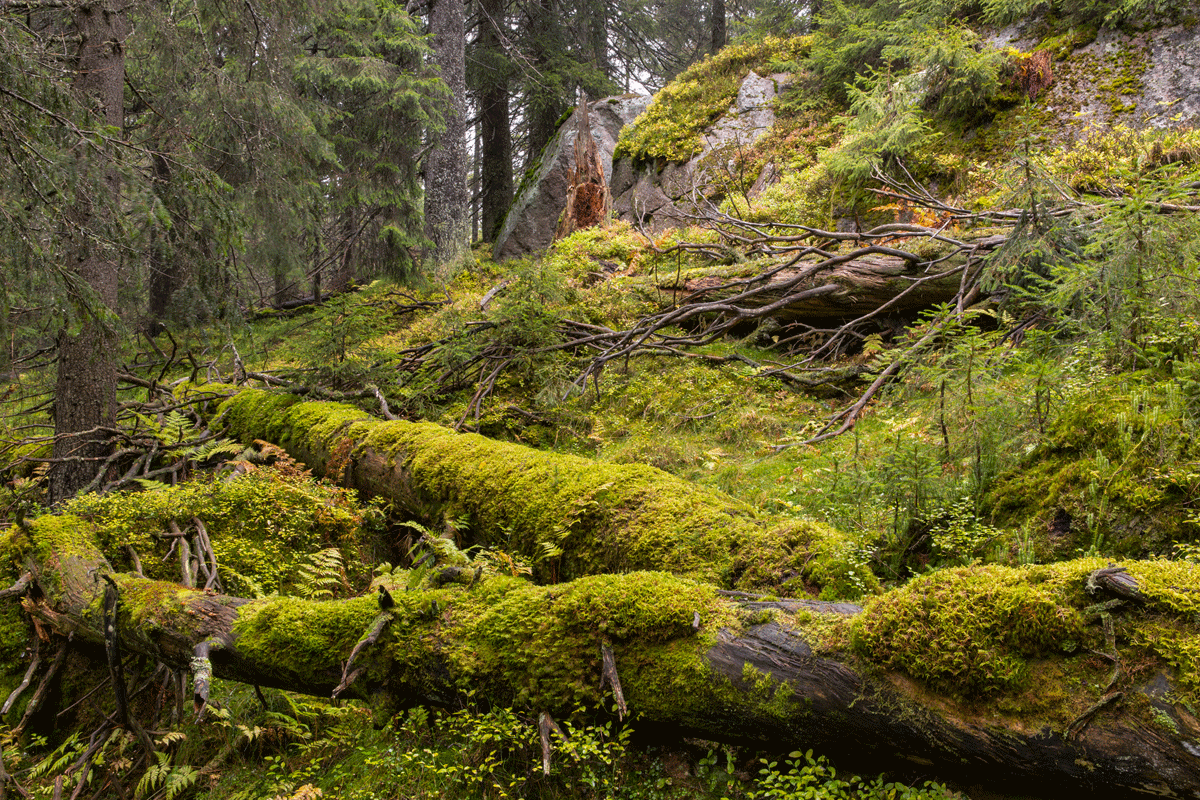
Figure 3.10 Forests ecosystem
Gullenhaugen Nature Reserve includes an ancient spruce forest with old trees and a lot of dead wood. Such ancient natural forests are important for a number of rare and red-listed species.
Photo: Kim Abel
Endangered species and habitat types
As mentioned, forests account for 38 per cent of the mainland and are the major ecosystem in Norway with the greatest number of species. It is estimated that around 60 per cent of the known species in mainland Norway are associated with forests. It is therefore not surprising that many red-listed species can be found in forests. Of all endangered species on the 2021 Red List, 48 per cent can be found in forests. This proportion is the same as in the previous red list. Most endangered forest species can be found in the groups: fungi, beetles, lichen and flies. These are species groups with a high number of forest species in general.
Many of the species are specialists linked to specific biotopes such as lying or standing deadwood. Some of the biotopes in forests are highly concentrated in specific forest types, especially old-growth forests with limited intervention and deciduous forest.
According to the 2018 Red List of Ecosystems and Habitat Types, nine biotopes in forests are endangered, of which two, olivine forests and deciduous lime forests are highly endangered.
More old trees and more deadwood, more forest conservation and heightened environmental considerations in forestry through the forestry industry’s own environmental certification systems can result in improved conditions for endangered species and biotopes.
Drivers of change
Key impact factors include land use changes and forestry. 1132 of the 1330 endangered species in forests (85 per cent) are considered negatively impacted by earlier or ongoing land use changes associated with forestry.
The majority of development projects that lead to loss of land in Norway take place in forests. From 1990 to 2020, approximately 1,800 km2 of forests were repurposed, which corresponds to an annual deforestation rate of around 0.05 per cent of the forest area. The main cause of deforestation is development (65 per cent) followed by repurposing to pasture (19 per cent) and land reclamation (14 per cent). The decline in forested area is partially compensated for through the establishment of forests in open areas, primarily as a result of overgrowth. Climate change constitutes an ever-increasing driver of change in forests. Increased average temperatures and precipitation may have certain positive effects, but extreme weather and climate-related disturbances may have major, increasingly negative effects on the forest ecosystem.
3.2.5 Cultural landscapes and open lowlands
Cultural landscapes and open lowlands consist of cultivated areas (croplands and grasslands), semi-natural land and other habitats in naturally open areas below the treeline. This main ecosystem therefore includes both culturally determined habitats, shaped by long-term use and natural habitats, and natural habitats uninfluenced by humans.
Cultural landscapes are landscapes that have been affected by human activity. The use of the term may vary, but in this context, it refers to cultural landscapes shaped by agriculture. Semi-natural habitats such as boreal moors, coastal moorland, hay meadows and natural pasture land are shaped through extensive cultivation over a long period of time. Grazing, haying and regular scorching of vegetation without adding mineral fertiliser and pesticides have resulted in a unique and rich diversity of species. In the Nordic region, hay meadows are considered to be among the most species-diverse habitats. Norway is recognized for its summer pasture culture, also internationally. Biotopes in cultural landscapes and open lowlands include areas that provide important grazing resources for livestock.
The habitats in naturally open areas below the treeline boast great variation. Several of the habitats consist of small patches and often occur in mosaic with other nature in the cultural landscape. They sustain a rich biodiversity and provide key ecological functions.
According to monitoring data, the extent of semi-natural fields (hayfields and natural pasture) corresponds to an area of between 0.4 and 1.1 per cent of the Norwegian mainland. Agricultural land (arable land, surface-cultivated farmland and cultivated pasture) accounts for around 3 per cent of the mainland area.
Ecosystem condition
The nature index for semi-natural land was 0.44 in 2019. There has been a generally negative trend since 1990, and the index continues to show a negative trend for the indicators for the coastal moorland, semi-natural meadows and beach meadow habitats. The main reason for the negative trend is changes in agriculture practise, such as less grazing, haying and heath scorching with subsequent overgrowth, or intensified agriculture practises, such as increased fertilisation, use of pesticides or tilling. The data available is not sufficient to assess the ecological condition of semi-natural meadows or natural open areas below the treeline using the assessment system for ecological condition.
Endangered species and habitat types
There are 15 endangered habitat types and 1546 endangered species that are primarily linked to semi-natural land and open lowlands (56 per cent of endangered species in Norway). Examples include the habitats of hay meadows, coastal moorlands and beach meadows, as well as the species slender parsley-piert, silvery argus, corncrake and lapwing.
There has been a downwards trend in bird species associated with agricultural landscapes for a long time. Monitoring of breeding birds shows that birds in agricultural landscapes experienced a sharp decline in population during the 1996–2021 period. Monitoring indicates that the population has now been reduced to half of what was measured in the late 1990s.
The habitats in cultural landscapes and open lowlands provide particularly important habitats for pollinators. The 3Q monitoring programme shows overgrowth in the agricultural landscape, with increased elements of forest species or late succession species, and that the original meadow species, which are crucial to pollinating insects, are disappearing.10
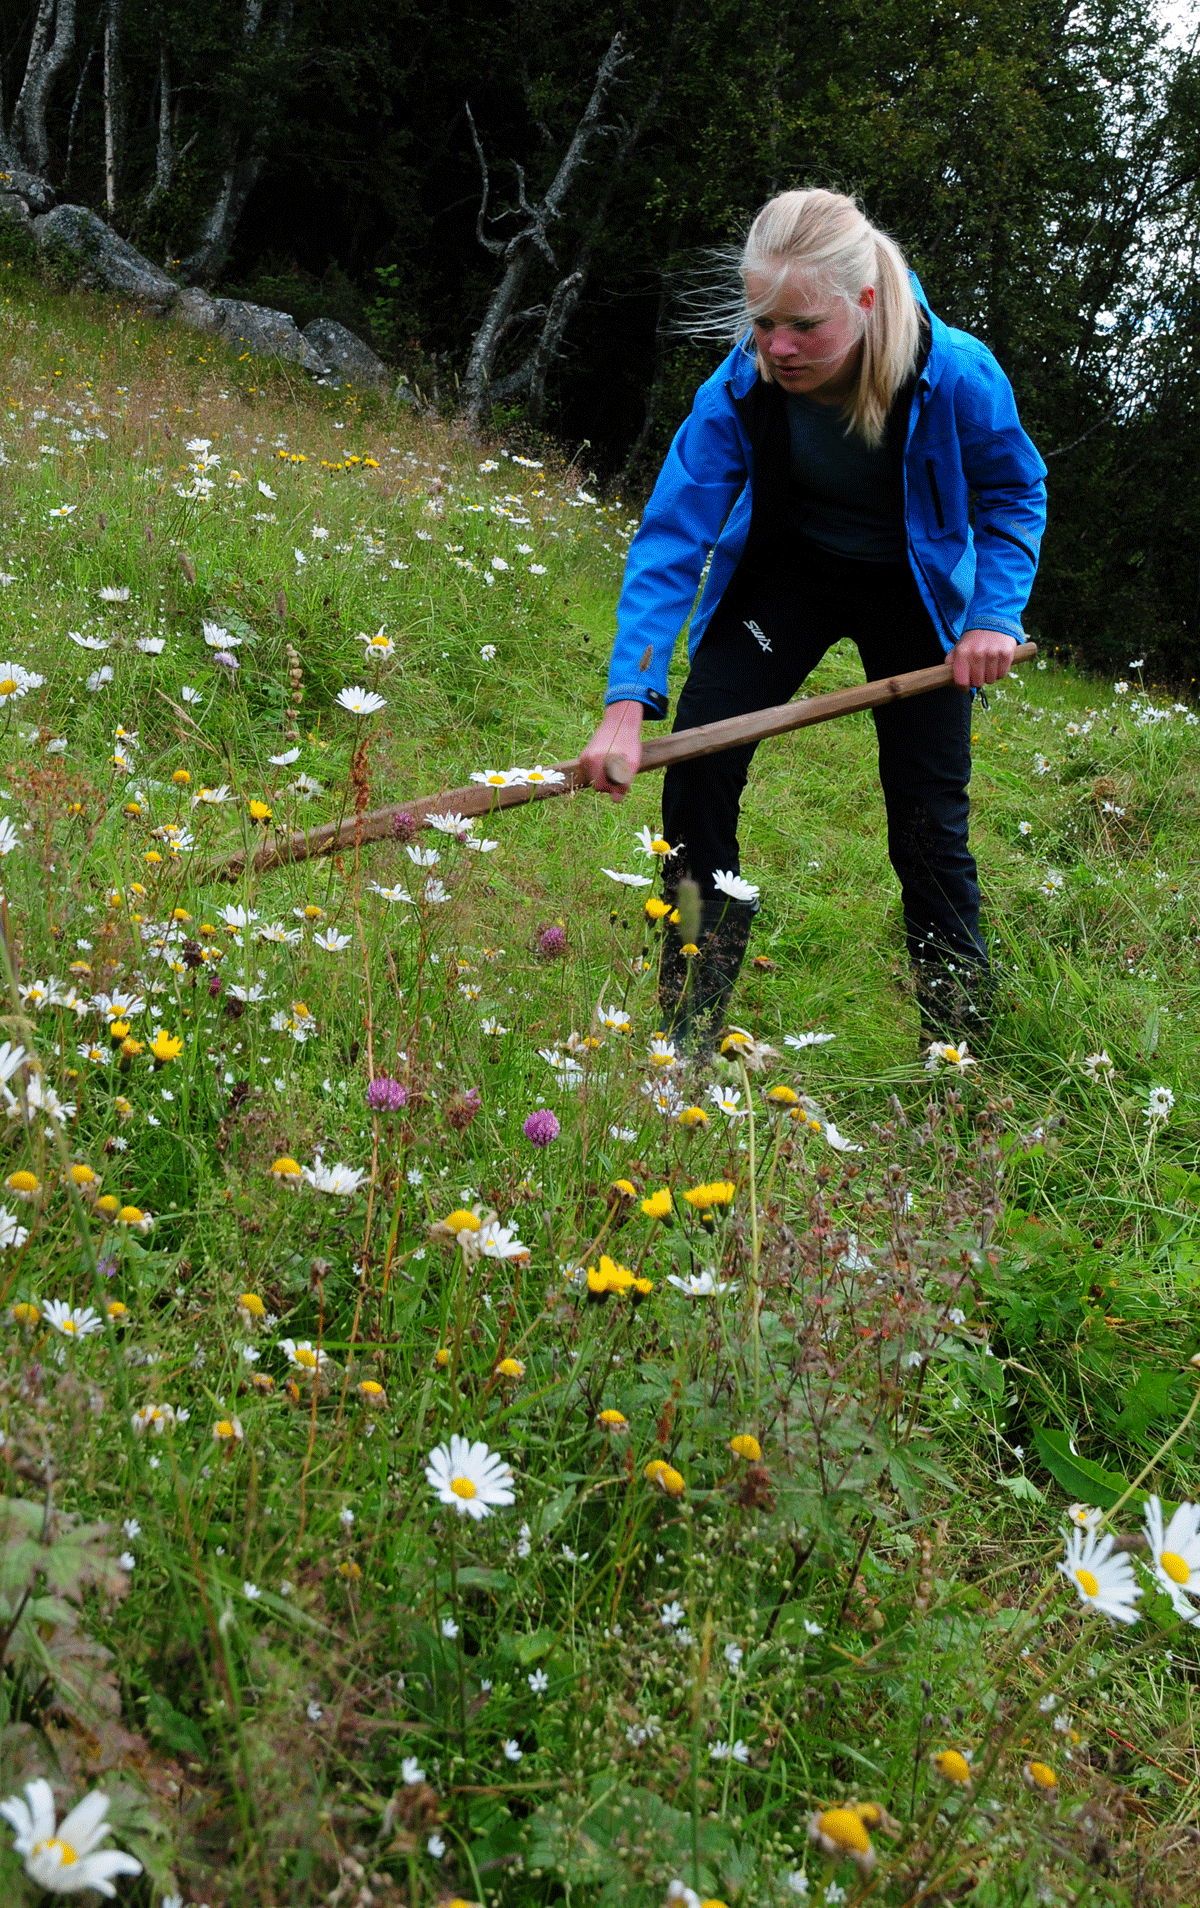
Figure 3.11 Cultural landscape and open lowland ecosystem
Haying of species-diverse meadow at Øvre Gunleiksrud in Tinn. Ongoing haying is necessary to maintain the flora and fauna associated with old cultural land.
Photo: Sigve Reiso
Drivers of change
The greatest threat to most habitats in open lowlands, except agricultural cultural landscapes, is various forms of land use changes. Many habitats are located in areas that are under pressure due to industrial development, holiday homes and infrastructure. Other land interventions also have an impact on habitats. For a number of endangered species and habitats in lowlands, we also find that pollution and traffic constitute significant drivers of change. Climate change could affect the dynamics of disturbances in areas vulnerable to landslides and located in close proximity to waterways, in several ways. Increased precipitation, for example, could lead to further protective measures to prevent landslides leading to the loss of habitats, but could also lead to occurrences of these habitats in new places and changed frequencies of landslides in areas in which the habitats already exist.
The biodiversity and ecological function of semi-natural habitat types are maintained through continued agricultural activity with gentle farming systems as in earlier times, such as haying, grazing and heath scorching. The dominant drivers of change are overgrowth due to agricultural changes and the cessation of traditional management and use. Another threat is intensification of agriculture through cultivation, crops, use of pesticides or mineral fertilisers or too much animal manure in relation to plant uptake. Pollution, climate change and alien species also constitute key threats. This has significant impact through changes to the composition of species and increased overgrowth, such as through the proliferation of garden plants, transplanting and proliferation of alien tree-species in coastal meadows and long-range nitrogen pollution. For semi-natural beach meadows, developments for purposes other than agriculture also constitute a significant threat, while developments for wind power and associated infrastructure constitute a challenge for coastal meadows.
3.2.6 Mountains
Mountains include all areas above the actual treeline and the areas situated north of this (in Finnmark). The actual treeline is where the forests end towards the mountain, regardless of whether this is due to climate conditions or different types of human use. With this demarcation, the mountains account for 124,537 km2, which corresponds to about 38.5 per cent of the total mainland area.11 The major ecosystem has a broad geographical distribution in Norway, from the Setesdal moors in the south to the coastal areas in the far north of Finnmark. Many mountainous areas are naturally fragmented into larger and smaller areas consisting of fjords and wooded valleys, but there are also large continuous mountainous areas such as Hardangervidda and Finnmarksvidda.
Ecosystem condition
According to the assessment system for ecological condition, the Norwegian mountains have a value of 0.68. The mountains in Southern Norway have a slightly lower value than Norway as a whole (0.64), but the differences are generally minor between different regions. Although the mountains have good ecological condition, there is some uncertainty due to inadequate coverage of indicators. The Arctic fox, small rodents and wolverines are at the greatest risk. The population status and changes in the occurrence of these species are contributing to changes to the balance in the food chain. Climate change is also contributing to reduced glaciers and changes in vegetation.
The nature index for Norwegian mountains is 0.56 and there has been a negative trend from 1990 to 2020 in all parts of the country. A negative trend has, among other things, been observed for small rodents, while a positive trend has been observed for domesticated reindeer and alpine sparrows have had a stable trend. The index value for wolverines has increased slightly during the latest period but the species is far from close to a natural population density. The integrity of the golden eagle is close to the reference state for the species.
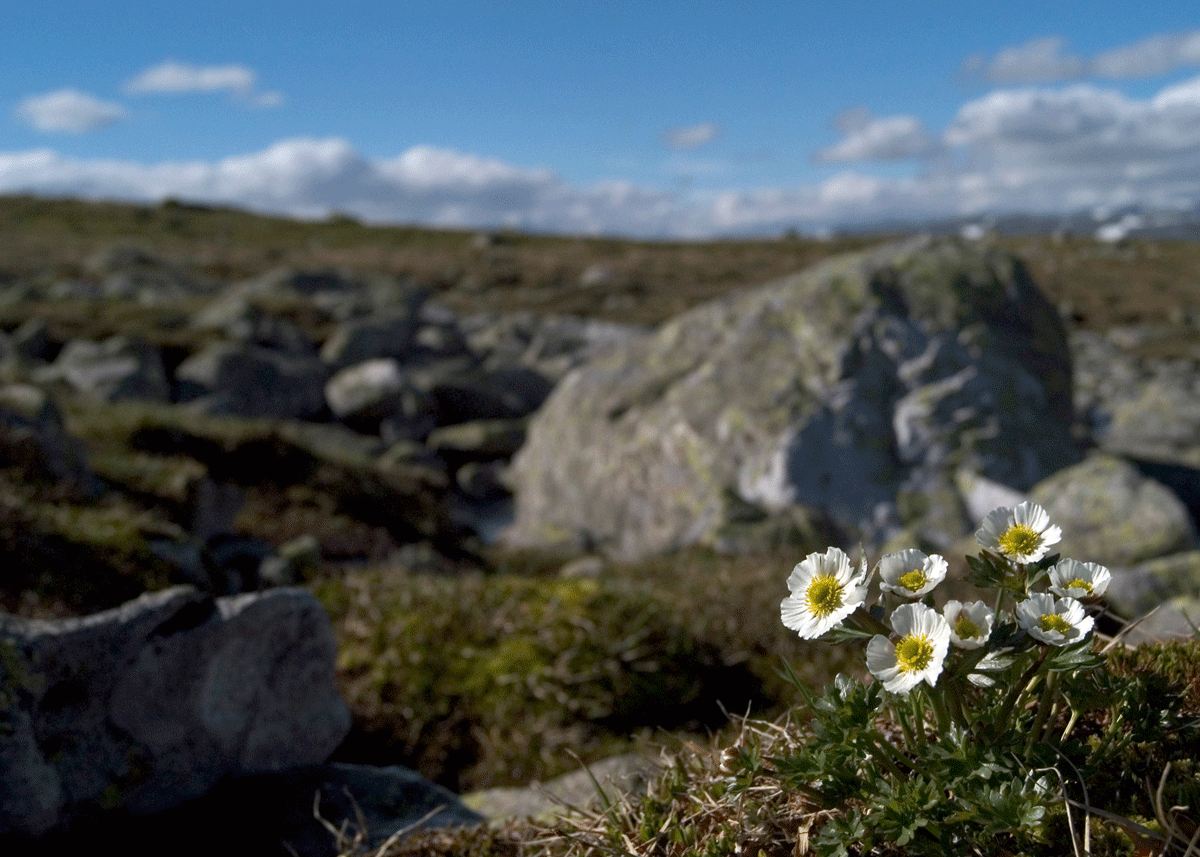
Figure 3.12 Mountain ecosystem
Many species living in the mountain ecosystem could experience difficulties due to climate change. The glacier buttercup is the highest growing flower plant in Norway. According to the Norwegian Red List for Species from 2018, the glacier buttercup is expected to be negatively impacted by climate change.
Photo: Sigve Reiso
Endangered species and habitat types
In the 2018 Red List of Ecosystems and Habitat Types, 15 habitat types are classified as belonging to the mountains. Of these, ten are on the red list and three are considered endangered (one critically endangered and two vulnerable). Some of the habitat types are naturally rare, while others are under threat due to land reduction, primarily as a result of climate change. There is limited information available concerning the total area, distribution area and the occurrence of different biotopes in the mountains apart from the glaciers, which are carefully monitored. Many Norwegian glaciers have retracted significantly since 2000 due to climate change. From the last mapping during the 1999–2006 period to the latest mapping in 2018–2019, glaciers are reduced by 15 per cent and 20 glaciers have disappeared completely due to melting.12
Of the species on the Red List for Species from 2021, 656 of the assessed species are classified as mountain species. About half of these, 330, are red-listed and 174 species are classified as endangered. This corresponds to 27 per cent of mountain species. There are 17 critically endangered and 52 endangered mountain species. The majority are vascular plants and mosses, but there are also insects, arachnids, birds and mammals on the list.
Four of the Norwegian priority species live in the mountains – the Arctic fox, Lesser white-fronted goose, field locoweed and black vanilla orchid. Wild reindeer made the red list for the first time in 2021 as a result of the number of Norwegian wild reindeer having reduced due to measures to prevent chronic wasting disease. It now has status as near-threatened (NT).
Wild reindeer is a Norwegian responsibility species as around half of the European wild reindeer population and nearly the entire European population of mountain reindeer live in mainland Norway. Wild reindeer are considered a space-intensive species in so far that they travel long distances across suitable grazing and calving areas. In April 2024, the Norwegian government published a white paper on measures to improve the status of wild reindeer.
The breeding bird monitoring for mountains shows a declining trend for the 2007–2021 period. A clear decline was recorded in the index from 2007 to 2013, followed by a small increase/stabilisation over the last seven years.
Drivers of change
The biggest drives of change on the mountain ecosystem are land use changes and climate change. Although most developments in Norway take place below the treeline, there is bit-by-bit development of the mountains by way of cabin developments and infrastructure such as railways, roads and wind and hydropower plants. These developments are also accompanied by disruption and wear from people, which has an impact on the flora and fauna in the mountains.
No major changes have been identified in plant communities in the mountains yet, but climate change is expected to affect many mountain species in the future. Temperature increases are resulting in earlier leafing and longer growing seasons in the mountains and the treeline is already moving upwards.
3.2.7 Polar ecosystems
Polar ecosystems include Svalbard and Jan Mayen, as well as the Arctic sea areas in the Barents Sea and the Norwegian Sea. A comprehensive description of Norwegian sea areas is given in 3.2.1.
The climate on Svalbard and Jan Mayen is Arctic-marine, with relatively mild winters and short summers. The islands are isolated and have unique, distinctive ecosystems that have adapted to Arctic conditions over a long period of time. There is a close link between the ecosystems in the sea and the ecosystems on land.
Svalbard, including all islands, islets and skerries, amounts to a land area of approximately 61,000 km2. Of this, around 60 per cent is covered in ice, less than 10 per cent of the land area has any significant biological production and this is often concentrated in small areas. In winter, Svalbard is usually surrounded by sea ice, except for the western coast, where warm water from the Atlantic arrives with the West Spitsbergen current. During the summer months, the ice retreats north and Svalbard can often be surrounded completely by open sea.
Jan Mayen has a land area of 376 km2. In the past, the surrounding sea areas were often ice-covered from February to April, but this is now extremely rare. The volcanic origins of the island characterise the landscape, vegetation and habitat types.
The ecosystems on Svalbard and Jan Mayen are characterised by few species and simple food webs, but a very high number of individuals. The wildlife on Svalbard is unique in a European context and the flora exists under marginal conditions. The Arctic fox, Svalbard reindeer and Svalbard rock ptarmigan are key species in the high Arctic tundra of Svalbard. Marine mammals in the Svalbard region include whales, seals and polar bears. There is also a rich and varied bird life on Svalbard.
Jan Mayen appears relatively untouched and has unique, vulnerable vegetation that is dominated by mosses, including several endemic species that can only be found on Jan Mayen. Hooded seals and Greenland seals have important breeding grounds northwest of Jan Mayen. With its isolated location in a large, productive sea area, Jan Mayen is a crucial area for seabirds.
Ecosystem condition
The ecological integrity of the Arctic tundra has been assessed in accordance with the assessment system for ecological condition. The ecological condition of the Arctic tundra on Svalbard is very good overall, but the ecosystem is somewhat impacted by climate change. On Svalbard, the annual temperature increased by 3–4 degrees from 1971 to 2017, with the greatest increase in winter and the smallest increase in summer.13 Flora and fauna on Svalbard have been exposed to significant changes due to increasing temperatures, milder winters, less sea ice, more rain during winter, warmer and longer growing seasons, shorter snow seasons and thawing of the permafrost. The impacts of climate change on the ecosystem are still limited, and key functions and structures are being maintained for now. We can already see a changing trend in ecosystems and in the distribution of species. Climate change and the reduced extent of sea ice are expected to lead to significant changes to biodiversity in the longer term, including reduced occurrences of high Arctic species that depend on the cold climate and sea ice.
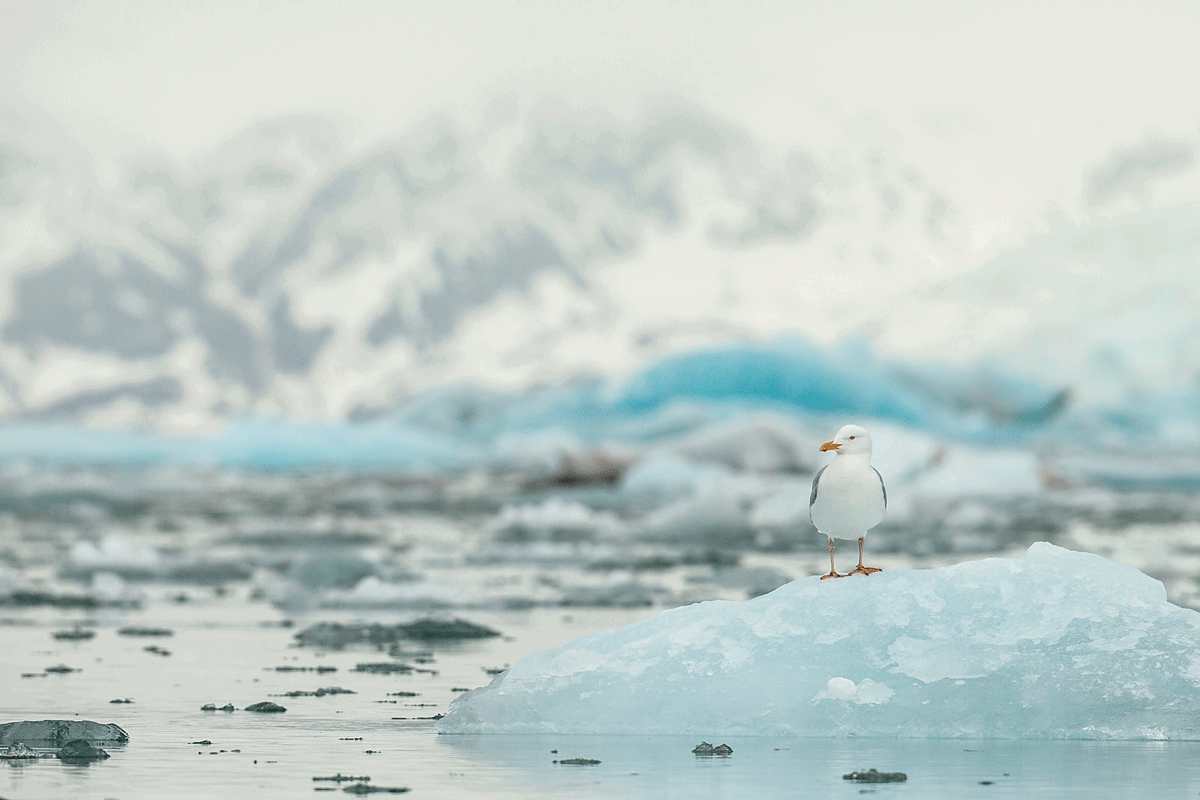
Figure 3.13 Polar ecosystems
The glaucous gull is an Arctic gull that breeds on Svalbard, among other places.
Photo: Kim Abel
Endangered species and habitat types
Both the proportion of species on the Red List (21.4 per cent) and the proportion of endangered species (12.4 per cent) for Svalbard are somewhat higher than the figures for mainland Norway, including Norwegian sea areas (21.2 per cent and 11.8 per cent respectively). There are 67 endangered species (9 critically endangered, 21 endangered and 37 vulnerable). Pressures from other local species and climate change constitute the impact factors listed for most species on Svalbard, with 30 and 27 of the total of 67 endangered species respectively. Pressures from local species is relevant for the majority of vascular plants and lichen. For endangered vascular plants, competition from other species is expected to exacerbate through climate change. Land use changes affect only ten endangered species on Svalbard.
The Norwegian Red List of Ecosystem Types from 2018 shows that Svalbard has three terrestrial habitat types that are classified as critically endangered and four habitat types that are classified as near-threatened. The other habitat types on land are classified as least concern. In general, climate change constitutes the most important driver of change. Five marine habitat types on Svalbard are endangered, all because of climate change. Multi-year polar sea ice has the highest classification and is considered critically endangered due to the significant decline.
Drivers of change
In the Arctic, the extent of impact on the natural environment due to local activity and land and sea use is mostly much lower than on the Norwegian mainland. This is linked to low population density and large areas without settlements and agricultural activities, limited industrial activities and, in most areas, lower levels of activity at sea and along the coast in the form of fisheries shipping and petroleum activities. Industrial activity on Svalbard in the form of coal mining is now in decline and Norwegian coal mining is scheduled to be discontinued completely in 2025. Svalbard is exposed to long-range pollution from environmental toxins and plastic through air and sea currents. Additionally, there are also both active and legacy sources of pollution from settlements, mining, research and tourism. The environment and many of the wildlife species on Svalbard contain very high levels of some pollutants.
Historically, Arctic ecosystems have been heavily impacted by over-harvesting, e.g. from whaling and hunting of other mammals and birds at sea and on land on both Svalbard and Jan Mayen. Increasingly extensive protection of these species and their habitats over the past century have resulted in most of the populations now being of least concern and largely restored.
Climate change has already changed living conditions and areas of dispersion for several species in the Arctic and over time will likely result in many ice-dependent species, such as the ringed seal and polar bear, fully or partially disappearing from these areas. Svalbard is one of the places in the Arctic where sea ice is decreasing most rapidly in both summer and winter. Furthermore, climate change will have an impact on access to winter grazing and summer grazing for herbivores. With global warming, alien species already present in Svalbard could gradually spread, establish and constitute a higher ecological risk.
Tourism and travel on Svalbard have increased over a number of years and result in vegetation wear and disturbance of wildlife. Less sea ice as a result of climate change means that many areas are more accessible for activities, which we already see in relation to fisheries and cruise traffic. Another challenge is that tourism and shipping can bring an increasing number of alien species, at the same time as the climatic barriers provided by the cold climate are weakened due to climate changes.
3.2.8 Urban nature
Urban nature, or urban ecosystems, include all elements of nature in urban areas, such as water and water systems, green parks and one-hundred metre forests, but also private gardens and green roofs, and often consist of a mosaic of grey, developed areas and green natural land.
Ecosystem condition
Although urban areas are largely impacted by human activity, these areas can still include important natural land and residual biotopes with a rich biodiversity that is impacted to a lesser extent by human activity. Urban nature is characterised by a lower number of endemic species than can be found in adjacent ecosystems, while there is also a large element of alien species. There is often a small degree of connection between the areas with natural vegetation and significant impact from human activity, both directly in the form of land use and indirectly in the form of noise and light pollution.14
Drivers of change
Urban nature is among the landscapes with the greatest impact from human activity. Continued urbanisation will lead to further pressure on, and potential fragmentation of, urban nature. Nevertheless, it has great importance as the «day-to-day nature» experienced by most residents. Urban nature is therefore important to people’s health and quality of life and provides ecosystem services with significant socioeconomic value. The value of good access to urban nature became clear during the coronavirus lockdown (2020–2022) as people increasingly sought out green areas in the local community for recreation and exercise.
Half of the world’s population now live in urban areas and the UN estimates that the proportion will increase to two thirds by 2050. Developed urban areas around the world’s cities have doubled since 1992.15 In Norway, more than 82 per cent of the population lives in urban areas.16 Most Norwegian cities have been developed in areas with excellent conditions for settlement and travel. This includes productive areas in the lowlands, which were originally highly biodiverse.
Urban nature often represents nature-based solutions to societal issues, such as local pollution and climate adaptation. Trees and other vegetation purify air and water and contribute to reduced pollution and improved health. Green roofs, parks and water systems effectively manage surface water from precipitation and trees that provide shade help regulate the temperature. An increasing number of local authorities map and develop increased knowledge of urban nature and see the value of safeguarding this.
Footnotes
Responsility species refers to species for which the Norwegian proportion of the European population constitutes 25 per cent or more. The proportion is updated each time the red list is updated.
Species assessed using criteria A, B and C.
The Norwegian Species Data Bank (2018) and the Norwegian Species Data Bank (2021).
Water statistics are available at www.vann-nett.no.
Nature in Norway (NiN) – Natural History Museum
Bryn et al. (2018).
Bakkestuen et al. (2023).
Productive forests are forests that can produce, on average, at least 1m3 of wood with bark per hectare per year under favourable population conditions. In arboraceous areas, the production capacity of the tree species in the area will be crucial. The Norwegian Environment Agency and the Norwegian Agriculture Agency (2023).
Unproductive forests are forests that cannot, on average, produce 1 m3 of wood with bark per hectare per year under favourable conditions. The Norwegian Environment Agency and the Norwegian Agriculture Agency (2023).
Pedersen, Kapfer and Sickel (2020).
Framstad et al. (2022).
Andreassen (2022).
Hanssen-Bauer et al. (2019).
Immerzeel and Bredin (2022).
IPBES (2019).
Statistics Norway (2023).