2 National circumstances relevant to greenhouse gas emissions and removals
2.1 Government structure
Norway is a constitutional monarchy with a democratic parliamentary system of governance. The current Government (the Støre Government) took power in October 2021. It is a minority coalition between the Labour Party and the Centre Party. The Storting (Norwegian parliament) determines Norway’s overall climate policy and the government implements and administers the policies and measures.
Although it is not a member of the EU, Norway has, since 1994, been part of the European Union’s internal market through the Agreement on the European Economic Area (EEA Agreement). The objective of the EEA Agreement is to strengthen trade and economic relations between the EEA/EFTA States and the EU Member States, based on level playing field throughout the EEA. The agreement gives the EFTA countries opportunities to influence EU policy making also in areas of relevance to the internal market, including environmental policies. A practical implication of the EEA Agreement is that Norway adopts the same legislation as EU where relevant. Details on legislation relevant to climate change are given in chapter 4.
2.2 Population profile
With a total area of almost 324 000 km2 and only 5.5 million inhabitants, Norway has the lowest population density in Europe after Iceland and Russia. The large majority of the Norwegian population is settled along the coast and the fjords, and an increasing percentage, at present about 80 per cent of the population, lives in urban settlements. Most of the urban settlements are small and have under 20 000 inhabitants. Only six areas – Oslo, Bergen, Stavanger/Sandnes, Trondheim, Fredrikstad/Sarpsborg and Drammen – have more than 100 000 residents. More than a third of Norway’s population lives in the six largest city areas. Population has grown about 31 per cent from 4.2 million in 1990 to almost 5.5 million in 2022.
2.3 Economic profile
Norway is a small, open economy. In 2021, exports constituted about 46 per cent of GDP. Together with foreign shipping, the production of crude oil and natural gas account for about a fourth of GDP in Norway, but only a small proportion of employment, see Table 2.1. Around 35 per cent are employed in the public sector.
Table 2.1 GDP and employment by sector in 2021
Value Added at basic prices (mill. NOK) | Share of total | Employment (1000 persons) | Share of total | |
|---|---|---|---|---|
Total GDP | 3 713 278 | 1.00 | 2 826.7 | 1.00 |
Total GDP, mainland1 | 2 838 790 | 0.76 | 2 784.8 | 0.99 |
Agriculture and forestry | 24 623 | 0.01 | 46.5 | 0.02 |
Fishing and aquaculture | 42 208 | 0.01 | 20.2 | 0.01 |
Mining and quarrying | 7 646 | 0.00 | 4.5 | 0.00 |
Oil and gas extraction including services | 869 625 | 0.23 | 57.7 | 0.02 |
Manufacturing | 227 577 | 0.06 | 216.1 | 0.08 |
Electricity, gas and steam | 117 148 | 0.03 | 16.6 | 0.01 |
Water supply, sewerage, waste | 25 187 | 0.01 | 17.7 | 0.01 |
Construction | 224 702 | 0.06 | 247.5 | 0.09 |
Wholesale and retail trade, repair of motor vehicles | 287 566 | 0.08 | 357.8 | 0.13 |
Transport via pipelines | 17 973 | 0.00 | 0.2 | 0.00 |
Ocean transport | 24 449 | 0.01 | 17.4 | 0.01 |
Transport activities excl. ocean transport | 75 061 | 0.02 | 111.5 | 0.04 |
Postal and courier activities | 9 220 | 0.00 | 16.5 | 0.01 |
Accommodation and food service activities | 38 692 | 0.01 | 85.6 | 0.03 |
Information and communication | 156 737 | 0.04 | 105.0 | 0.04 |
Financial and insurance activities | 158 144 | 0.04 | 48.6 | 0.02 |
Real estate activities | 107 066 | 0.03 | 30.2 | 0.01 |
Imputed rents of owner-occupied dwellings | 158 534 | 0.04 | 0.0 | 0.00 |
Professional, scientific and technical activities | 178 291 | 0.05 | 150.2 | 0.05 |
Administrative and support service activities | 80 912 | 0.02 | 131.2 | 0.05 |
Public administration and defence | 241 422 | 0.07 | 203.1 | 0.07 |
Education | 184 873 | 0.05 | 229.8 | 0.08 |
Health and social work | 393 256 | 0.11 | 604.1 | 0.21 |
Arts, entertainment and other service activities | 62 366 | 0.02 | 108.5 | 0.04 |
1 Oil and gas extraction, transport via pipelines and ocean transport are subtracted from Total.
Source: Statistics Norway.
Few countries have benefitted more from cross-border trade and investments than Norway. Globalization facilitates access to financing, capital and labour inputs, export markets, technological transfers, and increases competition. The result is a more efficient use of available resources, which has contributed to strong global growth during the past decades. Norway has also, for a long time, benefitted from rising export prices and falling import prices. Accordingly, Norway’s terms of trade have improved, and real disposable income has grown fast and resulted in high revenues for the state and companies, and strong growth in real household earnings.
Figure 2.1 Emission intensity
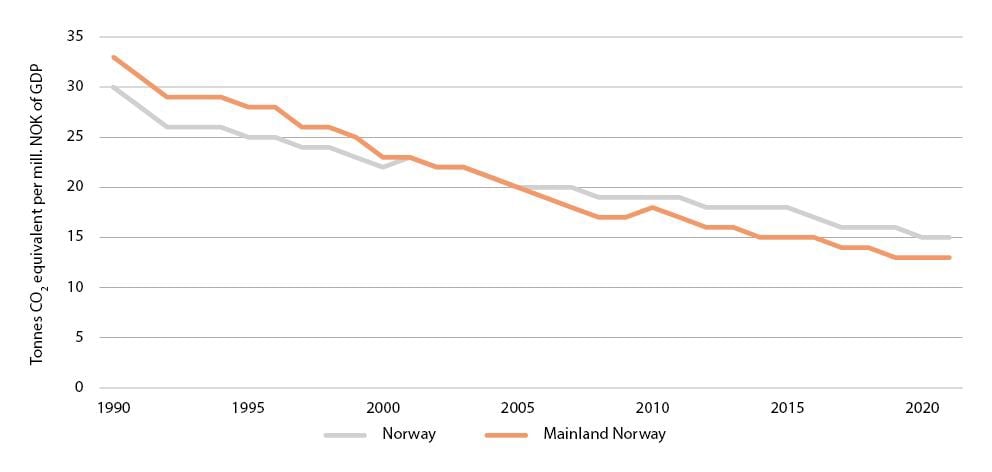
Source: Statistics Norway
As in many other countries, economic policy was expansionary during the pandemic. The central bank reduced the interest rate to a historically low level of 0 per cent, while fiscal policy was used actively to compensate the unemployed, expanding furlough schemes and prevent otherwise solvent companies from filing for bankruptcy. This successfully guided Norway through the crisis, and the economy has been going at full speed since the restrictions were gradually lifted during the spring of 2021. Unemployment has fallen to a level not seen before the financial crisis, and many companies report that difficulties recruiting workers constrain production. Inflation has also picked up significantly, both due to high energy prices and high demand for goods and services. Recently, there have been signs that the business cycle has reached its peak, and that economic growth is slowing down. High price growth, combined with higher interest rates to combat inflation is expected to reduce economic growth next year. Growth in the non-oil economy is nevertheless projected to remain somewhat higher than the estimated trend growth of around 1.75 per cent next year.
The petroleum industry will remain important for the Norwegian economy for years to come, but the importance on the economy in the coming decades is expected to decline as remaining resources decline. A continuously stricter global climate policy and an ever faster technological development changes the overall conditions for Norwegian business. Norway’s 2030 target under the Paris agreement is to reduce emissions by at least 55 per cent compared to 1990. This transition will require higher growth and new jobs in less carbon-intensive sectors. The strategy for green competitiveness sets the direction for this change.
Norway accounts for around 0.1 per cent of global greenhouse gas emissions. Norway’s emissions totalled 49.1 million tonnes of CO2 equivalents in 2021, excluding LULUCF, according to preliminary figures. Norway’s emissions peaked in 2007 and have since then decreased by 7.5 million tonnes CO2 equivalents, or 13 per cent.
Emission intensity fell by 2.2 per cent annually from 1990 to 2021 (see Figure 2.1). An even more marked decline has occurred in the mainland economy, where emissions per produced unit have dropped by 3.0 per cent annually. Greenhouse gas emissions relative to GDP normally decline as scarce resources are utilized more efficiently. Use of taxes or quotas on emissions, resulting in higher energy costs, reinforce this trend. Norway introduced a CO2 tax as early as 1991. This tax has subsequently been supplemented by the participation of Norwegian installations in the EU’s emissions trading system. About 85 per cent of all greenhouse gas emissions in Norway are subject to economic instruments. The use of economic instruments has contributed to the significant decline in emission intensity.
2.4 Geographic profile
The mainland of Norway is 1 752 km from north to south, spanning about 13 degrees of latitude. The total area of the mainland is 323 781 km2. In addition, the Norwegian continental shelf is 2 039 951 km2. The mainland coastline is more than 2 500 km long, excluding fjords and bays. In the east, Norway shares borders with Sweden, Finland and Russia. In addition, the Arctic archipelago of Svalbard is under Norwegian jurisdiction. Emissions from Norwegian activities in Svalbard are included in the Norwegian emission inventories.
The long and narrow shape of Norway is accompanied by wide variations in climate, geology and topography. This gives large variation in conditions for land use. Only about 30 per cent of the land area is lowland below 300 meters, and this is where most people live and where agricultural production is most intensive. As much as 20 per cent of the land area is mountainous areas more than 900 meters above sea level. Agricultural areas account for only 3 per cent of the mainland, while about 37 per cent is covered by forest. The remaining area consists of other cultivated and developed land, scrub, and heath along the coast, mountain forest and marginal forest, and sparsely vegetated mountains and mountain plateaus. About 46 per cent of the land is above the tree line. Currently, 17.1 per cent of the land area is protected under the Nature Conservation Act. Nevertheless, the proportion of wilderness-like areas, defined as areas more than 5 km from major infrastructure development, has been reduced dramatically from about 48 per cent of the land area in 1900 to about 12 per cent today. Only about 5 per cent of the area of southern Norway is characterised as wilderness-like.
2.5 Climate profile
Because of the influence of the North Atlantic Ocean, Norway has a much warmer climate than its latitudinal position would indicate. Therefore, most of Norway has a maritime climate with relatively mild winters and cool summers. On an annual basis, the highest normal (1991–2020) annual air temperatures, (up to 8.6°C) are found along the south-western coast (see Figure 2.2). Outside the mountain regions, the lowest annual mean temperatures (down to -1,9°C) are found on the Finnmark Plateau. During winter, the coast from Lindesnes to Lofoten has normal monthly mean temperatures above 0°C. The absolute lowest and highest temperatures measured at official weather stations on the mainland are -51.4°C and +35.6°C, respectively.
Figure 2.2 Normal annual temperature in Norway 1991–2020.
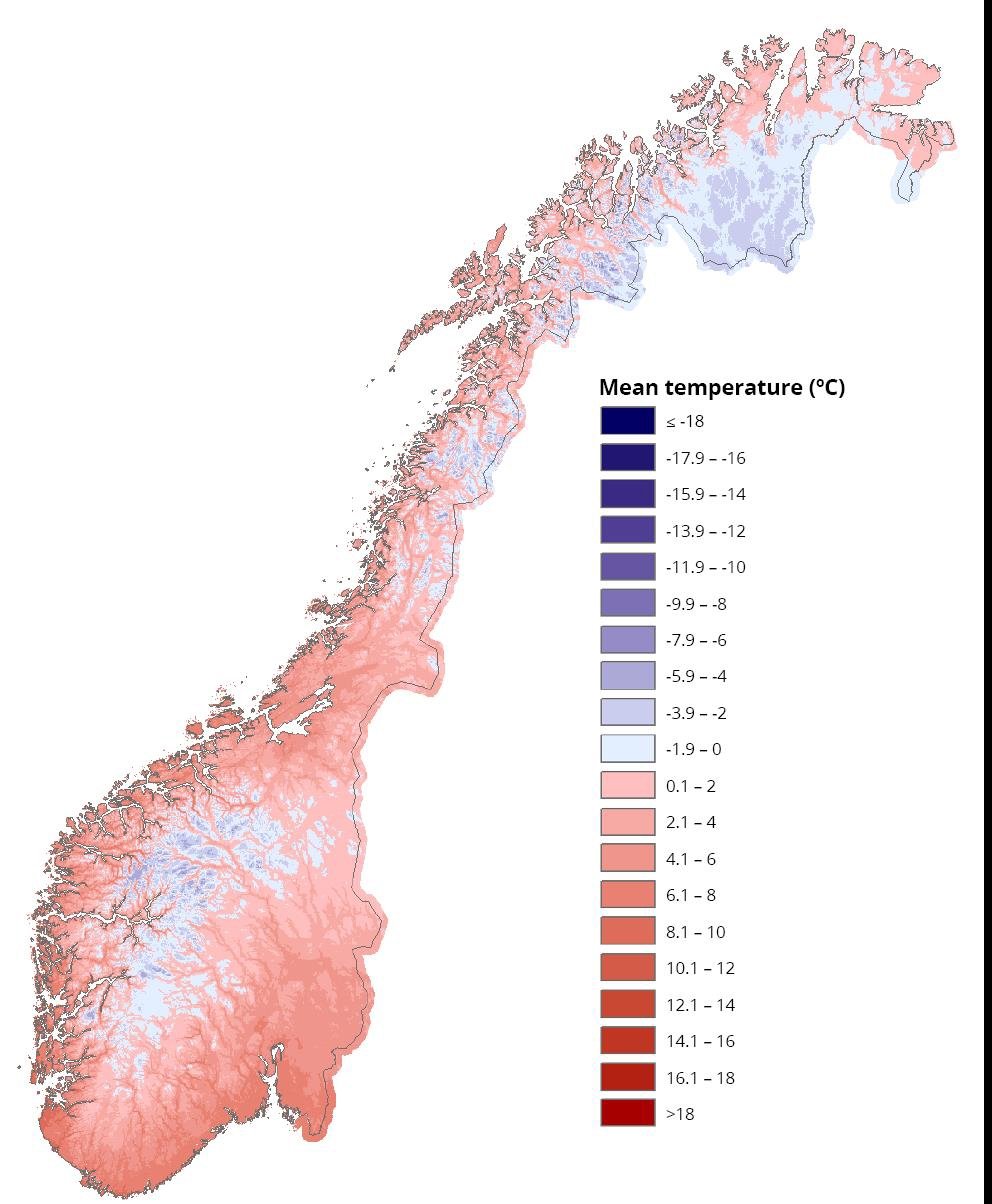
Source: Norwegian Meteorological Institute
In the cool Norwegian climate, there is a substantial need for heating of buildings. The “heating degree days” (defined as the number of degrees the daily mean temperature is below 17 °C, added up for every day of the year) for the 1991–2020 period was between 3000–4000 in the coastal lowland areas. In the northernmost parts of Norway, the value can be up to 7000.
Because of prevailing westerly winds, moist air masses flow regularly in from the ocean giving abundant precipitation over most of Norway. Areas just inland of the coast of western Norway get the most precipitation (see Figure 2.3). This zone of maximum precipitation is one of the wettest in Europe, and several sites in this region have normal annual precipitation of more than 3500 mm. On the leeward side of the mountain ranges, the annual precipitation is much lower, and a few sheltered stations in the inland areas of south-eastern Norway and one station in Nordland have normal annual precipitation less than 350 mm.
Figure 2.3 Normal annual precipitation in Norway 1991–2020
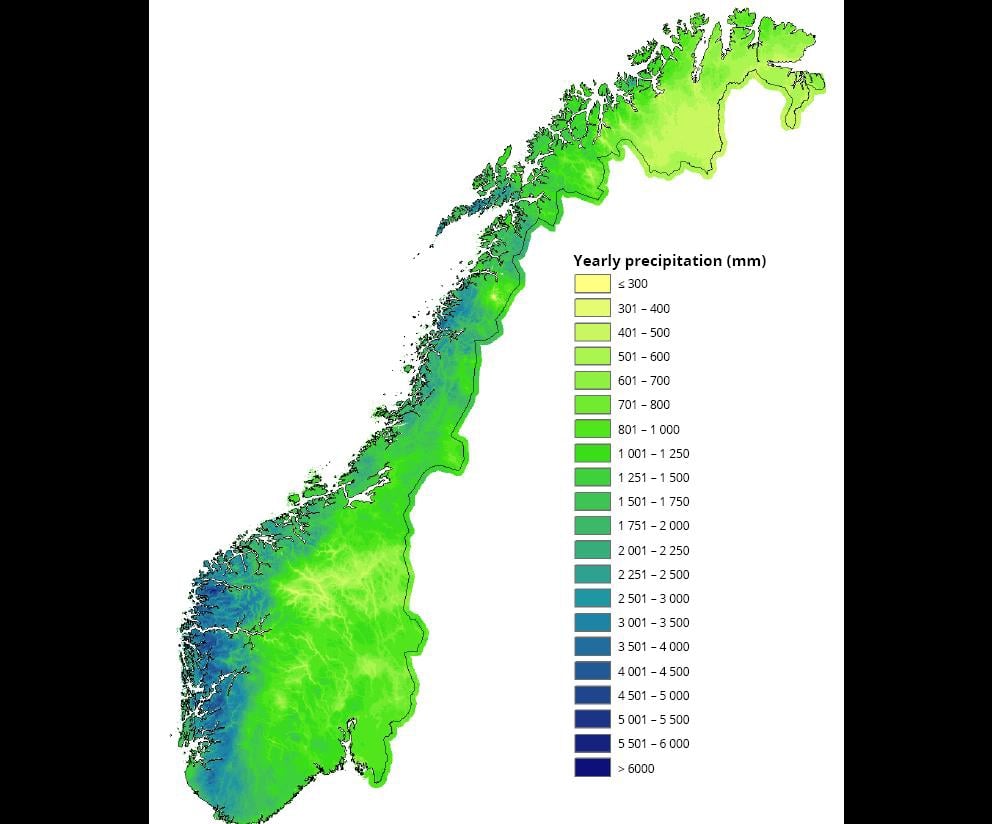
Source: Norwegian Meteorological Institute
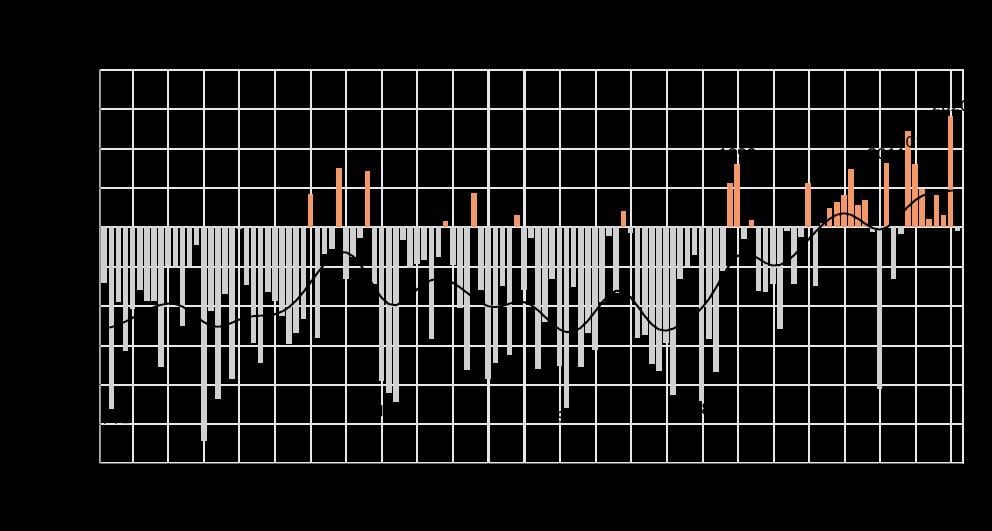
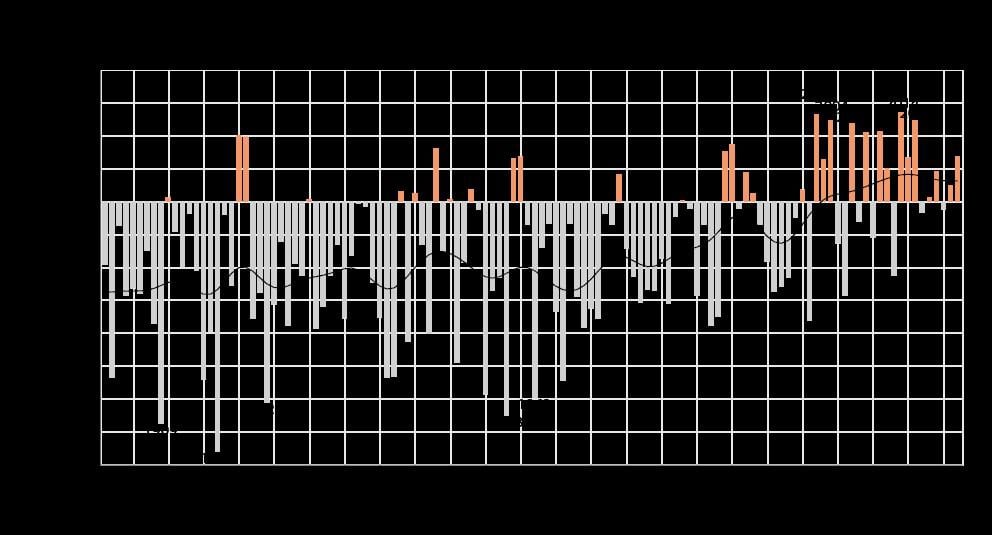
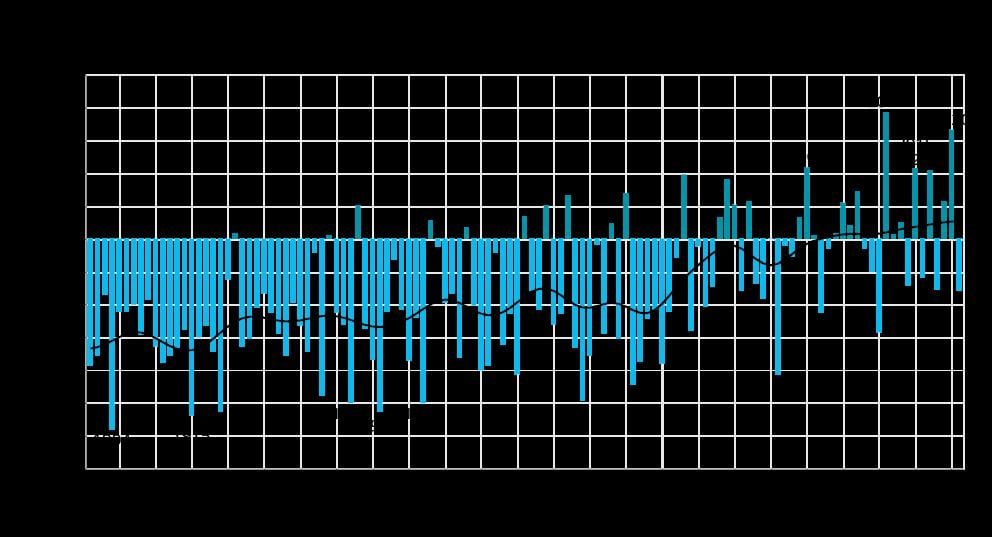
Figure 2.4 Annual temperatures for the Norwegian mainland 1901–2021, deviation from the 1991–2020 normal.
Source: Norwegian Meteorological Institute
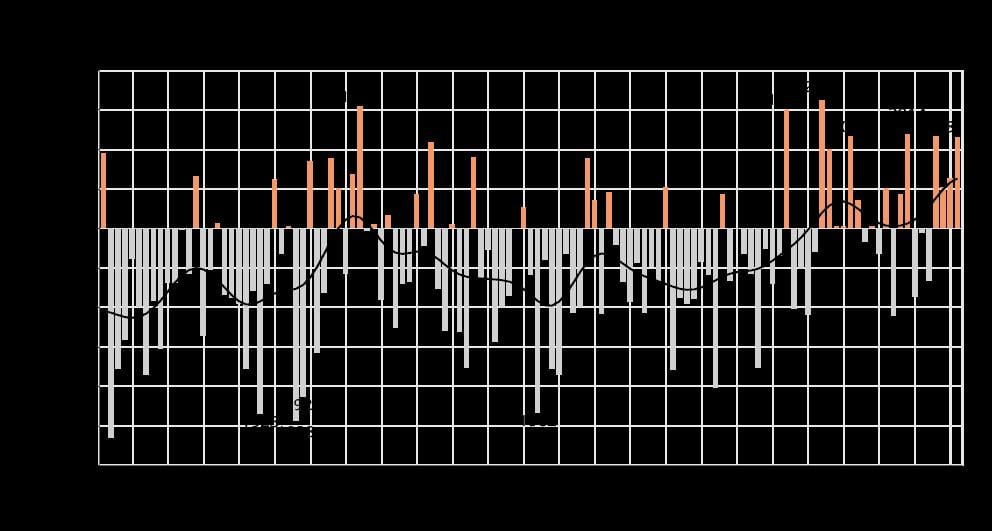
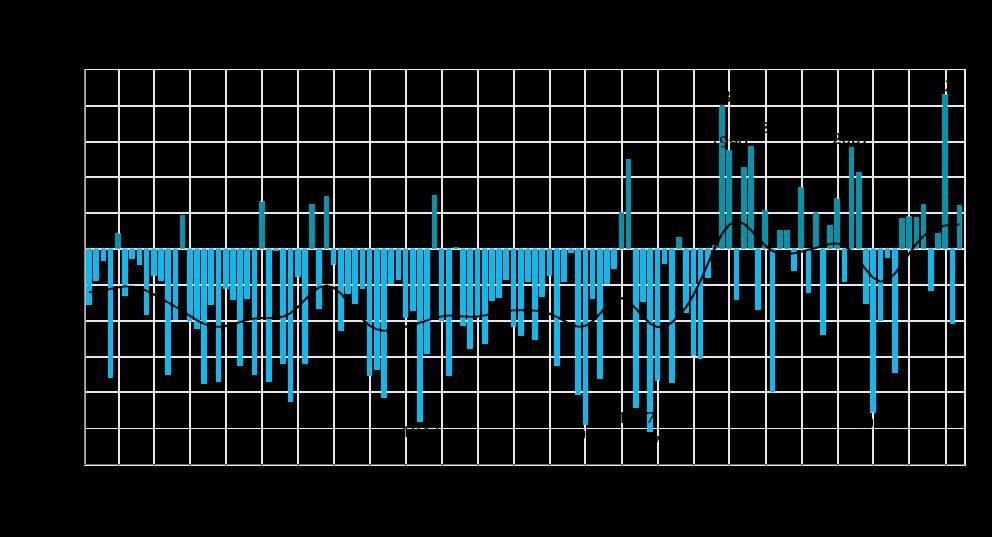
Figure 2.5 Spring temperatures for the Norwegian mainland 1901–2021, deviation from the 1991–2020 normal.
Source: Norwegian Meteorological Institute
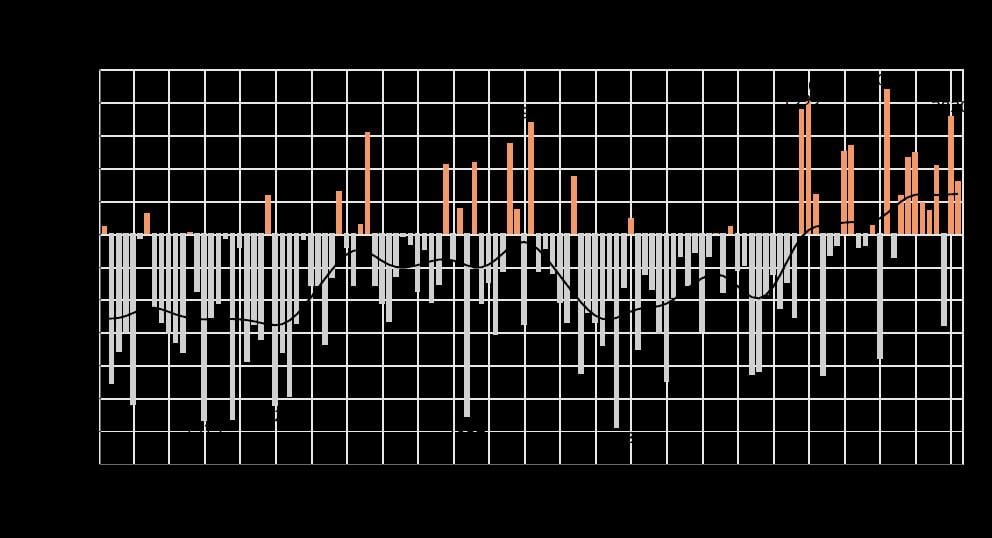
Figure 2.6 Summer temperatures for the Norwegian mainland 1901–2021, deviation from the 1991–2020 normal.
Source: Norwegian Meteorological Institute
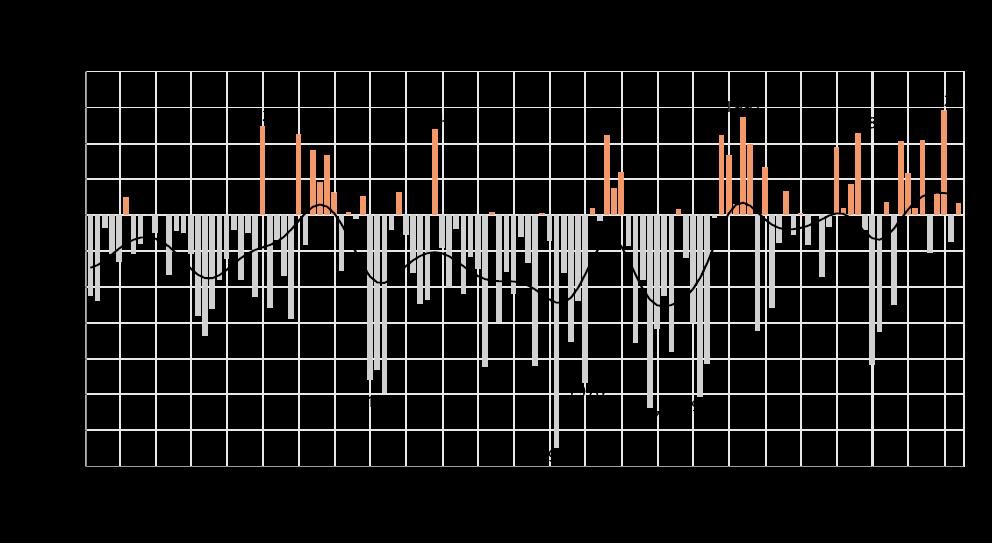
Figure 2.7 Autumn temperatures for the Norwegian mainland 1901–2021, deviation from the 1991–2020 normal.
Source: Norwegian Meteorological Institute
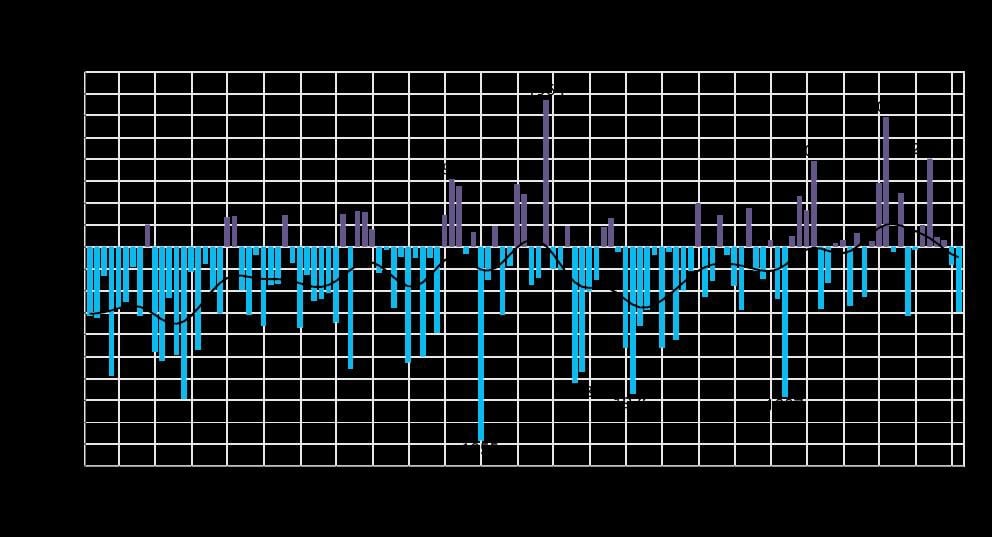
Figure 2.8 Winter temperatures for the Norwegian mainland 1901–2021, deviation from the 1991–2020 normal.
Source: Norwegian Meteorological Institute
2.5.1 Temperature trends
The figures (2.4 – 2.8) on annual and seasonal temperature anomalies show deviations (°C) relative to the 1991–2020 average. The smoothed black curves in Figures 2.4 to 2.8 show decadal scale variability, while the bars indicate values for the individual years.
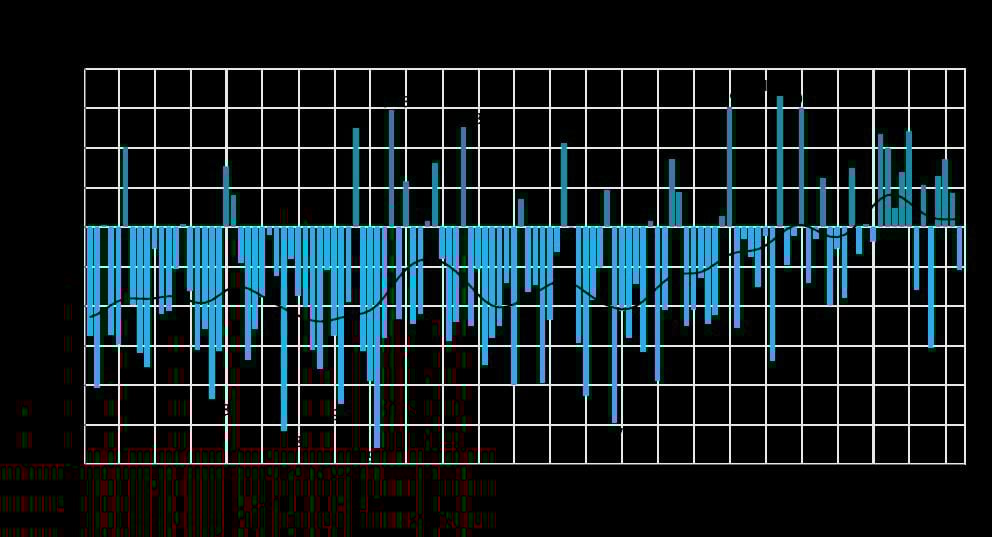
Figure 2.9 Annual precipitation for the Norwegian mainland 1901–2021, per cent of the 1991–2020 normal.
Source: Norwegian Meteorological Institute
Figure 2.10 Spring precipitation for the Norwegian mainland 1901–2021, per cent of the 1991–2020 normal.
Source: Norwegian Meteorological Institute
Figure 2.11 Summer precipitation for the Norwegian mainland 1901–2021, per cent of the 1991–2020 normal.
Source: Norwegian Meteorological Institute
Figure 2.12 Autumn precipitation for the Norwegian mainland 1901–2021, per cent of the 1991–2020 normal.

Source: Norwegian Meteorological Institute
Figure 2.13 Winter precipitation for the Norwegian mainland 1901–2021. In per cent of the 1991–2020 normal.
Source: Norwegian Meteorological Institute
2.5.1.1 Precipitation trends
The figures on annual and seasonal precipitation (Figures 2.9 to 2.13), show the values in per cent of the 1991–2020 average. The smoothed black curves in the figures show decadal scale variability, while the bars indicate values for the individual years.
2.5.1.2 Changes since the previous normal period
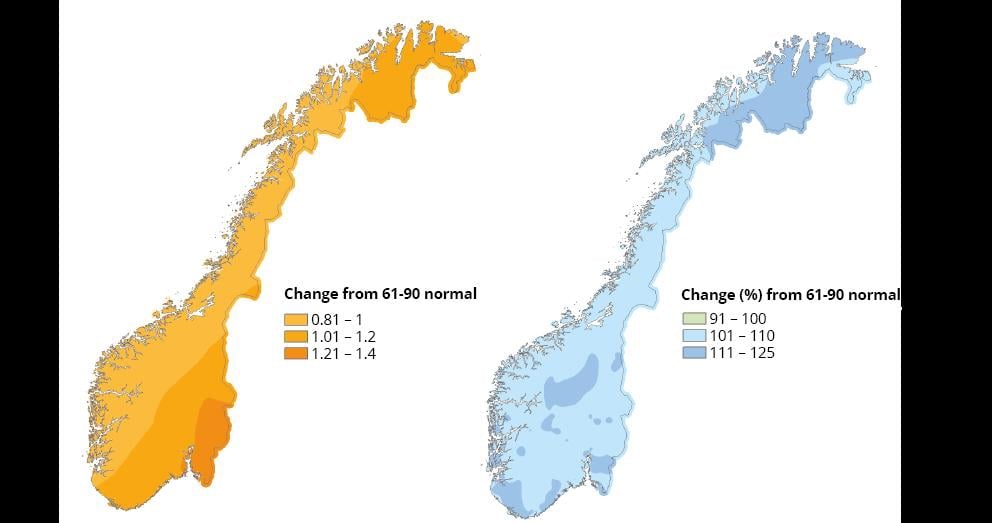
Both annual as well as for each season temperatures have increased since the previous normal period of 1961–1990, particularly in the winter season. The annual precipitation has also increased in this period, particularly in the spring season. When comparing the current normal period of 1991–2020 to the previous period 1961–1990, the annual mean temperature in Norway has increased about 1.0 °C. This increase has been largest in winter and in the south-eastern and north-eastern parts of Norway. The annual precipitation increased by about 8.5 per cent from the previous normal period to the current one. The largest increase is observed during spring and the smallest during autumn.
2.5.1.3 Svalbard
In Svalbard, observations from the two normal periods show increasing trends in temperature and precipitation. From the previous normal period to 1991–2020, the normal temperature at Svalbard Airport increased by 2.8 °C. The largest increase has been observed during the winter season, at about 4.4 °C. Observations indicate an increase in precipitation in Svalbard Airport of 15 per cent from the previous normal period. Figure 2.13 presents the temperature measurements from the nearby island Hopen, where measurements have been ongoing for an even longer time than in Svalbard Airport.
Figure 2.14 Changes in mean annual temperature and total annual precipitation between the 1961–1990 normal to the 1991–2020 normal.
Source: Norwegian Meteorological Institute
Figure 2.15 Annual mean temperatures as measured at Hopen meteorological station, with an averaged trend.

Source: Norwegian Meteorological Institute
Figure 2.16 Energy usage in Norway split by energy carrier. Excluding non-energy use and the offshore petroleum sector.
Source: Statistics Norway
2.6 Energy
2.6.1 Energy use and electricity production
Norway is in a unique position as regards renewable energy. Nearly all of Norway’s electricity production is based on renewable energy sources, and the proportion of energy use accounted for by electricity is considerably higher than in most other countries.
Historically, access to reasonably priced hydropower has shaped the energy use in Norway. Norway has a large energy-intensive manufacturing sector, and electricity is more widely used to heat buildings and water than in most other countries. Because renewable energy is the main source of energy usage, greenhouse gas emissions associated with stationary energy use are low in Mainland-Norway1.
Emissions to air from energy use are therefore mainly concentrated in manufacturing, transportation, construction, and agriculture where the use of fossil fuels is still widespread. Emissions to air from offshore petroleum activities largely originate from the combustion of natural gas and diesel in turbines, engines and boilers, flaring of natural gas for safety reasons, venting and diffuse emissions of gas, and storage and loading of crude oil.
Important drivers of energy use
There are various factors that influence the energy usage in Norway. Variations in energy use from year to year are often related to fluctuations in weather conditions and in the prices of energy and energy-intensive goods and services. Longer-term trends are related to population growth and other demographic factors, and to the rate of economic growth and structural changes in the economy.
Norway’s population has increased by 1.2 million since 1990 (28 per cent). Strong economic growth has resulted in a tripled GDP since 1990. Both demand for goods and services that use energy are growing steadily. However, final energy consumption has risen by only 14 per cent, demonstrating that the Norwegian economy gradually has become less energy-intensive.
Energy usage, by sector
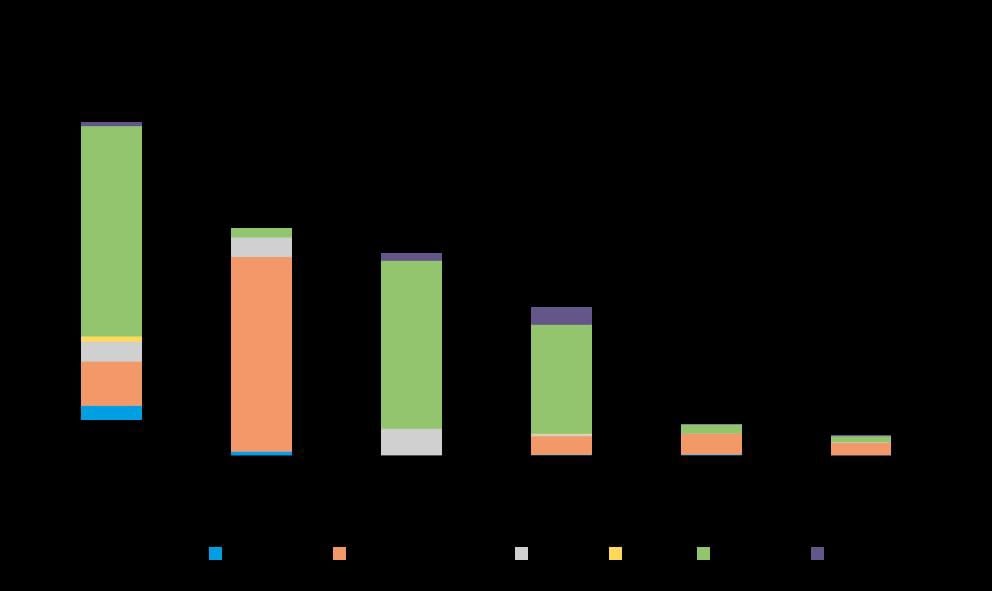
As seen in figure 2.16, energy use in absolute numbers is highest in the manufacturing and transport sectors, followed by households and services. Other sectors such as construction, agriculture, and fisheries account for only a small proportion of energy use. Energy use has increased by about 39 TWh since 1990, with most of the increase taking place before 2000. In 2021, the final energy consumption totaled 223.4 TWh, somewhat above the average since 2000. The average final energy consumption since the year 2000 is around 217 TWh.
Figure 2.16 shows that electricity is the dominant energy carrier, followed by petroleum products. Electricity dominates energy use in manufacturing, the household sector and service industries, while petroleum products account for a large proportion of energy use in sectors that make heavy use of transportation and machinery. District heating and natural gas account for only a small share of energy use, but this has been increasing in recent years. Consumption of district heating has risen, particularly in service industries and households, while there has been an increase in the use of gas in manufacturing industries and the transport sector. These energy carriers have been replacing fuel oil for heating and coal, coke and heavier petroleum products in industrial processes.
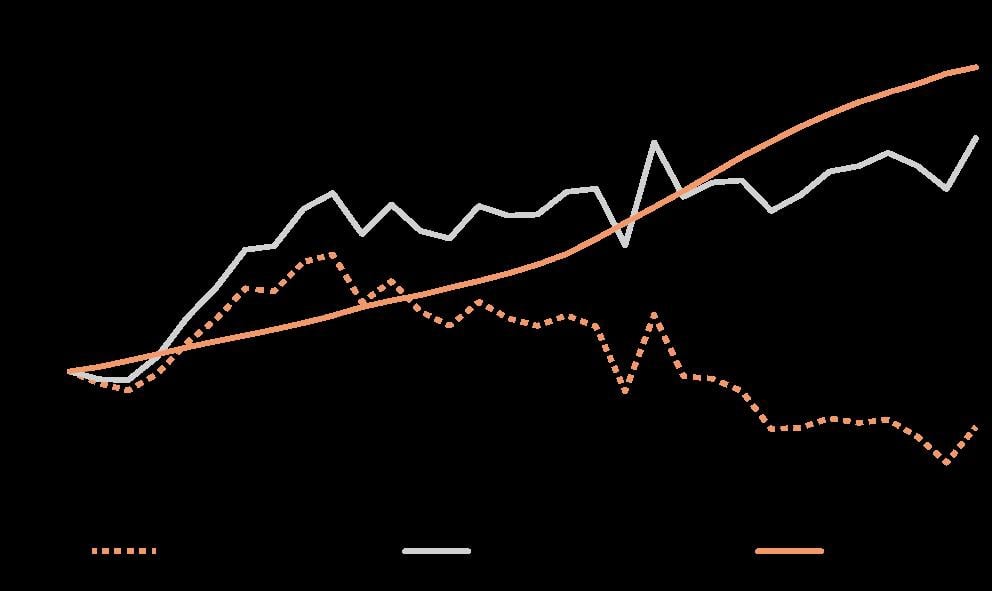
The energy intensity of the Norwegian economy has declined by 45 per cent since 1990. This indicates a decoupling of economic growth and energy use.
Per capita energy use has also declined in Norway during this period and was 4 per cent lower in 2021 than in 1990 (see figure 2.17).
Figure 2.17 Per capita energy use in Norway, shown as percentage change since 1990.
Source: Statistics Norway
Features of the Norwegian energy system
Renewable energy sources account for 98 per cent of Norwegian electricity production and the power sector has very low emissions compared to most other countries. In a normal year renewable electricity generation exceeds gross domestic consumption.
At the beginning of 2022, the installed capacity of the Norwegian power supply system was 38 744 MW with an estimated annual production of 154.8 TWh in a normal year.
Norway is now developing more renewable power production capacity than it has done for over 25 years. Wind power currently accounts for only a relatively modest share of production capacity, but accounted for 86 per cent of new power production in 2020.
Hydropower accounts for approximately 90 per cent of Norwegian power supply, and the resource base for production depends on the precipitation level in the given year. This is a distinctive feature of the Norwegian power system, compared to most power systems, where security of supply is secured by thermal power plants.
Norway has half of Europe’s reservoir storage capacity, and more than 75 per cent of Norwegian production capacity is flexible. Production can be rapidly increased and decreased at low cost.
The Norwegian power system is closely integrated with the other Nordic systems, both in physical terms and through market integration. In turn, the Nordic market is integrated with the rest of Europe through cross-border interconnectors with the Netherlands, Germany, the Baltic states and Poland.
In 2021, district heating deliveries totalled 6.6 TWh, four and a half times as much as in 2000. This is equivalent to about one sixth of the total energy consumption in households per year in Norway.
District heating can be produced using many different types of fuel. In 2021, almost 45 per cent of district heating was produced from waste and about 33 per cent from bioenergy. The use of petroleum products has declined since 2018. Mineral oil accounts for only 1 per cent of district heating production.
Bioenergy is an important energy source for heat production in Norway. Annual consumption of bioenergy in Norway rose from 10 TWh in 1990 to about 17.5 TWh in 2010. Since then, the consumption has varied and was about 19 TWh in 2021. Fuelwood consumption in households accounts for a large proportion of biofuel consumption, and totalled more than 6 TWh in 2021. The second largest user is the manufacturing sector, where chippings and other wood waste are used as fuel in production processes.
In 2021, total sales of gas amounted to 113 billion Sm³. Nearly all the gas produced is exported to other countries in Europe. Most of the domestic gas consumption in Norway is related to industrial use, while the use in households is limited.
2.6.2 Petroleum sector
Petroleum activities have given substantial impetus to Norway’s economic growth and has helped finance the Norwegian welfare system. The oil and gas sector is Norway’s largest in terms of value added, government revenue, investments and export value. Since oil and gas production started in the early 1970s, petroleum activities have contributed more than 18 000 billion (1 800 billion USD) in current NOK to Norway’s GDP. Related service and supply industries contribute to economic value creation as well. It is estimated that only half of the recoverable resources on the Norwegian continental shelf has been produced.
Figure 2.18 Macroeconomic indicators for the petroleum sector, 2021 The service and supply industry is not included
Source: National Accounts, National Budget 2023
Since production started, oil and gas have been produced from a total of 119 fields2 on the Norwegian shelf. At the end of 2021, 94 fields were in production: 71 in the North Sea, 21 in the Norwegian Sea and two in the Barents Sea.
In 2021, Norwegian petroleum production accumulated to 231 million Sm³ o.e. By way of comparison, total production was 226.5 million Sm³ o.e. in 2020 and 264.1 million Sm³ o.e. in the record year 2004. Both oil and gas production rose in 2021. Important reasons for this are higher production regularity of Norway’s oil fields and new fields coming on stream. Total production is expected to increase slightly until the mid-2020s, and then decrease over time.
Gas sales totalled 113,1 billion Sm³ (40 MJ) in 2021, an increase from the 2020 production of 110,2 billion Sm³. In light of the European energy crisis, the oil and gas producing companies and the government have taken steps to increase the gas production. An additional 9 BCM from 2021, or 8 per cent, is expected in 2022, bringing close to 100 TWh of extra energy to the European markets. In 2021, natural gas accounted for just under 50 per cent of total production by oil equivalents.
Like oil, gas is one of Norway’s most important export commodities. Domestic consumption of gas is low, and nearly all the gas produced is exported. An extensive network of subsea pipelines links Norway’s offshore gas fields and onshore terminals directly to recipient countries in Europe. In addition, liquefied natural gas (LNG) is shipped out from the Snøhvit field off Hammerfest on LNG carriers. Hammerfest LNG started producing again in early June 2022, after being shut down due to a fire at the LNG facility in September 2020.
About 40 per cent of Norway’s estimated gas resources have been produced and sold so far. Gas production is expected to remain high for the next 10 years.
Norway is the biggest producer of oil and gas in Europe, and as net exporter contributing significantly to European energy security. In 2021, Norway exported about 113 billion Sm3 gas. As the Hammerfest LNG plant was closed throughout 2021, all Norwegian gas was exported directly through pipelines to other countries in Europe. In large parts of Europe, gas is an important source of energy for heating, industrial use and for electricity generation in gas-fired power plants. Norwegian gas covers now up to 30 per cent of EU’s and UK’s gas consumption. The total length of the Norwegian gas pipeline network is about 8 800 kilometeres. Most Norwegian gas is sold on the European market is delivered to Germany, the UK, Belgium and France. Norwegian natural gas may support the phasing-out of coal in energy consumption in many of these countries, and may be an important co-player with renewables in the efforts to reduce emissions. Gas can be stored and serve as a flexible energy source for heat and electricity production, balancing supply and demand.
2.7 Transportation
Norway’s decentralised settlement gives rise to a relatively high demand for transport. In addition, the Norwegian economy is largely based on the extraction of raw materials and exports of goods, which means that there is a large volume of goods transport. The demand for rapid transport and more frequent deliveries of goods has also been increasing. The proportion of passenger transport by car and the proportion of goods transport by road and air have increased since 1990. About one third of the total Norwegian greenhouse gas emissions originated from transport in 2020. Road traffic was responsible for most of these emissions (17 per cent of total emissions in Norway in 2020), while domestic civil aviation, domestic navigation, railways and other means of transport were responsible for the rest. In the period from 1990 to 2020, greenhouse gas emissions from road transport increased by around 13 per cent, while emissions from domestic aviation, domestic navigation, railways and other means of transport increased by 37 per cent.
The emissions from the Norwegian road transport sector were approximately 12.8 per cent above 1990-levels in 2020. Road traffic emissions have decreased since 2015. The decrease is caused by a decrease in the use of fossil fuels. The use of diesel has decreased by 16 per cent and the use of gasoline has decreased by 26 per cent from 2015 to 2020. Due to the introduction of national sales mandates, fossil fuels have been replaced by biofuels, and the use of biofuels is one of the drivers behind the decrease in road transport emissions. The use of biofuels has increased by 171 per cent between 2015 and 2020.
The use of zero-emission vehicles is another important explanation behind the decreased road transport emissions in Norway. Statistics show that total mileage with diesel/gasoline vehicles has decreased by 6 per cent from 2005 to 2020, while the total electric vehicle (EV) mileage has increased by 435 per cent. Total EV mileage accounted for 10 per cent of the total mileage in 2020 and 12 per cent of the total passenger car mileage.
Statistics on the emissions of greenhouse gases from passenger cars show a 19 per cent decrease from 1990 to 2020. At the same time the emissions from vans and medium and heavy duty vehicles have increased by 78 per cent. Passenger cars accounted for 10 per cent of the total greenhouse gas emissions in Norway in 1990, while in 2020 the passenger cars accounted for 8 per cent. Heavy duty vehicles have become a larger source of emissions and have increased from 3 per cent of the total emissions in 1990 to 6 per cent in 2020.
Total mileage in Norwegian road transport has increased by 16 per cent from 2005 to 2020. The mileage has increased for passenger cars, as well as for vans, small lorries and heavy duty vehicles. The mileage for buses has decreased in the same period. For passenger cars, it is the EV mileage that drives the increase in total mileage, while the mileage with diesel/petrol passenger cars has decreased annually since 2016.
EVs had a 53 per cent market share for new passenger cars in 2020. The EV market share increased by 13 per centage points from 2019 to 2020 and follows a steady increase over the last years.
From 2020 to 2021 the preliminary figures on emissions from the Norwegian road transport increased by 3,8 per cent. The increase can be explained by reopening after the retreat of COVID-19. Still, the total mileage with diesel vehicles decreased and the EV market share for passenger cars increased to 63 per cent. The increased emissions can be explained by an increase in HDV mileage, where the EV mileage still is insignificant as a factor in the total emissions. The forecasts for Norway show an expected decrease in the road transport emissions. The EV market shares are likely to continue to increase and will contribute more heavily in the statistics on road transport emissions towards 2030. Biofuels are expected to play a less significant role for passenger cars, because of the tranisition to EVs. Biofuels may be allocated to other parts of the transport sector, where zero emission alternatives are less ready for market.
Emissions from farming and construction machines and other motorized equipment have increased by 78 per cent since 1990. Road and railway construction are important sources of emissions. For these vehicles, a transition into zero-emission vehicles is not expected in the short term. The emission trend follows the level of activity. Norway is conducting testing and demonstration activities in order to speed up the transition.
Since more than 80 per cent of railway traffic in Norway is electric, transportation by railways account for a marginal share of the total emissions. Thus, direct emissions from the railway sector results mainly from transportation of passenger and freight on the diesel driven tracks, during the construction of new railway infrastructure, and while operating and maintaining existing railway infrastructure.
Emissions from railways (including passenger and freight transport) have remained more or less constant at 50 000 tonnes CO2-equivalents in the last few years, accounting for about 0.1–0.3 per cent of the total emissions from the transport sector.
COVID-19 as well as the associated governmental interventions designed to curb and mitigate the virus resulted in an unparalleled transformation of mobility needs and travel behavior. For example, a survey3 of travel behaviors of commuters in Eastern Norway finds that people are expected to travel less often by train after the pandemic. According to the survey, people in Eastern Norway expect to reduce the number of train journeys by between 14 and 24 per cent compared to before the pandemic.
The main causes behind these changes are attributed to an increased use of the opportunity to work from home, and discomfort with crowding and/or traffic congestion. On average, travelers expect to work from home at least one day a week. Travelers aversion to crowds may contribute to work-related commuting spreading out more evenly throughout the day, reducing the peaks at rush hour. While flexible working life is expected to continue in the medium-long term, there is uncertainty about sensitivity to crowding and congestion. The changes in travel pattern after the pandemic could affect how train services will be organized in future.
Due to the COVID-19 pandemic, there has been a dramatic decline in domestic passenger transport (measured in passenger km) from 2019 to 2020. The overall decline was around 14 per cent, but the decline has been especially large for rail, air and sea transport, where passenger km fell by more than 50 per cent from 2020 to 2021. The decline in road transport was around 8 per cent in the same period.
Passenger traffic by railways nearly halved from 80.4 million passengers in 2019, to 42.5 million passengers in 20204. During the first quarter of 2022, the number of passengers has doubled when compared to the same period during the preceding year, while still amounting to only half of the number of passengers in the corresponding period in 2019. For domestic goods transport, there was an increase in tonnes-km from 2019 to 2020. For goods transport exclusive cabotage, the increase was 5.5 per cent, while for goods transport inclusive cabotage, the increase was 1.6 per cent.
Transportation of goods by railways has witnessed an increase during and after the pandemic. Freight transport, which had remained more or less constant during the pre-pandemic years (2017–19), increased by 8 per cent in 2020 and 12 per cent in 2021. There is a rising demand for freight transportation by railways.
Domestic civil aviation was greatly affected by the travel restrictions enforced due to COVID-19. Traffic decreased at most by 92 per cent (8–14 April 2020) compared to 2019 levels. Domestic air traffic was however maintained to a greater extent than international air traffic. This is due to the state procurement of a “minimum provision” on flight routes that prior to the pandemic were operated on commercial terms, as well as additional procurement on ordinary public service obligation routes (PSO routes). As a result of the pandemic greenhouse gas emissions from domestic civil aviation (including helicopters) reduced to about 1,6 per cent of total national emissions in 2020, from to 2.3 per cent in 2019 (1.19 of a total of 51.65 million tonnes of CO2 equivalents) in 2019.
The war in Ukraine and the energy-crisis that followed suit is also affecting domestic aviation in Norway. Primarily this is seen in the sharp price increase on jet fuel, and uncertain supply chains and capacity shortages that contribute to scarcity of important production materials. It does not, however, seem to have affected the domestic traffic levels significantly so far.
2.8 Industry
A considerable part of Norwegian manufacturing industries is based on natural resources. The historic availability of low-cost hydro power created a basis for the establishment of metal and fertilizer production. Some chemical production is based on the petroleum resources. Production of pulp and paper derived from the forest resources has also been considerable, and the fisheries have also given a base for industry. Norwegian industry therefore has a high share of production of raw materials and semi-manufactured goods including iron and steel, non-ferrous metals, chemicals, fertilisers, pulp and paper, mineral industries, food processing industries, building and construction industry.
Process emissions from industry were at about 18 per cent of the national totals in 2020. Process emissions have come down 45 per cent from 1990. Emissions from energy use of fossil fuels on this sector were about 5 per cent of the national totals.
2.9 Waste
The waste sector, with emissions of 1.4 million tonnes of CO2 equivalents in 2020, accounted for 2.8 per cent of the national GHG emissions. Most of the emissions from the waste sector originate from solid waste disposal on land (62 per cent).
Economic growth, or growth in production and consumption, is the key driver behind the growing waste volume. Even though the total amount of waste generated has increased, GHG emissions from the waste sector have generally decreased since 1990. This is due to the increase in material recycling and the ban issued in 2009 on disposing biodegradable waste to landfill. The central government authorities set the general framework, while municipalities and industry are responsible for waste collection and treatment.
In general, targets set in EU waste directives, such as EU targets for preparing for reuse and recycling of municipal waste, also apply for Norway owing to the EEA agreement.
2.10 Building stock and urban structure
According to Statistics Norway, there were a little less than 4.3 million buildings in Norway in 2021. The number of buildings in 2021 was 9 per cent higher than in 2010 and 24 per cent higher than in 2000. There were a little less than 1.6 million residential buildings in 2021 and the types of residential buildings are shown in table 2.2.
Table 2.2 Residential buildings by type of building
2018 | 2019 | 2020 | 2021 | |
|---|---|---|---|---|
Detached house | 1 167 548 | 1 171 237 | 1 174 481 | 1 177 792 |
House with 2 dwellings | 166 582 | 168 868 | 171 080 | 173 168 |
Row house, linked house and house with 3 dwellings or more | 166 722 | 169 662 | 172 198 | 174 445 |
Multi-dwelling building | 39 853 | 40 717 | 41 578 | 42 346 |
Residence for communities | 5 194 | 5 260 | 5 325 | 5 421 |
Total | 1 545 899 | 1 555 744 | 1 564 662 | 1 573 172 |
Source: Statistics Norway (Statbank table 03175)
Of the about 2.7 million non-residential buildings in 2021, 72 per cent were classified as holiday house, garage linked to dwelling etc. Other important types of non-residential buildings are agricultural and fishery buildings (19 per cent) and industrial buildings (4 per cent).
About 4.4 million, or a little more than 82 per cent of the residents in Norway lived in urban settlements in 2021. The urban population has increased by 50 per cent since 1990, 31 per cent since 2000 and 14 per cent since 2011. The area of urban settlements in 2021 was about 2 200 km2 and has steadily increased since 2013. A new method for defining urban settlements was implemented in 2013 and due to this, figures before and after 2013 are not directly comparable.
2.11 Agriculture
Stretched along the western side of the Scandinavian Peninsula, approximately one fourth of the surface area of Norway lies north of the Arctic Circle. The long coastline has an Atlantic, humid climate, while the inland climate is continental. Approximately 3 per cent of Norway’s land area is cultivated soil. The most suitable lands, approximately 1 per cent, is mostly allocated to arable crops, while grassland and ruminant livestock are allocated to regions less suitable for arable crops. While cultivated soil is a scarce resource in Norway, in addition we have extensive land that is suitable for pasture, and used extensively by reindeer husbandry and other ruminant livestock.
Figure 2.19 Historical levels of tree planting in the Norwegian forestry.

Source: Ministry of Agriculture and Food
Agriculture is estimated to account for about 8.4 per cent of Norway’s emissions of greenhouse gases. This particularly includes methane and nitrous oxide from animal husbandry and fertilisation. In addition, nitrous oxide emissions from cultivation of peatland are allocated to agriculture, while CO2 emissions from the same source are allocated to LULUCF. Use of fossil fuels for agricultural activities are allocated to other sectors, e.g. transport. The agricultural emissions have been reduced by approximately 5 per cent since 1990.
2.12 Forest
Forest and wooded land cover about 12 million hectares and constitute approximately 38 per cent of the land area in Norway. The most widespread species are Norway spruce (47 per cent), Scots pine (33 per cent) and birch (18 per cent). Approximately 88 per cent – that is 120 000 properties – of the forest area is privately owned. The majority of the forest holdings are farm and family forests.
The historical levels of tree planting in the Norwegian forestry are shown in figure 2.19. Norway spruce (picea abies) and Scots pine account for more than 95 per cent of the seedlings. Broadleaves and foreign tree species are only planted to a small extent.
2.13 Other circumstances
Fishing has always been an important basis for settlement and employment along the Norwegian coast. The Norwegian fishing and aquaculture industries are among Norway’s most important export industries today, currently supplying seafood to consumers in more than 130 countries worldwide. This makes Norway the second largest exporter of seafood globally. According to the United Nations Food and Agriculture Organization (FAO), the consumption of seafood worldwide is expected to increase substantially over the next 20 to 30 years.
In addition to climate change, fisheries and aquaculture are affected by various types of pollution. With an increase in the level of CO2 in the atmosphere, the ocean absorbs an increasing level of CO2, causing ocean acidification. Ocean acidification is a source of concern for marine ecosystems and fisheries. Important focus areas for fisheries are improving fuel efficiency and finding alternatives to fossil fuel for engine power. Significant reductions have been achieved by replacing refrigerants that have high global warming potential, used in onboard cooling systems, by climate neutral ones.
Technological developments and improved fishing methods, equipment and vessels have made possible a restructuring of the fishing-fleet, which today catches much larger quantities per fisherman, per vessel and per trip than a few decades ago. This has reduced the general fuel-consumption of the fleet. For fish farming, optimizing feed use and feed composition play an important part in reducing the climate impact of salmon aquaculture products. Also, in the fish farming industry, electricity is increasingly used as power for service vessels and farms instead of fossil fuel.