5 Projections and total effect of policies and measures
5.1 Introduction
This chapter presents projections of greenhouse gas emissions in Norway for the years 2025, 2030 and 2035. In compliance with the UNFCCC reporting guidelines for National Communications and Biennial Report, it is a “with measures” projection, based on policies and measures implemented as of midyear 2022. The previously reported projections were in the fourth Biennial report (BR4).
5.2 The baseline scenario
Norway’s greenhouse gas emissions depend on the actions of a few hundred thousand businesses and several million people. Projections seek to capture these underlying developments and tendencies on the basis of, inter alia, economic, technological and population factors. Key assumptions underpinning the projections are discussed in Box 5.1. In the projections, the current climate policy is continued, both in Norway and abroad. This implies that the scope and rates of the CO2 tax and other taxes are maintained at 2022-level and that the observed EU ETS prices for future delivery at that time are applied. The 2022-level of funding to technology development, for example via Enova, is maintained. The climate policies have also been strengthened, see Box 5.2.
Hence, the projections illustrate how Norwegian greenhouse gas emissions may develop under a continuation of current policy measures. The estimates as to how current policy, in Norway and the rest of the world, will influence future emissions are subject to considerable uncertainty, and such uncertainty increases the further into the future the projections are extended. Not only are economic outlooks and future population developments uncertain, but the same applies to access to low- and zero-emission technology and the costs of adopting such technology. The effects of policy are particularly sensitive to access to low- and zero-emission technology and the costs of adopting such technology. Most of these technological developments take place outside Norway.
The projections are neither a description of the Government’s goals, nor do they capture the effects of new policies or new policy measures that could be launched in future. Adopted goals without accompanying policy proposals, and policy initiatives that have yet to be operationalised in the form of regulations, parliament resolutions or binding agreements, etc., are not incorporated into the projections.
Box 5.1 Assumptions underpinning the projections
About every other year, the Ministry of Finance prepares projections of emissions to air, drawing on input from a number of other institutions. The projections reported in this National Communication were presented in the national budget for 2023.
The projections are based on the Norwegian greenhouse gas inventory and the National Account of Statistics Norway, which constitute the descriptive underpinnings of the economic model SNOW (see chapter 5.3). More detailed calculation models supplement the SNOW model calculations.
The projections are based on a number of assumptions, including, inter alia, a continuation of current climate policy. Other key assumptions may be summarised as follows:
- The long-term macroeconomic analyses from the national budget for 2023.
- Implemented and adopted policies and measures by summer 2022 are maintained, including the scope and rates of the taxes on emissions of GHGs.
- The EU ETS price is assumed to increase from an average of NOK 700 for 2022 to about NOK 1 000 per tonne of CO2 in 2030, at 2018 prices.
- The projections of emissions from oil and gas production have been prepared by the Norwegian Petroleum Directorate and are based on reporting from oil companies. The majority of CO2 emissions relate to energy production at the installations. Emissions from the construction and installation phase, maritime support services and helicopter transport are included under other industries.
- Road traffic emissions. The Norwegian Environment Agency has developed a projection model based on Statistics Norway’s model for calculating national road traffic emissions to air. It is assumed that the share of electric cars will increase to 100 per cent of new car sales in 2025. Traffic activity is assumed to trace population developments. Emissions per kilometre driven by cars based on fossil energy carriers are assumed to decline by just over 1 per cent per year. Biofuel blending is set at 13 per cent in real terms from 2023 in accordance with the requirement.
- Electricity consumption in energy-intensive industries is estimated to increase somewhat, in line with the power market analyses of the Norwegian Water Resources and Energy Directorate (NVE). The consumption of households and other industries is estimated to remain at about the current level.
The Norwegian Environment Agency prepares, on the basis of activity data from NIBIO, agricultural emissions projections. Some efficiency improvement is assumed, thus reducing emissions per produced unit.
Table 5.2 Information on updated greenhouse gas projections under a “with measures” scenario.
GHG emissions and removalsb | GHG emission projections | ||||||||||||
|---|---|---|---|---|---|---|---|---|---|---|---|---|---|
(kt CO2 equivalents) | (kt CO2 equivalents) | ||||||||||||
Base year (1990) | 1990 | 1995 | 2000 | 2005 | 2010 | 2015 | 2019 | 2020 | 2025 | 2030 | 2035 | ||
Sectord,e | |||||||||||||
Energy | 18 785 | 18 785 | 21 142 | 23 098 | 23 912 | 25 647 | 24 648 | 23 203 | 22 258 | 19 778 | 15 937 | 13 438 | |
Transport | 10 056 | 10 056 | 10 999 | 11 951 | 12 998 | 14 041 | 14 343 | 12 724 | 11 929 | 10 628 | 8 591 | 6 735 | |
Industry/industrial processes | 15 377 | 15 377 | 12 436 | 13 220 | 11 669 | 9 102 | 9 317 | 9 259 | 9 224 | 8 749 | 8 469 | 8 166 | |
Agriculture | 4 812 | 4 812 | 4 749 | 4 586 | 4 569 | 4 361 | 4 538 | 4 518 | 4 510 | 4 599 | 4 711 | 4 733 | |
Forestry/LULUCF | -10 542 | -10 542 | -15 444 | -18 641 | -20 329 | -23 716 | -13 101 | -16 436 | -20 332 | -15 876 | -16 540 | -13 605 | |
Waste management/waste | 2 403 | 2 403 | 2 306 | 2 066 | 1 797 | 1 788 | 1 642 | 1 382 | 1 351 | 1 005 | 865 | 758 | |
Other (specify) | |||||||||||||
Gas | |||||||||||||
CO2 emissions including net CO2 from LULUCF | 24 148 | 24 148 | 22 655 | 23 085 | 22 585 | 21 536 | 32 049 | 25 903 | 20 418 | 20 829 | 14 344 | 12 777 | |
CO2 emissions excluding net CO2 from LULUCF | 35 097 | 35 097 | 38 508 | 42 149 | 43 342 | 45 691 | 45 590 | 42 785 | 41 197 | 37 111 | 31 294 | 26 805 | |
CH4 emissions including CH4 from LULUCF | 6 405 | 6 405 | 6 588 | 6 351 | 5 919 | 5 757 | 5 403 | 4 922 | 4 899 | 4 622 | 4 440 | 4 266 | |
CH4 emissions excluding CH4 from LULUCF | 6 236 | 6 236 | 6 420 | 6 176 | 5 741 | 5 576 | 5 219 | 4 735 | 4 712 | 4 452 | 4 271 | 4 091 | |
N2O emissions including N2O from LULUCF | 4 343 | 4 343 | 3 952 | 4 067 | 4 312 | 2 729 | 2 759 | 2 648 | 2 579 | 2 610 | 2 636 | 2 639 | |
N2O emissions excluding N2O from LULUCF | 4 106 | 4 106 | 3 712 | 3 819 | 4 062 | 2 471 | 2 502 | 2 390 | 2 319 | 2 373 | 2 395 | 2 391 | |
HFCs | 0 | 0 | 98 | 369 | 549 | 894 | 963 | 934 | 810 | 587 | 364 | 329 | |
PFCs | 3 895 | 3 895 | 2 314 | 1 518 | 955 | 238 | 146 | 175 | 161 | 173 | 175 | 173 | |
SF6 | 2 099 | 2 099 | 580 | 891 | 297 | 69 | 68 | 68 | 74 | 63 | 74 | 42 | |
NF3 | |||||||||||||
Other (specify) | |||||||||||||
Total with LULUCFf | 40 890 | 40 890 | 36 188 | 36 281 | 34 616 | 31 223 | 41 387 | 34 650 | 28 940 | 28 883 | 22 032 | 20 225 | |
Total without LULUCF | 51 432 | 51 432 | 51 631 | 54 922 | 54 945 | 54 939 | 54 488 | 51 086 | 49 273 | 44 759 | 38 572 | 33 830 | |
Sources: Statistics Norway, Norwegian Environment Agency, NIBIO and Ministry of Finance.
Abbreviations: GHG = greenhouse gas, LULUCF = land use, land-use change and forestry.
a In accordance with paragraph 25 of these guidelines, at a minimum Parties shall report a ‘with measures’ projection and they may also report ‘without measures’ and ‘with additional measures’ projections. If a Party chooses to report a ‘without measures’ and/or ‘with additional measures’ projection, it is to use table 3 and/or 4 below, respectively. If a Party does not choose to report a ‘without measures’ or ‘with additional measures’ projection, then it should not include table 3 or 4 in its national communication.
b Emissions and removals reported in these columns should be as reported in the most recent annual inventory submission available and consistent with the emissions and removals reported in the table on GHG emissions and trends provided in accordance with section IV of these guidelines. Where the sectoral breakdown differs from that reported in the GHG inventory, Parties should explain in their national communication how the inventory sectors relate to the sectors reported in this table.
c Parties may include indirect CO2 emissions in historical GHG emissions and in GHG emission projections and shall indicate this in a custom footnote below.
d Parties should include projections on a quantitative basis starting from the most recent inventory year and for subsequent years that end in either a zero or a five, extending at least 15 years from the most recent inventory year.
e The most recent inventory year.
f A year that ends in either a zero or a five following the most recent inventory year, extending at least 15 years from the most recent inventory year.
g In accordance with paragraph 31 of these guidelines, projections shall be presented on a sectoral basis, to the extent possible, using the same sectoral categories as used in the GHG inventories. This table should follow, to the extent possible, the same sectoral categories as those listed in paragraph 14 of these guidelines; namely, to the extent appropriate, the following sectors should be considered: energy, transport, industry/industrial processes and product use, agriculture, forestry/LULUCF, waste management/waste, other sectors and cross-cutting.
h To the extent possible, the following sectors should be used: energy, transport, industry/industrial processes and product use, agriculture, forestry/LULUCF, waste management/waste and other sectors (i.e. cross-cutting), as appropriate.
i Parties may choose to report total emissions with or without LULUCF, as appropriate.
* Indirect CO2 emissions are included in the historical GHG emissions and in the GHG emission projections.
Table 5.3 Greenhouse gas emissions in Norway by EU-ETS and ESR. Mill tonnes CO2 equivalents
1990 | 2005 | 2021 | 2025 | 2030 | 2035 | |
|---|---|---|---|---|---|---|
GHG emissions in Norway | 51.4 | 54.9 | 49.1 | 44.8 | 38.6 | 33.8 |
EU-ETS emissions | 23.2 | 27.7 | 23.8 | 22.2 | 19.0 | 16.6 |
– Oil and gas extraction | 7.2 | 12.9 | 11.5 | 10.8 | 8.0 | 6.3 |
– Manufacturing industries and mining | 15.3 | 13.7 | 10.7 | 10.2 | 9.8 | 9.1 |
– Other sources1 | 0.7 | 1.1 | 1.5 | 1.2 | 1.2 | 1.2 |
ESR emissions | 28.2 | 27.2 | 25.4 | 22.6 | 19.5 | 17.2 |
– Transport2 | 12.0 | 15.0 | 15.4 | 13.5 | 10.9 | 8.9 |
Of this. road traffic | 7.4 | 9.5 | 8.7 | 7.1 | 5.3 | 3.9 |
– Agriculture | 4.8 | 4.6 | 4.6 | 4.6 | 4.7 | 4.7 |
– Other sources3 | 11.4 | 7.6 | 5.4 | 4.8 | 3.9 | 3.6 |
LULUCF | -10.5 | -20.3 | -14.0 | -15.9 | -16.5 | -13.6 |
Emissions including LULUCF | 40.9 | 34.6 | 35.1 | 28.9 | 22.1 | 20.2 |
Mainland Norway | 43.2 | 40.9 | 37.0 | 33.3 | 30.0 | 27.1 |
1 Includes ETS emissions from energy supply and aviation.
2 Includes non-ETS emissions from road transport, navigation, fishing, non-ETS aviation, motor equipment etc.
3 Includes non-ETS emissions from manufacturing industries, oil and gas extraction and energy supply, and emissions form heating and other sources.
Sources: Statistics Norway, Norwegian Environment Agency, NIBIO and Ministry of Finance.
Box 5.2 Climate policy
Projections of environmentally harmful emissions to air were last presented in the national budget for 2021, and were based on the level of policy measures from the summer of 2020. Climate policy has been tightened since then:
- The general rate of CO2 tax on mineral products (petrol, mineral oil, natural gas and LPG) has been increased from NOK 571 per tonne of CO2 in 2020 to NOK 766 per tonne of CO2 in 2022. The tax on HFC and PFC has been increased correspondingly. In addition, a tax on waste incineration has been introduced, and the tax exemption for natural gas and LPG used in the greenhouse industry has been abolished.
- The CO2-component in the one-off registration tax for passenger cars and vans has been increased. Simultaneously, the road usage tax has been reduced.
- The government is co-funding two full scale CCS projects, capturing and storing a total of 0.8 mill. tonnes of CO2 annually.
- The government has introduced a requirement stating that public acquisitions of passenger cars are to be limited to zero emission vehicles. A ban on fossil fuels used in temporary heating for buildings under construction has also been implemented.
- Enova has received considerably funds. A governance agreement for the period 2021–2024 attaches even more weight to climate and technological development than the previous agreement. Supported initiatives include, inter alia, zero- and low-emission solutions for shipping and charging/fuelling stations for zero-emission cars.
Greenhouse gas emissions are estimated to decline from 49.1 million tonnes CO2 equivalents in 2021 to 33.8 million tonnes in 2035, see table 5.1 and table 5.2. Emissions will in such case be close to 15 million tonnes of CO2 equivalents lower in 2035 than in 2021. A little more than half of the reduction is expected to occur in the ESR sector. About half of this reduction is expected within road traffic – mostly due to a strong increase in the share of zero-emission vehicles.
The projections of emissions (not for LULUCF) use Statistics Norway’s general equilibrium model SNOW and table 5.3 lists the key macroeconomic projections underpinning the Norwegian emission projections.
The high population growth in the period 2007–2014 of about 1.2 per cent annually has the past couple of years come somewhat down. From 2017 to 2030 the population is estimated to increase by 0.7 per cent annually on average. All in all the population is estimated to increase by around 9 per cent during the projection period.
The wholesale price of electricity has increased significantly in 2022. The price is expected to gradually decrease over the next years. By 2026 it is expected to level off somewhat above the average of the past few years.
In the baseline scenario, the EU ETS price is assumed to increase to NOK 739 by 2025, measured in 2018-prices. In 2035 the price will increase to NOK 1015 measured in 2018-prices.
Table 5.4 Summary of key variables and assumptions used in the projections analysis.
Key underlying assumptions | Historicalb | Projected | |||||||||
|---|---|---|---|---|---|---|---|---|---|---|---|
Assumption | Unit | 1990 | 1995 | 2000 | 2005 | 2010 | 2015 | 2020 | 2025 | 2030 | 2035 |
Gross domestic product | billion NOK. Fixed 2015-prices | 1 701.4 | 2 044.2 | 2 442.3 | 2 723.0 | 2 855.6 | 3 111.2 | 3 254.3 | 3 682.7 | 3 885.1 | 4 059.5 |
Of which mainland Norway | billion NOK. Fixed 2015-prices | 1 303.0 | 1 492.9 | 1 790.4 | 2 059.7 | 2 331.9 | 2 614.1 | 2 740.5 | 3 101.9 | 3 399.2 | 3 661.1 |
Of which petroleum activities and ocean transport | Billion NOK. Fixed 2015-prices | 398.3 | 551.3 | 651.9 | 663.4 | 523.7 | 497.1 | 513.8 | 580.8 | 485.9 | 398.4 |
Consumption | billion NOK. Fixed 2015-prices | 609.2 | 697.5 | 849.8 | 1 016.3 | 1 186.0 | 1 354.3 | 1 343.3 | 1 568.5 | 1 756.7 | 1 970.4 |
Gross fixed capital formation | billion NOK. Fixed 2015-prices | 329.6 | 368.1 | 477.0 | 585.0 | 630.2 | 741.5 | 835.6 | 898.5 | 961.7 | 1 031.0 |
Of which mainland Norway | billion NOK. Fixed 2015-prices | 235.0 | 262.5 | 349.9 | 441.1 | 464.7 | 540.7 | 655.0 | 728.1 | 817.1 | 833.1 |
Of which petroluem activities and ocean transport | billion NOK. Fixed 2015-prices | 94.6 | 105.5 | 127.1 | 143.9 | 165.6 | 200.8 | 180.6 | 170.4 | 144.6 | 197.8 |
Population | Thousands | 4 249.8 | 4 370.0 | 4 503.4 | 4 640.2 | 4 920.3 | 5 214.0 | 5 391.4 | 5 559.8 | 5 685.5 | 5 803.5 |
Number of persons employed | Thousands | 2 047.8 | 2 112.4 | 2 314.9 | 2 319.3 | 2 552.3 | 2 709.6 | 2 792.4 | 2 949.2 | 2 994.9 | 3 003.1 |
Oil price e | USD per barrel | 23.7 | 17.0 | 26.2 | 55.1 | 8.3 | 53.4 | 43.4 | |||
Gas price | USD per MMBtu | 2.3 | 2.3 | 3.0 | 5.1 | 6.9 | 6.3 | 3.0 | |||
Sources: Statistics Norway and Ministry of Finance.
a Parties should include key underlying assumptions, as appropriate.
b Parties should include the historical data used to develop the greenhouse gas emission projections reported.
c The most recent inventory year.
d A year that ends in either a zero or a five following the most recent inventory year, extending at least 15 years from the most recent inventory year.
e Custom footnote. Prices for oil and gas for 2025, 2030 and 2035 are equal to those used in National budget 2023. But since these assumptions are not published in the budget proposal it is not appropriate to publish them here either.
5.2.1 Details of the estimates
The estimate for greenhouse gas emissions in 2030 has been revised downwards by 6.4 million tonnes of CO2 equivalents (about 14 per cent) compared to the previous projection (2018 white paper on long-term perspectives for the Norwegian economy, presented in NC7/BR3). Most of this reduction relates to lower EU ETS emissions, especially from oil-and gas production. Most of this reduction is due to expected electrificaton of power supply delivered via cables from land. In the non-ETS sector projected emissions are reduced by 1 million tonnes CO2-equivalents (about 5 per cent). The main part of this downward revision is in road traffic. This is due to increased use of biofuels and a faster development of zero-emission cars than previouisly projected. Since the previous report Statistics Norway has revised historical emissions. This also impacts future emissions. Seen in isolation, the adjustment adds about 05 million tons to the emission level in the transport sector in 2030.
In 2017, electric vehicles (EVs) accounted for about 23 per cent of new passenger car sales. In 2021 sales increased to about 65 per cent, and the share is expected to increase further in 2022. The projections assume that almost all passenger cars will be non-fossil fuel cars by 2025. In the previous reported projections, the share was expected to increase gradually towards 75 per cent in 2030. The share of zero-emission vans has also been significantly revised upwards since the previous projection. Strong incentives combined with more rapid technology improvements are the main reasons for the adjustments. Slightly stronger technological development is also assumed for heavy goods vehicles, but this happens later and more slowly than for light vehicles. There are currently few zero-emission solutions and those that are available involve very high costs. Uncertainty about the outlook is high.
Emissions from domestic shipping and fisheries have declined significantly in recent years. The decline in emissions is likely to be linked to lower activity for offshore supply vessels, a changeover to less emission-intensive fuel and the adoption of new technology. To some extent it may also be the result of a higher percentage of vessels having bunkered fuel abroad. The projections assume that the observed decline is permanent and that further technological development and the enhancement of policy measures over the last few years will cause emissions to keep declining in the projection period.
In addition to Enova devoting considerable resources to supporting the introduction of zero- and low-emission technology in the maritime sector. A number of contracts that require zero- or low-emission solutions have been concluded. It has been assumed, inter alia, that about one third of Norway’s ferries will have batteries on board by the end of 2021.
Emissions from the use of fossil oils in the heating of businesses and households have declined by more than 80 per cent since 1990. The prohibition against the use of mineral oil in the heating of buildings, which came into force in 2020, means that the heating of homes, public buildings and commercial buildings will have no emissions form use of mineral oil in the future. Emissions from non-EU ETS energy supply stem from the burning of fossil carbon in waste and the use of fossil energy carriers in minor energy plants. In the projections, emissions from non-quota energy supply is expected to be reduced by around 20 per cent (about 0,2 million tonnes) by 2035. The reduction is linked partly to the establishment of capture and storage of CO2 on the waste incineration plant at Klemetsrud in the latter part of this decade.
Landfill emissions are estimated to continue to decline as the result of the prohibition against the depositing of wet organic waste. Agricultural emissions are estimated to remain fairly stable in coming years.
Projections for the forest and land use sector, carried out by the Norwegian Institute for Bioeconomy (NIBIO), show a continued high net uptake from the sector. Since the peak in 2009, there has been a decline in annual reported net admissions. In the projections, the decline in annual net admissions is estimated to continue over the next decades. From the middle of the century, annual net intake is expected to increase again.
5.2.2 Other emissions
Emissions of long-range air pollutants, nitrogen oxides (NOX), sulphur dioxide (SO2), ammonia (NH3), fine particulate matter (PM2,5) and non-methane volatile organic compounds (NMVOC) are regulated under the Gothenburg Protocol. These pollutants are spread across borders via the atmosphere and give rise to, inter alia, acidification, particle concentrations that are detrimental to health, as well as the formation of tropospheric ozone.
Figure 5.1 Emissions of SO2 and NMVOC within the scope of the Gothenburg Protocol. ktonnes.

Figure 5.2
Figure 5.3 Emissions of NOx and NH3 within the scope of the Gothenburg Protocol. ktonnes
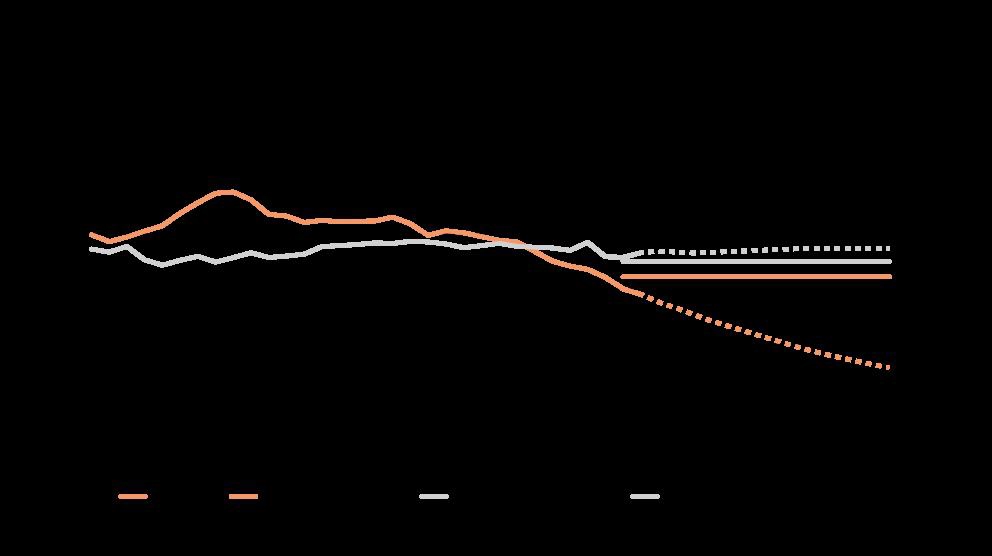
Figure 5.4 Emissions of PM within the scope of the Gothenburg Protocol. ktonnes
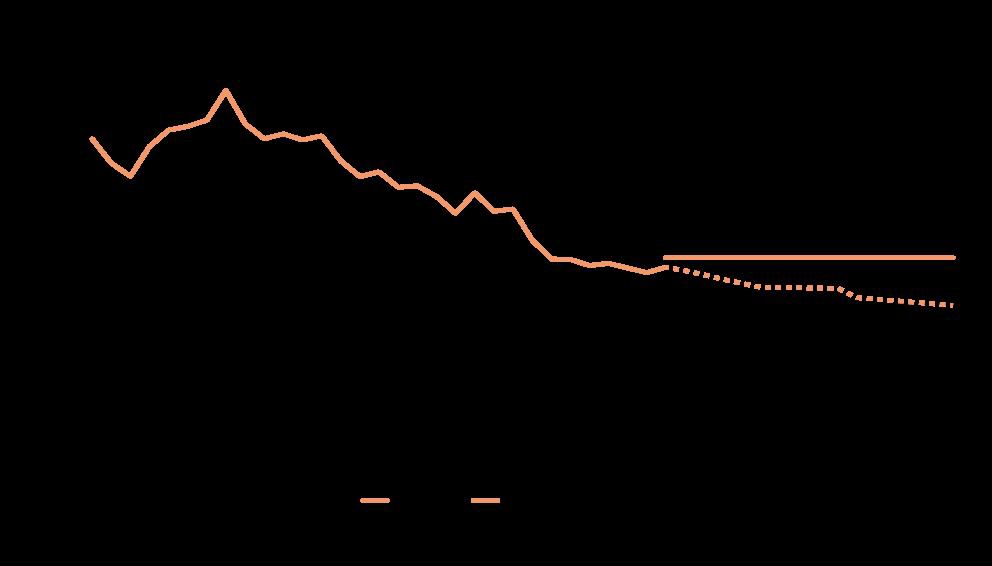
1The straight lines show the emission commitments under the Gothenburg Protocol.
Sources: Statistics Norway, Norwegian Environment Agency and Ministry of Finance.
Table 5.5 Emissions of long-range transboundary air pollutants. ktonnes
1990 | 2005 | 2021 | 2030 | 2035 | |
|---|---|---|---|---|---|
NOX | 199.2 | 211.5 | 145.2 | 96.5 | 78.3 |
SO2 | 49.5 | 23.0 | 15.9 | 15.3 | 14.7 |
NMVOC | 325.7 | 250.2 | 148.0 | 115.3 | 108.5 |
NH3 | 29.8 | 30.5 | 29.4 | 29.9 | 29.9 |
PM 2.5 | 41.4 | 37.1 | 24.1 | 20.8 | 19.8 |
Sources: Statistics Norway, Norwegian Environment Agency and Ministry of Finance.
Norway has under the Gothenburg Protocol committed to reducing NOX emissions by 23 per cent by 2020, relative to the emission level in 2005. In the current account this means an emissions cap for 2020 in excess of 156 000 tonnes. Consequently, NOX emissions are estimated to be well below the commitment in 2020.
Since 1990, nitrogen oxide (NOX) emissions have declined by 27 per cent, as a result of the exhaust gas requirements having been tightened in several rounds. Domestic shipping emissions have declined considerably since 2007 as the result of, inter alia, measures funded with support from the Business Sector’s NOx Fund and the gradual phase-out of older engines with high emissions. NOX emissions are projected to decline to 78 300 tonnes in 2035. The estimated decline has to do with lower road traffic emissions as the result of stricter exhaust gas requirements, especially for heavy goods vehicles, and a steep increase in the number of zero- and low-emission vehicles. The use of biofuels may result in higher NOX emissions. Emissions from oil and gas activities are expected to decline somewhat in the projection period.
In 2015, non-methane volatile organic compounds (NMVOC) emissions were l 60 per cent lower than in 2001, which was the year emissions peaked. The reduced NMVOC emissions are primarily the result of lower emissions from the loading and storage of crude oil offshore. The commitment under the Gothenburg Protocol calls for emissions in 2020 to be less than 149 600 tonnes. Emissions were marginally higher than the commitment in 2020, but further reductions bring emissions below the commitment. Emissions are projected to decline to 108 500 in 2035.
Sulphur dioxide (SO2) emissions have declined by almost 70 per cent since 1990. Since 2007, emissions have been lower than the commitment in the first Gothenburg period, which was for a maximum of 22 000 tonnes. In 2020, emissions were 15 700 tonnes. The projections estimate a continued modest decline in SO2 emissions. Emissions are well below the Gothenburg commitment for 2020 of 21 700 tonnes.
The emissions account for ammonia (NH3) has previously indicated that Norway was meeting its commitment in the first Gothenburg period of 23 000 tonnes. In 2013, emission figures back to 1990 were revised upwards by 10–20 per cent as the result of a new calculation method for emissions from livestock manure. In 2020, emissions were 28 600 tonnes. Emissions are estimated to remain relatively stable at slightly below 30 000 tonnes towards 2035, whilst the Gothenburg commitment for 2020, which is based on emissions in 2005, is 28 000 tonnes. Thus, projections indicate that Norway emissions may remain somewhat above commitments. Upon the revision of the Gothenburg Protocol in 2012, Norway committed to reducing fine particulate matter (PM2,5) emissions by 30 per cent in 2020, compared to the level in 2005. In the current emissions account, this corresponds to an annual emissions cap of about 28 000 tonnes from 2020. From 1990 emissions have fallen by about 40 per cent to 24 800 tonnes in 2020. This was well below commitments. Projections indicate that emissions will decline further by about 20 per cent within 2035.
5.2.3 Fuel sold to ships and aircraft engaged in international transport
Table 5.5 summarises the historic and projected emissions of fuel sold to ships and aircraft engaged in international transport. These emissions are reported separately and are not included in previous totals. The historical emissions are based on the Energy balance from Statistics Norway. This has been revised and one of the changes is that marine bunkers were increased for the years 2013 onwards, particularly for the latest years. The projections of emissions from international marine and aviation are mainly a prolongation of the historical trends. The CO2 emissions from use of international bunker in aviation are, using expert judgement, projected to increase from 2019 by 1.7 per cent per annum. That is half of the average annual growth during the period 1990–2019. The projection was made using 2019 as base year as the activity was strongly reduced in 2020 due to the pandemic. Emissions from fuel sold to ships are projected to decrease by 1.4 per cent per annum, half of the annual decrease 1990–2020) during the projection period.
Compared with the previous biennial report, the emissions have been adjusted upwards because of the revised consumption date for marine bunkers.
Table 5.6
Table 5.7 Emissions (CO2, CH4 and N2O) from international bunker. Mill tonnes CO2 equivalents
1990 | 2000 | 2010 | 2020 | 2025 | 2030 | 2035 | |
|---|---|---|---|---|---|---|---|
Total international bunkers | 2.9 | 3.7 | 3.0 | 1.5 | 2.8 | 2.9 | 3.0 |
Aviation | 0.7 | 0.9 | 1.3 | 0.5 | 1.9 | 2.1 | 2.2 |
Marine | 2.4 | 2.9 | 1.7 | 1.0 | 1.0 | 0.9 | 0.9 |
Sources: Statistics Norway, Norwegian Environment Agency and Ministry of Finance.
5.3 Uncertainty
The projections illustrate how Norwegian greenhouse gas emission can evolve when current climate policy is being continued. The picture is uncertain, among others because the development of new climate friendly technology will influence on what a continuation of current policy means for future emissions. Such uncertainty is greater the longer into the future the projections extend. Moreover, the uncertainty is not only related to developments in, and access to, low- and zero-emission technology and the costs of implementing such technology but also to the economic outlook and future population developments.
Between 1990 and 2021, the population growth in Norway has been 27 per cent. A considerable part of this increase comes from immigration, mainly from EU-countries. Calculations done by Statistics Norway show that CO2 emissions could have been around 6 per cent lower in 2030 if the population growth had been more in line with the EU-average of about 2 per cent since 2005.11 In the same analysis, Statistics Norway estimates that a supply shock that causes oil and gas prices to fall by 24 per cent could cause Norwegian CO2 emissions to increase by 8 per cent in 2030. Lower prices on fossil fuels causes emissions in the mainland economy to increase more than the fall in emissions from lower production of oil and gas. A potential international set back that causes Norwegian export prices, including on oil and gas, to decline by 25 per cent is estimated to reduce CO2 emissions by 14 per cent in 2030.
5.4 Methods and models
The Norwegian GHG inventory has been prepared in accordance with the revised UNFCCC reporting guidelines on annual inventories (decision 24/CP.19). This includes using the Global Warming Potential (GWP) for greenhouse gas emissions from the IPCC’s fourth assessment report. The projections are consistent with historical data.
The emission projections for Norway are based on various sources and methods. The projections for energy-related emissions are largely based on simulations with the macroeconomic model SNOW supplemented by available micro studies. Projections of CO2, CH4 and NMVOC-- emissions from the petroleum sector are based on information collected by the Norwegian Petroleum Directorate. Projections of emissions of greenhouse gases than CO2 are mainly based on sector- and plant-specific information, collected by the Norwegian Environmental Agency from the industries concerned.
5.4.1 The SNOW-model
SNOW-model is a computable general equilibrium (CGE) model. The model gives a detailed description of the structures of economic policy, production and consumption in the Norwegian economy. Agents are represented as optimising individuals who interact with each other in national and international markets. Factor prices and prices of deliveries to the domestic markets are all determined by market equilibria. Consumption and savings result from the decisions of the representative household, which maximizes welfare, given income from labour, capital and natural resources.
The model is a recursive dynamic, integrated economy and emissions model that can project energy-related and process emissions based on macroeconomic assumptions. The model gives a detailed description of the production and consumption structures in the Norwegian economy. The model specifies 46 industries (42 private production sectors and 4 government sectors), classified to capture important substitution possibilities with environmental implications. The model includes 20 consumption goods with detailed description of use of energy and transport. Moreover, detailed description of governmental taxes and transfers such as environmental policy, trade policy, subsidies, tax rates, and real government spending is also included.
Producer behaviour is characterised by perfect competition. The main production factors are material inputs, labour, three types of real capital, five types of energy goods (incl. biomass) and various types of polluting and non-polluting transport services. For most commodities, a certain degree of substitution between production factors is assumed, depending on their relative prices and the exogenous assumptions about factor productivity developments. Labour and capital are perfectly mobile between sectors. In each sector, real capital formation is determined so that expected return on capital equals an exogenously given return on capital.
We model a small, open economy, which considers the world market prices and interest rate as exogenous. Domestic and foreign goods are assumed to be imperfect substitutes (Armington assumption). Together with a given balance of payments, the real exchange rate will be determined consistent with domestic consumption.
The model provides a relatively detailed description of the markets for energy and transport. A detailed emission module is incorporated into the SNOW model, turning it into an effective tool for assessing environmental consequences of changes in economic activity. Both emissions related to energy use and emissions from industrial processes are modelled. Energy-related emissions are linked in fixed proportions to the use of fossil fuels, with emission coefficients differentiated by the specific carbon content of the fuels. A recent addition is a detailed modelling of electric vehicles, which allows us to study the policies targeting emissions from transport. Various environmental and climate policy instruments are included, e.g., emission quotas, taxes and subsidies.
For reference scenario, a dynamic recursive variation of the model is applied with endogenous labour supply (via labour-leisure choice) and exogenous path for government spending.
The intended field of application of the model is climate policy, tax reforms and sustainable public finance. The main input data categories and data sources are National accounts and official statistics on emissions. Outputs of the model are prices and quantities for all goods (monetary values, based on national accounts), GHG emissions, emissions of other pollutants, energy consumption, tax revenues and government spending. Gases covered by the model is domestic emissions of twelve pollutants (six GHG and six air pollutants) disaggregated by source and sector. The base year is 2018 with respect to trends, but the trends are calibrated to start at the emission level in 2020. Adjustments were made for sectors particularly affected by the pandemic. The model can be run to 2100. Population projections are from Statistics Norway. The model structure is top-down with bottom-up features. There are nested CES functions in production and consumption.
Projections of emissions of greenhouse gases other than CO2 are mainly based on sector- and plant-specific information, assessed by the Norwegian Environment Agency.
SNOW is a general model that simultaneously accounts for behavioural responses to a variety of policy instruments and other drivers. The model’s relatively rich variety of policy variables will give synergies between policies and measures (PaMs) when projecting emissions. However, the model only operates with, for example, average marginal tax rates and does not capture the richness of all policy instruments (e.g. differentiation in vehicle registration tax). One of the strengths of using an integrated macroeconomic and emission model like SNOW is that the model provides consistency between long-term economic forecasts and emission projections. The usual caveats of computable general equilibrium top-down approaches apply. One shortcoming of SNOW is its poor specification of new technologies (abatement options) in industries, but this is under development. Another shortcoming is the need for the outputs to be supplemented by the results from more disaggregated models and expert judgment.
5.4.1.0.1 GHG emissions from the petroleum sector
The projections of emissions from oil and gas production have been prepared by the Norwegian Petroleum Directorate and are based on reporting from oil companies. Emissions from the petroleum sector in Norway are well documented. The industry’s own organisation, the Norwegian Oil and Gas Association, has established a national database for reporting all releases from the industry, called EPIM Environment Hub (EEH). All operators on the Norwegian continental shelf report data on emissions to air and discharges to the sea directly in EEH. Oil companies operating on the Norwegian shelf must annually submit data and forecasts for their respective operated fields, discoveries, transport- and land facilities. The reporting includes corporate financial data, projects, resource volumes and forecasts for production, costs and environmental discharges/emissions. The Norwegian Petroleum Directorate (NPD) quality-assures and organises the data reported by the companies. The NPD also prepares its own estimates and classifies the resources based on its own assumptions. Based on the information from the companies and NDP’s own assumption, the NPD updates the resource accounts for the Norwegian shelf and prepares forecasts for production, costs and emissions.
Emissions of CO2 mainly derive from offshore generation of electricity, gas pipeline compressors, and from flaring for safety reasons. In addition, mobile facilities linked to a permanent facility in production generate some emissions.
In the projection it is assumed that the emissions are a function of the infrastructure in place and not the production level. Many of the new installations is expected to use existing infrastructure for processing and pipeline transport. Once in production the power demand at an installation is almost constant, and so are the CO2 emissions. The emission projections thus take into account that emissions are a consequence of the time the installation is producing and to a much lesser extent the production on the installation. Only new installations with new gas-fired power generation will result in higher emissions and correspondingly lower emissions when an installation is closed down.
5.4.1.0.2 GHG emissions from road traffic
Emissions of CH4, N2O, CO2 from road traffic are projected in an Excel spreadsheet model. The model is based on data from the model used by Norway to estimate historical emissions from road traffic (Handbook of Emissions Factors (HBEFA) v3.3 using activity data for 1990–2017). Emissions are projected using time series estimates for the following parameters: population growth, km driven per person for different vehicle classes, emission factors, biofuel blending, and a factor that adjust for the discrepancy between fuel sales and bottom-up estimates of fuel consumption.
For heavy vehicles (buses and HGV), the trend in the emission factor is specified directly at an aggregated level. For light duty vehicles, the trend in the emission factor is specified by technology (gasoline, diesel, plug-in hybrids, and zero emission vehicles such as electric cars). The fraction in the vehicle stock of different technologies is estimated using simple stock models for passenger cars and other light duty vehicles.
Projection data:
- Activity, population – Statistics Norway.
- Activity, km driven per person for different vehicle classes – expert estimates based on historical trends and background data in the National Transport Plan
- Emission factors: trend by vehicle class (or by technology for light duty vehicles) – expert estimates
- Biofuels: adopted quota obligations
- Adjustment for the discrepancy between fuel sales and bottom-up estimates of fuel consumption – expert estimates
5.4.1.0.3 Agriculture sector
The projections are based on the same estimation methodologies of CH4, N2O and NH3 from agriculture as for calculation historical emissions. Descriptions of the side models used to project emissions for enteric CH4 from cattle and sheep, CH4 and N2O from manure management and the NH3 model are given annually in chapter five of the Norwegian National Inventory Report (NIR) and Annex IX to the NIR. Calculations are in Excel.
The projection of CH4, N2O and NH3 emissions from agriculture are based on projected development in animal stock, share of concentrate in fodder, milk yield, mineral fertiliser use and assumption about the development in cultivation of peat land. The emission trends are dependent on the expected development in number of inhabitants and expected food consumption trend, and scenarios for agriculture polices nationally.
Activity assumptions are given by the Ministry of Agriculture and Food for animal population development and increase in animal manure substitutes for synthetic fertiliser (1 kg manure-N: 0.45 kg fertilizer-N).
In addition, expert estimates are used for area cultivated organic soils, development depending on cultivation of new areas, share of concentrates and milk yield (trend from Norwegian Institute of Bioeconomy Research).
5.4.1.0.4 Solid waste disposal
The emissions model for estimating methane from Solid Waste Disposal Sites (SWDS) uses the model in the IPCC 2006 Guidelines. From 2009 deposition of wet organic waste on landfills is prohibited. The effect of this measure and all other policy measures concerning the waste sector are taken into account in the baseline scenario. The effect of licensing requirements for collection and combustion of methane from landfills is also taken into account in the projections. This implies that in the projection, only minor amounts of paper and sewage sludge are deposited, and this corresponds with Statistics Norway’s waste account. In the projection, about 15 per cent of produced methane is recovered. This equal to the actual recovery in 2016.
Descriptions of the model for calculating CH4 from landfills are given annually in chapter 7 of the Norwegian NIR.
5.4.1.0.5 Emissions of N2O, PFCs and SF6 from industrial processes and product use
Projections of N2O emissions from nitric acid production are based on information about the N2O reducing technology as of 2017 and expanded production in a new production line. In the projections, the emissions from the existing production lines are assumed to have an efficiency rate of 0.2 per cent per annum from 2017. This efficiency rate is lower than in the years 2010–2017. The assumed emissions of N2O per tonne nitric acid produced in the newest production line is based on information from the plant. N2O emissions from production of mineral fertilizers are also Included in the projections. The emissions derive from phosphate used in production of mineral fertilizers.
The emission projections of perfluorocarbons (CF4 and C2F6) from aluminium production reflect increased production at two sites. It is assumed that the emissions per tonne aluminium produced are as reported by the plants for 2017.
HFC emissions: Emission projections of HFCs are based on the HFC emission inventory and current regulations.