4 Policies and measures
4.1 Policymaking process
4.1.1 Overview
Norway’s climate policy is based on the objective of the United Nations Framework Convention on Climate Change, the Kyoto Protocol and the Paris Agreement. The scientific understanding of the greenhouse effect set out in the reports from IPCC is an important factor in developing climate policy. Thus, the policies and measures reported are seen as modifying long-term trends in anthropogenic greenhouse gas emissions and removals.
Climate change and emissions of greenhouse gases have featured on the policy agenda in Norway since the late 1980s. Today, Norway has a comprehensive set of measures covering almost all emissions of greenhouse gases as well as removals.
Norway has ratified the Paris Agreement and is working towards its overall objectives, including by:
- contributing to efforts to hold the increase in the global average temperature to well below 2 °C above pre-industrial levels and pursuing efforts to limit the temperature increase to 1.5 °C above pre-industrial levels, recognizing that this would significantly reduce the risks and impacts of climate change
- increasing the ability to adapt to the adverse impacts of climate change and foster climate resilience and low greenhouse gas emissions development, in a manner that does not threaten food production
- making finance flows consistent with a pathway towards low greenhouse gas emissions and climate-resilient development
Norway has ambitious climate targets that are set out in various policy documents: the updated cross-party agreement on climate policy from 2012 (published as a recommendation to the Storting (Innst. 390 S (2011–2012)) in response to the white paper on Norwegian climate policy from the same year (Meld. St. 21 (2011–2012)); the white paper New emission commitment for Norway for 2030 – towards joint fulfilment with the EU (Meld. St. 13 (2014–2015)) and a subsequent recommendation to the Storting (Innst. 211 S (2014–2015)); the documents relating to the Norwegian Parliaments consent to ratification of the Paris Agreement (Innst. 407 S (2015–2016) and Prop. 115 S (2015–2016)); and the Climate Change Act that the Norwegian Parliament adopted in June 2017. The previous government’s strategy for fulfilling the 2030 climate target (Meld. St. 41 (2016–2017) was issued in June 2017 and a climate action plan for 2021–2030 was issued in January 2021 (Meld. St. 13 (2020–2021). The Støre Government presented a climate status and plan for the 2030 climate target in a separate attachment to Prop. 1 S (2022–2023) in October 2022.
Box 4.1 Norway’s climate targets
- Under the Paris Agreement, reduce emissions by at least 55 per cent by 2030 compared to 1990.
- As an interim goal on the road to net zero emissions and the low-emission society, the government has set a transition target for the entire economy in 2030. This is formulated in the government platform as a target to cut Norwegian emissions by 55 per cent compared to 1990.
- Be climate neutral from 2030.
- Become a low-emission society by 2050 and reduce emissions by 90–95 per cent compared to 1990.
4.1.1.1 NDC for 2030
Following the decision 1/CMA.3 Glasgow Climate Pact paragraph 29, Norway revisited the 2030 target in its Nationally Determined Contribution (NDC). In November 2022, Norway communicated its updated NDC to reduce emissions by at least 55 per cent by 2030, compared to 1990 levels. Norway’s NDC is economy wide, covering all sectors and greenhouse gases. Norway’s intention is to fulfil this target in cooperation with the EU. The updated 2030 target of at least 55 per cent has not yet been updated in the Norwegian Climate Change Act, but the Government will make a proposal to Parliament in order to amend the Act to update the target in line with this NDC.
Iceland and Norway entered into an agreement with the EU in October 2019 to cooperate to fulfil their respective climate targets. Under the agreement, Norway will take part in EU climate legislation from 2021 to 2030. The legislation is designed to achieve emission reductions of at least 40 per cent compared with the 1990 level. This is an overall target for all EU member states, Iceland and Norway and for all sectors.
The EU’s climate policy has three main pillars. The first pillar of EU climate policy deals with ETS emissions. The EU Emissions Trading System applies to the largest emission sources within Norwegian manufacturing industries and the petroleum industry. The cap, or number of emission allowances in the system, is being gradually reduced to achieve a reduction of 43 per cent in emissions in 2030 compared with 2005. This is an overall reduction for all installations covered by the EU ETS. Emissions from European aviation have been included in the EU ETS since 2012.
The second pillar of EU climate policy deals with emissions not covered by the EU ETS, but by the effort sharing regulation (ESR). Norway’s target for the ESR emissions under its agreement with the EU is a 40 per cent reduction by 2030 compared with the 2005 level. This has been translated into a binding emission budget with emission ceilings for each year in the period 2021–2030. The legislation allows for each country’s emission budget to be met through a combination of emission reductions within the country and transfers of emission units from other European countries.
The third pillar of EU climate policy deals with the Land Use, Land Use Change and Forestry (LULUCF) sector. This includes anthropogenic emissions and removals of greenhouse gases from land use, land use change and forestry. The factors that particularly influence emissions and removals are the level of harvesting (relative to harvest level modelled in the forest reference level FRL), land-use change such as deforestation and afforestation, and the natural spread of forest and scrub. The EU’s climate legislation includes accounting rules for emissions and removals in the LULUCF sector. Norway has an obligation to ensure that overall greenhouse gas emissions from the LULUCF sector do not exceed removals (this is known as the ‘no debit’ rule). According to the regulation, the obligation can be fulfilled by implementing measures in the national LULUCF, and/or through extra national reductions in non-ETS emissions, for example in the transport and agriculture sectors, and/or through purchasing buy emission units from EU countries or Iceland.
When Norway and the EU concluded their agreement, the target both parties had communicated to the UN was still a 40 per cent reduction in emissions by 2030 compared with the 1990 level. The EU will be making necessary amendments to its the legislation to ensure that the new and enhanced 2030 climate target is achieved. Once the legislation has been adopted by the EU, Norway will need to consider whether the updated legislation should also be made applicable in Norway, and if so on what conditions. The legislation will not apply in Norway until the Storting has given its consent.
Norway is not mentioned in the proposed amendments to the EU legislation. From the proposed targets for ESR emissions for comparable countries, it is likely that Norway can get a reduction target of 50 per cent compared to 2005 should the climate agreement with the EU be updated. Such a target will translated into a binding emission budget with emission ceilings for each year in the period 2021–2030. For information on the climate status and plan for the 2030 climate target, see Box 4.2
Norway seeks to fulfil the updated NDC of least 55 per cent reductions through the climate cooperation with the European Union. Final accounting towards the target may depend on any further arrangements in Norway’s cooperation with the European Union and Iceland, including in the European Trading System. If necessary, Norway will use voluntary cooperation under Article 6 of the Paris Agreement to fulfil the part that goes beyond what is achieved through the climate cooperation with the European Union.
Box 4.2 Annual climate status and plan
The Støre Government presented a climate status and plan in a separate attachment to Prop. 1 S (2022–2023) in October 2022. The climate status and plan will be updated annually and summarises the government’s climate policy. The climate status and plan has not yet been debated by the Norwegian Parliament.
Norway will report on its progress made and implementing its NDC in its first Biennial Transparency Report in 2024. Since Norway and the EU both have individual NDCs/targets under the Paris Agreement, the cooperation is envisaged to include transfers and acquisitions of ITMOs and follow the guidance under Article 6 of the Paris Agreement. See box 4.3 for further information.
ESR emissions
Chapter 5 of this National Communication presents updated projections of GHG emissions. Table 5.2 shows that the projections for the ESR emissions are estimated to decrease from 24.8 million tonnes CO2 equivalents in 2020 to 20.5 million tonnes CO2 equivalents in 2030. The projections for the period 2021–2030 are about 13 million tonnes CO2 equivalents higher than the given emission budget under the current EU legislation for the ESR sector (40 per cent reduction in 2030 compared to 2005).
Correspondingly, the emissions are about 21 million tonnes CO2 equivalents higher than the estimated emission budget Norway may get should the climate agreement with the EU be updated and Norway gets a reduction target of 50 per cent compared to 2005, based on the proposal from the EU Commission. The Støre-government is therefore making provisions for, and is planning to, reduce the ESR emissions by 50 per cent by 2030.
In the budget proposal for 2023, the Støre-government proposes climate measures that can reduce the GHG emissions. It is estimated that measures proposed in the budget in aggregate can reduce the non-ETS emissions by 9.3–9.9 million tonnes of CO2 equivalents in the period 2021–2030. The majority of this, about 5.6 million tonnes CO2 equivalents can come from increased climate taxes. 3.3 million tonnes CO2 equivalents can come from increased mandatory biofuels turnover for road traffic and the introduction of mandatory biofuels turnover for non-road machinery. The government has also decided to establish Bionova, a financial mechanism for supporting climate measures in the agricultural sector. It is estimated that Bionova could reduce the emissions within the agricultural sector by 0–0.6 million tonnes CO2 equivalents and a further 0.4 million tonnes CO2 equivalents could come as a result of strengthening Enova (see chapter 4.3.3.2).
A further 10.4 to 11 million tonnes of CO2 equivalents in the period 2021–2030 can come from policies and measures that are under consideration The estimates are uncertain, but further increases in the mandatory biofuels turnover for road traffic and non-road machinery combined with the introduction of mandatory biofuels turnover for domestic shipping and fisheries could result in emission reductions of 4.5 million tonnes of CO2 equivalents Further measures in the agricultural sector can reduce the emissions by 3.4–4.0 million tonnes CO2 equivalents An additional 2.5 million tonnes CO2 equivalents can come from several public procurement processes to promote the development and deployment of zero- and low-emission solutions in the transport sector.
In total, the upper estimates of proposes climate measures and policies and measures that are under consideration could add up to 20.3 million tonnes of CO2 equivalents With these measures the estimated emission reductions for ESR emissions would be close to 50 per cent by 2030.
These policies and measures have not been adopted. The potential effect is visualized in figure 5.3.
Land Use, Land Use Change and Forestry sector (LULUCF)
New projections for the LULUCF sector indicate that Norway is likely to have a total annual net emission (i.e. a gap to the “no debit rule”). The annual gap may be 3.2 million tonnes of CO2 equivalents in the period 2021–2025 if Norway uses the Managed forest land flexibility mechanism which the LULUCF-regulation (2018/841) allows for. Without this mechanism, the total annual emissions gap for the forestry and land use sector may be 6.7 million tonnes of CO2 equivalents
Box 4.3 Pursuing cooperation with the EU on implementing the respective NDCs
Norway pursues cooperation with the EU on implementing their respective NDCs. Norway, Iceland and Liechtenstein have been participating in the EU ETS since 2008. For the period from 1st January 2021 to 31st December 2030, Norway is pursuing its cooperation with the EU on implementing their respective NDCs and have together with Iceland agreed to implement the EU Effort Sharing Regulation (ESR) and LULUCF Regulation in accordance with the EEA Agreement Protocol 31.
Cooperation on implementation of the NDC enables Norway to have a higher level of ambition and thus gives a benefit to the atmosphere. In 2019, the EU, Iceland and Norway agreed on cooperation to fulfil our respective prevailing NDCs. Since then the EU, Iceland and Norway have updated their NDCs and strengthened their respective targets substantially. The EU is updating its legislation to be in line with the updated NDC. This process is ongoing. The main elements of the European legislation will need to be agreed before any cooperation between EU and Norway on implementation of the updated NDCs can be finalised.
Details concerning the possible flow of internationally transferred mitigation outcomes ((ITMOs), any accounting approaches, national arrangements, registries, other reporting requirements including related to adaptation finance and overall mitigation of global emissions, will be addressed in future reporting under the Paris Agreement.4.1.1.2 Transition target for 2030
As an interim goal on the road to net zero emissions and the low-emission society, the government has set a transition target for the entire economy in 2030. This is formulated in the government platform (Hurdal) as a target to cut Norwegian emissions by 55 per cent compared to 1990. This means that the government has a national target to transition both the EU-ETS and the ESR sectors. The purpose is for the entire Norwegian economy to transition in the direction of a low-emission society.
The Norwegian transition goal and our international targets complement each other. The target from the Hurdal platform will not be registered as a NDC under the Paris Agreement, or enshrined in the Climate Act.
The transition target will be achieved through an ambitious and responsible climate policy, and we are dependent on both Norwegian and international technological development to be able to achieve it. Which specific measures are to be implemented will be assessed on an ongoing basis based on what is appropriate in the long term transition perspective, and will be assessed in consultation with the business community. The aim is to promote a sensible long-term transition for the entire economy and promote the technological development on which we depend. Emphasis must be placed on Norwegian business and industry being competitive in the future, and that it is assumed that Norway will still have a surplus in the electric power balance. The goal must not entail an ineffective climate policy or disproportionately expensive measures.
Many technology projects can have a long and unpredictable lead time, but provide significant emission reductions in the long term. In the case of large point sources, for example, it will be possible to get significant contributions to Norwegian emission reductions as old technology is replaced with new. This means that one cannot expect a linear reduction in emissions. Electrification of fossil energy use and new power-intensive industries require sufficient power generation and grid capacity. Electrification projects on the continental shelf will be assessed on a case-by-case basis, and must take into account the consequences for the power system and access to affordable renewable power for other industries and households.
4.1.1.3 Climate neutrality by 2030
In connection with its consent to ratification of the Paris Agreement, the Norwegian Parliament asked the Government to work on the basis that Norway is to achieve climate neutrality from 2030. This means that from 2030, Norway must achieve emission reduction abroad equivalent to remaining Norwegian greenhouse gas emissions. Climate neutrality can be achieved through the EU Emissions Trading System (ETS), international cooperation on emission reductions, emission allowance trading and project-based cooperation. The full operationalization of the target is not yet finalized.
The Paris Agreement provides for cooperation between countries to implement their NDCs and national climate targets. The Government is working on the development of pilots for market cooperation under the Paris Agreement that can be used towards the climate neutrality target. Cooperation of this kind will make it possible to cut emissions more rapidly and at lower cost, and will contribute to a green transition in other countries. This will in turn enable countries to set more ambitious targets.
4.1.1.4 Low-emission society by 2050
In June 2017, the Norwegian Parliament adopted an Act relating to Norway’s climate targets (Climate Change Act), which establishes by law Norway’s target of becoming a low-emission society by 2050. The purpose is to promote the long-term transformation of Norway in a climate-friendly direction. The Act describes a low-emission society as one where greenhouse gas emissions, on the basis of the best available scientific knowledge, global emission trends and national circumstances, have been reduced in order to avert adverse impacts of global warming, as described in the Paris Agreement. In quantitative terms, the target is to achieve emissions reductions of the order of 90–95 per cent from the level in the reference year 1990. The effect of Norway’s participation in the EU ETS is to be taken into account in assessing progress towards this target. As a small open economy, Norway is dependent on a similar shift in other countries if it is to maintain its ability to make full, effective use of labour and other resources and achieve its climate and environmental policy goals.
Norway’s long-term low-emission strategy for 2050 was adopted by the Norwegian Parliament in October 2019. A translation into English was submitted to the UNFCCC in November 2020.
4.1.2 Policy instruments
The polluter pays principle is a cornerstone of the Norwegian policy framework on climate change. Policies should be designed to yield the greatest possible emission reductions relative to cost and should result in emission reductions both in Norway and abroad. Furthermore, our policy will be based on the responsibility to help safeguard the planet and on the precautionary principle.
General policy instruments are a key element of domestic climate policy. Cross-sectoral eco-nomic policy instruments that put a price on emissions (i.e. the taxes on emissions of greenhouse gasses and the EU emission trading system) form the basis for decentralised, cost-effective and informed actions, where the polluter pays. As a main rule, areas subject to general policy instruments, should not be subject to additional regulation. For non-ETS emissions, taxes on greenhouse gases is the main mitigation measure. If the tax is not considered to be an adequate or appropriate instrument, other instruments that reduce emissions will be considered, including direct regulation under the Pollution Control Act and voluntary agreements. Norway also employs biofuel sales mandates as an important policy instrument for reducing ESR emissions.
Over the last ten years, the scope of Norwegian carbon pricing has steadily increased. Close to 85 per cent of domestic greenhouse gas emissions are from 2022 either covered by the emissions trading scheme or taxes on greenhouse emissions. The level of carbon pricing is also among the highest in the world, with over 80 per cent of emissions being priced at or above approximately 80 USD in 2022. There is also a broad political consensus on increasing the taxes on ESR emissions to above USD 200 in 2030, and to continue the participation in the EU-ETS.
In addition to the emission trading system and taxes, support to research on and innovation of climate-friendly technologies will provide complementary support where markets do not pro-vide the solutions.
4.1.3 Responsibilities for the different institutions
The overall national climate policy is decided by the Storting, and the government implements and administers the most important policies and measures, such as economic instruments and direct regulations. Most policies and measures in the area of climate policy are developed through interministerial processes before the political proposals are tabled. The Ministry of Climate and Environment has the overarching cross-sectoral responsibility for co-ordination and implementation of the Norwegian climate policy. It also operates the Norwegian carbon credit procurement program. The Ministry of Finance is responsible for the tax schemes. The other ministries are responsible for policies in their respective sectors.
Local governments are responsible for implementing policies and measures at the local level, for example through waste management, local planning and some transport measures. In 2009, guidelines were introduced for climate and energy planning in the municipalities. New guidelines describing how the municipalities and counties can incorporate climate change adaptation work into their planning activities are currently being developed.
The Norwegian Environment Agency is a government agency under the Ministry of Climate and Environment. The Environment Agency implements government pollution and nature management policy. Important fields of work in relation to pollution control include climate, hazardous substances, water and the marine environment, waste management, air quality and noise. The Environment Agency manages and enforces the Pollution Control Act, the Product Control Act and the Greenhouse Gas Emission Trading Act, and the Nature Diversity Act, among others.
The Environment Agency grants permits, establishes requirements and sets emission limits, and carries out inspections to ensure compliance.
The Environment Agency also monitors and informs about the state of the environment. The Environment Agency has an overview of the state of the environment and its development. Together with other expert agencies, the Environment Agency provides environmental information to the public. The main channel is State of Environment Norway: www.environment.no
The Environment Agency supervises and monitors the County Governors’ work on pollution, coordinates the County Governors’ inspection work and organises joint inspections. The Environment Agency provides guidelines for the County Governors and also deals with appeals against decisions made by the County Governors.
The Environment Agency participates in a series of international processes, to promote regional and global agreements that reduce serious environmental problems. Moreover, the Environment Agency also cooperates with the environmental authorities in other countries, sharing competence and furthering environmental improvements.
The Norwegian Water Resources and Energy Directorate (NVE) is a directorate under the Ministry of Petroleum and Energy. NVE’s mandate is to ensure an integrated and environmentally sound management of the country’s water resources, promote efficient energy markets and cost-effective energy systems and promote efficient energy use. For more information, see: www.nve.no/en. Pursuant to changes in the Solberg Government in January 2018, the Minister for Climate and Environment is responsible for the state owned enterprise Enova www.enova.no/about-enova, which contributes towards Norway’s emission reduction commitments and contributes to the transition to a low-emission society.
Norway has actively addressed sustainable development since the World Commission on Environment and Development submitted its report Our Common Future in 1987. In 2015 UN presented new and ambitious sustainable development goals. There are 17 main goals and 169 intermediate objectives. Through Agenda 2030 the international community has made a commitment that no people are left behind in the implementation of the goals. The goals are global, and all countries must do their part. In 2016 Norway was among the first countries to report to the UN on status for their follow up of the goals. A new Norwegian status report (“One Year Closer”) was presented this year.
The Government underscores that the follow-up of the sustainable development goals shall be integrated in the ordinary government decision-making processes. Each of the 17 sustainable development goals has been assigned to one responsible Ministry. All ministries shall report on the follow-up of their responsibilities in the budget documents. The Foreign Ministry coordinates the processes at international level.
4.1.4 Assessment of the economic and social consequences of response measures (and minimisation of adverse impacts)
Norway strives to follow a comprehensive approach to climate change mitigation from policy development started around 1990, addressing all sources as well as sinks, in order to minimise adverse effects of climate policies and measures on the economy.
In developing environmental, as well as the economic and energy policy, Norway endeavours to include the polluter pays principle and to have a market-based approach where prices reflect costs including externalities. As regards emissions of greenhouse gases, costs of externalities are reflected by climate taxes and by participation in the European Emissions Trading Scheme (EU ETS). These instruments place a price on emissions of greenhouse gases. The Norwegian Government contends that the best way to reduce emissions on a global scale, in line with the aims limiting the global average temperature increase to 1.5 °C above pre-industrial levels, would be to establish a global price on emissions. Pursuing a global price on emissions would be an efficient way to ensure cost-effectiveness of mitigation actions between different countries and regions, and secure equal treatment of all emitters and all countries. This will help minimise adverse impacts of mitigation. For more information about climate taxes and the design of the EU ETS, see chapter 4.3.2.
Norway is involved in several international and regional initiatives that contribute to technology development and transfer and enhanced capacity building to developing countries with the aim of contributing to maximize the positive and minimize the negative effects of response measures, including economic diversification and a just transition. One important aspect is to facilitate the shifting of the energy mix away from high emission sources to more renewable energy systems and low-emission sources and diversifying economies. These initiatives are reported here as relevant activities under Article 3.14 of the Kyoto Protocol. In addition, Norway has a member in the Katowice Committee for the Implementation of Response Measures.
The former government presented a national strategy for green competitiveness in October 2017. The aim of the strategy is to provide more predictable framework conditions for a green transition in Norway, while maintaining economic growth and creating new jobs. An expert commission presented its report with an analysis of Norway’s exposure to climate risk in December 2018. The report has a clear recommendation to pursue ambitious and effective climate policies and undertake climate risk analysis to become more robust to effects of climate change.
Carbon capture and storage (CCS) is one of five priority areas for enhanced national climate action. Norway strives to disseminate information and lessons learned from projects in operation in the petroleum sector, new large-scale projects under planning and from research, development and demonstration projects. The information and lessons learned are shared both through international fora, and through bilateral cooperation with developing and developed countries. For further information, see chapter 15.2 of Norway’s National Inventory Report for 2022.
The Norwegian Oil for Development (OfD) programme, which was launched in 2005, aims at assisting developing countries, at their request, in their efforts to manage petroleum resources in a way that generates economic growth and promotes the welfare of the whole population in an environmentally sound way. A description of the OfD program can be found at: https://www.norad.no/en/front/thematic-areas/oil-for-development/. The programme is currently engaged in 8 countries, mainly in Africa.
The operative goal of the program is “economically, environmentally and socially responsible management of petroleum resources which safeguards the needs of future generations.” OfD takes a holistic approach meaning that management of petroleum resources, revenues, environment and safety are addressed in a coherent manner. OfD assistance is tailor-made to the particular needs of each partner country. It may cover the designing and implementing legal frameworks, mapping of resources, environmental impact assessments, handling of licenses, establishing preparedness to handle accidents and oil spills, health, safety and environmental legislation, petroleum fiscal regimes and petroleum sovereign wealth fund issues as well as initiatives related to transparency, anti-corruption, and climate change.
In 2021 the prior government decided to gradually phase out the OfD and discontinue the programme by 2024. This change was conducted to steer the development assistance in a greener direction with focus on climate change and renewable energy. In accordance with the Norwegian development policy with focus on renewable energy, the OfD programme shall be transformed into an Energy for Development (EfD) programme, which is in the process of being developed.
The policy of the Norwegian government is to integrate development and climate, as these major challenges are highly interlinked. Increased access and transition to renewable energy is the main priority. Renewable energy has been part of Norway’s development assistance policy for several years. In addition to extensive support through multilateral and multi-donor funding, several countries, mainly in Sub-Saharan Africa, have received bilateral Norwegian renewable energy funding. The overall objective of Norway’s contribution to renewable energy is to contribute to access SDG 7 and the Paris Agreement. The intervention in renewable energy is also seen as a contribution to reduce further development of coal power. For further information, see chapter 15.4 of Norway’s National Inventory Report for 2022
Norway has issued Instructions for Official Studies and Reports (Utredningsinstruksen), laid down by Royal Decree. These instructions deal with consequence assessments, submissions and review procedures in connection with official studies, regulations, propositions and reports to the Storting. The instructions are intended for use by ministries and their subordinate agencies. The instructions form part of the Government’s internal provisions and deviation may only be allowed pursuant to a special resolution. The provisions make it mandatory to study and clarify financial, administrative and other significant consequences in advance.
In addition, Norway has a legal framework that deals specifically with environmental impact assessments. The purpose is to promote sustainable development for the benefit of the individual, society and future generations. Transparency, predictability and participation for all interest groups and authorities involved are key aims, and it is intended that long-term solutions and awareness of effects on society and the environment will be promoted.
4.2 Domestic and regional programmes and/or legislative arrangements and enforcement and administrative procedures
4.2.1 Domestic and regional legislative arrangements and enforcements
Norway has several legislative arrangements in place in order to help reduce emissions of greenhouse gases, such as the Pollution Control Act, the Greenhouse Gas Emissions Trading Act, the CO2 Tax Act, and the Petroleum Act, as well as requirements under the Planning and Building Act. The relevant arrangements will be discussed in more detail in 4.3.
The Climate Change Act
In June 2017, the Norwegian Parliament adopted the Climate Change Act, which establishes by law Norway’s emission reduction targets for 2030 and 2050. The purpose of the act is to promote the long-term transformation of Norway in a climate-friendly direction. See further description of Norway’s climate targets in 4.1.
The act will have an overarching function in addition to existing environmental legislation. The Climate Change Act introduces a system of five-year reviews of Norway’s climate targets, on the same principle as the Paris Agreement. In addition the act introduces an annual reporting mechanism. The Government shall each year submit to the Parliament updated information on status and progress in achieving the climate targets under the law, and how Norway prepares for and adapts to climate change. Information on the expected effects of the proposed budget on greenhouse gas emissions and projections of emissions and removals are also compulsory elements of the annual reporting mechanism. Since 2018, the Government has annually reported information as required by the Climate Change Act as part of the state budget process in October each year.
4.2.2 Provisions to make information publicly accessible
Norway has undertaken extensive provisions to make climate information publicly available. This issue is discussed further in chapter 9.
4.3 Policies and measures and their effects
4.3.1 Introduction
The main instruments of Norwegian climate policy are cross-sectoral: taxes on greenhouse gas emissions and emissions trading. Use of these instruments will contribute to fulfilment of emission targets at lowest cost to society. In addition to instruments that put a price on emissions, the Government uses other policy instruments to reduce barriers and correct market failures related to technology development, and in specific markets. It can be appropriate to use direct regulation on its own when an alternative technology or a different solution is mature enough to be deployed. Which policy instruments are suitable and where depends partly on which low- and zero emission alternatives are available and how mature they are. Different forms of market failure and barriers require different combinations of policy instruments.
This chapter describes some of the most important policies and measures (PaMs) for reducing greenhouse gas emissions in Norway. The chapter consists of textual descriptions of cross-sectoral and sectoral PaMs, and each sector has a summary table for the PaMs. Through these summary tables, the reporting of the PaMs is clearly subdivided by gases. The summary tables present the effects on greenhouse gas emissions of many PaMs and the total aggregated effects are summed up in chapter 5.6.
4.3.2 The Norwegian system of carbon pricing
4.3.2.1 Introduction
The main instruments of Norwegian climate policy are taxes on greenhouse gas emissions and emissions trading. Both these instruments put a price on emissions and make it more expensive to release greenhouse gases. Taxes provide an incentive to reduce emissions both through immediate action and through investment in research and development that will make it possible to reduce emissions at a later date. General policy instruments are a key part of the domestic climate policy. Cross-sectoral economic policy instruments (climate taxes) form the basis for decentralized, cost-efficient and informed actions, where the polluter pays. In areas subject to general policy instruments, additional regulation should as a main rule be avoided. The Government has implemented instruments in addition to emissions trading and climate taxes in some sectors.
Cost-efficient policy instruments ensure that reductions in emission are implemented in a way
Figure 4.1 Emissions covered by economic measures by instrument type.

that leads to the lowest cost to society as a whole. If policy instruments are not cost-efficient, society must accept an unnecessary loss of welfare in other areas in order to achieve environmental goals. In the assessment of policies and measures, cross-sectoral effects and long-term effects on technology development and deployment should be taken into consideration.
CO2 taxes on mineral oil, petrol and emissions from petroleum extraction on the continental shelf were introduced in 1991 to cost-efficiently limit greenhouse gas emissions. In addition to being subject to CO2 taxes, emission from extraction of petroleum were also included in the European emission trading system (EU ETS) in 2008. CO2 taxes on natural gas and LPG were introduced in 2010.
In Norway, CO2 taxes and quotas (EU ETS) cover close to 85 per cent of greenhouse gas emissions. In 2022, the standard tax rate on non-ETS emissions is 766 NOK per tonne CO2 and is levied on most uses of mineral oils, petrol and diesel, natural gas, LPG and HFC/PFC see Table 4.1 and Table 4.2.
The price on greenhouse gas emissions varies between sectors and sources. The price on emissions is highest in the petroleum sector and in domestic aviation, which are also part of EU ETS. Both sectors are subject to taxes in addition to the EU ETS, and the total price on emissions is about NOK 1 500 in 2022. Agriculture is not a part of the EU ETS, nor is it subject to tax on emissions of methane or nitrous oxide. However, standard rates of CO2 tax and base tax on mineral oils apply to agriculture.
If natural gas and LPG is used in land-based manufacturing covered by EU ETS, the tax rate will either be reduced or the activities may be exempted from the tax. For the time being, other sectors and activities exempted from the CO2 tax on natural gas and LPG include (list not conclusive) fishing in distant waters, chemical reduction or electrolyses, metallurgical and mineralogical processes and international shipping and aviation. EEA state aid regulation will in certain cases prevent Norway from exempting emissions covered by the EU ETS from taxes. The Norwegian parliament has adopted a tax on chemical reduction etc., but the tax will only be put into effect in the case where an exemption for emissions covered by the ETS can be implemented.
The development in Norwegian taxes on GHGs from our last report is illustrated in figure 4.2. Overall price levels have increased due to increases in the tax rates and the increase in the price of allowances in the EU ETS. Furthermore, the reduced rate for fisheries was abolished in 2020, and a new tax on emissions from waste incinerations was introduced in 2022.
Some taxes that do not target greenhouse gas emissions directly nevertheless increase the total tax on fossil fuels and therefore affect emissions. The road usage tax on fuels is levied to internalise the costs inflicted on the society in terms of accidents, congestion, noise, road wear and tear as well as health and environmentally harmful emissions other than CO2. Moreover, there is a base tax on mineral oil, the purpose of which is to avoid substitution of electricity due to the electricity tax.
Table 4.1 shows all current taxes on emissions of greenhouse gases. Below follows a description of the effect of green taxes on mainland emissions. Chapter 4.2.3 discusses in more detail the CO2 tax on petroleum activities and its effects on emissions offshore.
Table 4.1 Norwegian taxes on emissions of greenhouse gases in 2022.
NOK. per l/Sm3/kg/ ton | NOK. per ton CO2 | |
|---|---|---|
CO2-tax on mineral products | ||
Petrol | 1.78 | 766 |
Mineral oil | ||
Standard rate | 2.05 | 766 |
Domestic aviation (non-ETS) | 1.96 | 766 |
Domestic aviation (ETS)1 | 1.61 | 631 |
Natural gas | ||
Standard rate | 1.52 | 766 |
Use covered by the ETS1 | 0.066 | 33 |
Greenhouse industry | 0.15 | 77 |
LPG | ||
Standard rate | 2.30 | 766 |
Use covered by the ETS1 | 0.00 | 0 |
Greenhouse industry | 0.23 | 77 |
Tax on waste incineration | ||
Non-ETS emissions | 106 | 192 |
ETS emissions1 | 106 | 192 |
Tax on HFC and PFC | - | 766 |
CO2-tax for offshore petroleum | ||
Mineral oil1 | 1.65 | 620 |
Natural gas1 | 1.65 | 705 |
Natural gas emitted to the atmosphere | 10.66 | 766 |
1These emissions are also subject to the EU ETS.
Figure 4.2 Explicit carbon prices in 2019 and 2022. (NOK per ton CO2, 2022 price levels and 2020 emission data)

4.3.2.2 The Norwegian tax scheme on emissions of GHGs under the ESR
The standard tax rate on emissions under the ESR is NOK 766 in 2022, and there is a broad consensus in Norway that this tax rate is to increase to more than NOK 2 000 by 2030. The taxes cover approximately two thirds of emissions under the ESR, and the tax base has been gradually broadened over the last decades. In 2022 a tax on waste incineration was introduced. The most important tax is the CO2-tax on mineral products, which covers close to 100 per cent of all use of fossil fuels covered by the ESR.
The taxes on emissions from petroleum and aviation under the ETS are treated as separate policies and reported under petroleum and transport below.
Estimated effect on national emissions
The Norwegian Ministry of Finance has developed a model to analyse the mitigation effects of changes in the taxes on GHGs. The model combines price data, volume data from the tax authorities, and elasticities from economic literature to predict the mitigation effect of each tax for the different sectors and products that the tax covers. Results from this model indicates that removing the CO2-tax in 2022 would increase annual emissions by roughly 1 million tonnes of CO2. This includes the effects of the tax on waste incineration and the tax and reimbursement scheme on HFC/PFC, as they are part of the taxes on ESR emissions. This does not include the effect of the taxes on road transport. The effects on road transport is included in 4.3.7.2.
4.3.2.3 Tax on waste incineration
Norway introduced a tax on the final disposal of waste (including both landfills and incineration) on 1 January 1999. The tax for incineration was lifted on 1 October 2010 and for landfills in 2015. The purpose of the tax was to place a charge on the environmental costs of emissions from landfills, and thereby provide an incentive to reduce emissions, increase recycling and reduce the quantities of waste. The tax had a specific CO2-component aimed at reducing emissions of CO2 from waste incineration. In 2022, a tax on emissions of CO2 from waste incineration has been reintroduced. The tax rate is currently at NOK 192 per ton CO2, which equals to 25 per cent of the standard tax rate for non-ETS emissions. The tax currently applies to emissions both outside and inside the scope of the ETS.
Estimated effect on national emissions
Using the same model as for the other taxes on GHGs, we find that the recently introduced tax on waste incineration is expected to reduce emissions by 20 000 tonnes of CO2 annually, given the current reduced rate. This effect is included in the PaM the Norwegian tax scheme on emissions of GHGs under the ESR (see chapter 4.3.2.2).
4.3.2.4 Tax and reimbursement scheme on HFC and PFC
To curb the expected growth in HFC emissions due to the phase-out of ozone-depleting substances, a tax on import and production of HFCs was introduced in 2003 (the tax also includes PFCs, but the use of these gases is insignificant). In 2004, this tax was supplemented with a refund scheme, which prescribes a similar refund when gas is destroyed. The tax was initially NOK 180 (appr. 19 Euro) pr. GWP-tonnes. In 2022 the tax is NOK 766 (appr. 76 Euro) per tonne CO2-equivalents, after relatively large increases since 2014. Emissions of HFC/PFC are taxed at the same level as the standard tax rates for CO2, measured in NOK per ton CO2-equivalents. Since the tax is levied on imports of the gases, and not on actual emissions of HFC, the tax- is combined with a refund scheme to target emissions of HFC.
The tax and reimbursement schemes have resulted in better maintenance and improved routines for discarding old equipment. It also provides a strong incentive for choosing HFCs with the lowest GWP possible and has resulted in the increased use of natural refrigerants, such as CO2, ammonia or hydrocarbons and in recent years the use of HFC with very low GWP (HFOs), in new installations. The tax has had very significant effects on new, bigger installations, where low-GWP alternatives are often available, and the tax might represent a significant share of the investment costs. On smaller mass-produced units, such as domestic heat pumps, the international development as regards legislation (such as the EU F-gas regulation and the Montreal Protocol) and commercialization of new technology is likely the main driving force influencing emissions and choice of refrigerant.
Estimated effect on national emissions
The tax has significantly reduced growth in emissions compared with pre-tax scenarios, which forecasted very strong growth due to substitution of CFCs and HCFCs with HFCs. Estimates by a national expert are that the tax may reduce the HFC emissions by 0.6 million tonnes of CO2 equivalents. Due to lack of specific information, estimated effect is held constant over the period. This effect is included in the PaM the Norwegian tax scheme on emissions of GHGs under the ESR (see chapter 4.3.2.2).
The emissions of HFCs increased steadily from 1990 to 2013, when they peaked. Since then, there has been a significant downward trend. This is likely due to the combined effect of the tax- and refund scheme and the implementation of the EU F-gas regulation and Mobile Air Conditioning Directive. Recent commercialization of natural refrigerants in commercial refrigeration and other applications, as well as the switch to HFOs in new cars, has also contributed to this change in emission trend.
4.3.2.5 Emission trading (onshore)
Norway established a national emissions trading scheme in 2005. The scheme closely resembled the EU’s emissions trading scheme (ETS) and covered 11 per cent of total Norwegian greenhouse gas emissions, mainly from industry. Emissions already subject to CO2 tax were not included in the scheme.
From 2008 Norway became part of EU ETS phase II, which broadened the scheme to cover nearly 40 per cent of Norwegian greenhouse gas emissions. The petroleum sector and emissions from industries that had previously been subject to CO2 taxes were included in the EU ETS at that stage. In addition to the sectors included in the EU ETS, Norway decided unilaterally in February 2009 (effective from 1 July 2008) to include nitrous oxide emissions from the production of nitric acid in Norway. Such emissions constituted about 4 per cent of Norwegian greenhouse gas emissions in 2005.
Starting from 2012, the aviation sector was also included in the scope of the EU ETS. From 2013, phase III (2013–2020), the coverage of the EU ETS was further expanded, covering both new sectors (production of aluminium, petrochemical industry, mineral wool, ferroalloys, CCS) and gases (PFCs). From 2013, about 50 per cent of the Norwegian emissions are covered by the EU ETS.
From 2021, phase IV (2021–2030), there is no change in the coverage of sectors and gases compared to phase III for stationary installations. Emissions covered by the EU ETS in this phase amounts to about 50 per cent of the Norwegian emissions. In July 2021, as part of the Fit for 55 legislative package, the European Commission proposed a comprehensive set of changes to Phase IV of the EU ETS, for instance an increased level of ambition and extending the scope of the scheme to cover maritime transport. In addition, the Commission has proposed to create a new, self standing ETS for buildings and road transport.
Cap
Norway participates in the EU ETS. The aggregated future emissions covered by the scheme cannot exceed the EU-wide cap, which was set 21 per cent lower in 2020 compared with the emissions in 2005 from the covered sectors. Norwegian installations represent about 1 per cent of the total emissions. Norway’s participation in the ETS from 2008 led to a tightening of the system, as Norwegian installations have had a higher demand for allowances than the number of allowances added pursuant to this expansion of the system. The reduction rate for the cap was further increased from 2021 so that overall reduction of the cap in 2030 will be 43 per cent compared to 2005.
Legal basis
The legal basis for emissions trading in Norway is the Greenhouse Gas Emissions Trading Act which was adopted on 1 January 2005. The Act has been amended several times, notably in June 2007, February 2009 and May 2012. The amendments in 2007 and 2009 provided the basis for the emissions trading scheme in the Kyoto Protocol first commitment period (2008–2012). In July 2012, Directive 2009/29/EC of the European Parliament and of the Council of 23 April 2009 amending Directive 2003/87/EC so as to improve and extend the EU ETS was incorporated in the EEA Agreement.
Allocation and emissions
In the first (2005–2007) and second (2008–2012) phases of the EU ETS, allowances were allocated based on rules developed nationally (see NC6). The average amount of Norwegian emissions covered by EU ETS was 6 and 19.1 Mt/year in the respective phases. Up to and including 2020, the EU ETS allowed for the use of Kyoto units from the Clean Development Mechanism (CERs) and Joint Implementation (ERUs) for compliance purposes. A total volume of about 15 million CERs and ERUs have been surrendered from the installations for their compliance, and there was also a net transfer of Assigned Amount Units (AAUs) between EU and Norway, which has been used for compliance in the first commitment period under the Kyoto Protocol. A similar clearing mechanism between EU and Norway has been applied for the second commitment period (2013–2020) under the Kyoto Protocol.
Installations in sectors that are considered to be at risk of carbon leakage receive some or all of their allowances free of charge. For phase III (2013–2020), the allocation methodology was harmonized across Europe. The general rule for allocation in phase III was based on performance benchmarks rather than historical emissions levels. The average amount of Norwegian emissions covered by EU ETS in this phase was 22,9 Mt (excluded emissions from aircraft operators covered by the EU ETS). For phase IV (2021–2030), the same principles for allocation as in phase III were applied. In 2021, total free allocation to Norwegian installations represented about 60 per cent of their emissions for the same year.
Another measure aiming at preventing carbon leakage is that specific industries affected by higher electricity prices caused by the allowance price, since 2013 can be granted economic compensation (see chapter 4.2.8.4).
Compliance and reporting requirements
Operators included within the scope of the emissions trading scheme must report their verified emissions yearly to the Norwegian Environment Agency by 31 March the following year. If an operator does not submit an emission report in accordance with the provisions on reporting by the deadline, the Norwegian Environment Agency suspends the operator’s right to transfer allowances to other account holders. From the compliance year 2013, emissions reports from Norwegian installations must be verified by an accredited third party (verifier). Prior to 2013, the Norwegian Environment Agency performed the verification of the reports itself.
The Norwegian Environment Agency may impose coercive fines and even penal measures in the event of serious contravention of the provisions in the Greenhouse Gas Emissions Trading Act. A fine for failure to comply is imposed if an insufficient number of allowances is surrendered by 30 April. In addition, the operator must surrender an amount of allowances equivalent to the deficit the following year.
Starting in 2021, the operators of installations to which free allocation has been given, must report their verified allocation data yearly to the Norwegian Environment Agency by 31 March. Where the report shows that there has been changes in the activity of the installation, the Norwegian Environment Agency adjusts the allocation accordingly.
Estimated effect on emissions
Because emission allowances in the EU ETS can be sold across borders between installations in the scheme, the effect of the scheme on national emissions depends on several factors in addition to the level of ambition of the EU-wide cap. A crucial factor is Norwegian industry’s abatement cost relative to the abatement cost in industry located in other countries covered by the scheme, and relative to the carbon price. For this reason, in contrast to the Europe-wide effect, the scheme’s effect at the national level is difficult to assess and quantify.
There are no national emission targets for ETS emissions as there are for non-ETS emissions. However, earlier estimates made by Statistics Norway show that the emission trading scheme in phase II (2008–2012) may have led to overall national emission reductions of up to 0.3 million tonnes of CO2 equivalents per year.
Norway is an integral member of the EU ETS through the EEA Agreement. Norway’s participation increases the overall tightness of the European scheme. The number of allowances in Europe attributed to Norwegian participation (excluding aviation) was about 18 Mt/year for the trading period 2013–2020, while demand from Norwegian installations was approximately 24 Mt/year. The increased demand due to Norwegian participation will result in additional emission reductions within the scheme. These reductions may take place anywhere in the EU/EEA area, and the effect for the period 2013–2020 is therefore indicated as IE in the table 4.2.
Table 4.2 Summary of policies and measures, cross-sectoral.
Name of policy or measure a | Sector(s) affected b | GHG(s) affected | Objective and/or activity affected | Type of instrument c | Status of implementation d | Brief description e | Start year of implementation | Implementing entity or entities | Estimate of mitigation impact (not cumulative, in kt CO2 equivalents) | |||
|---|---|---|---|---|---|---|---|---|---|---|---|---|
2020 | 2025 f | 2030 f | 2035 f | |||||||||
The Norwegian tax scheme on emissions of GHGs under the ESR (excluding road transport) *g | Cross-cutting | CO2, HFC | Cost-effective reductions of emissions | Fiscal | Implemented | CO2 taxes on mineral oil, petrol and emissions from petroleum extraction on the continental shelf were introduced in 1991 to cost-efficiently limit greenhouse gas emissions | 1991 | Ministry of Finance | 1 000 | 1 000 | 1 000 | 1 000 |
Tax on waste incineration * | Energy | CO2 | Cost-effective reductions of emissions | Fiscal | Implemented | Introduced in 2022. Incentivizes reduced inceneration of fossil materials, increased recycling of plastics and the implementation of CCS technology. | 2022 | Ministry of Finance | NA | IE | IE | IE |
Tax and reimbursement scheme on HFC and PFC * | Industrial processes | HFC | Improved control of fugitive emissions from industrial processes | Economic | Implemented | Has resulted in better maintenance and improved routines during discharge of old equipment. | 2003 | Directorate of Customs and Excise, Norwegian Environmental Agency | IE | IE | IE | IE |
Emissions trading (2008–2012) onshore * | Industrial processes, Energy | CO2, N2O | Reduce emissions | Economic | Implemented | Part of the EU Emissions Trading Scheme, see text for further details. | 2008 | Norwegian Environment Agency | 300 | 300 | 300 | 300 |
Emissions trading (2013–) onshore *h | Industrial processes, Energy | CO2, N2O, PFC | Reduce emissions | Economic | Implemented | Part of the EU Emissions Trading Scheme, see text for further details. | 2013 | Norwegian Environment Agency | IE | IE | IE | IE |
Note: The two final columns specify the year identified by the Party for estimating impacts (based on the status of the measure and whether an ex post or ex ante estimation is available). Abbreviation: GHG = greenhouse gas.
a Parties should use an asterisk (*) to indicate that the policy or measure is included in the ‘with measures’ projection.
b To the extent possible, the following sectors should be used: energy, transport, industry/industrial processes and product use, agriculture, forestry/land use, land-use change and forestry, waste management/waste, other sectors and cross-cutting, as appropriate.
c To the extent possible, the following types of instrument should be referred to: economic, fiscal, voluntary agreement, regulatory, information, education, research and other.
d To the extent possible, the following descriptive terms should be used to report on the status of implementation: implemented, adopted and planned.
e Additional information may be provided on the cost of the policy or measure and the relevant timescale.
f Optional year or years deemed relevant by the Party
g Custom footnote. The effects of the taxes on HFCs and waste incineration are included in the effect of the Norwegian tax scheme on emissions of GHGs under the ESR.
h Custom footnote. The ETS may have contributed to some of the estimated effects reported for industry.
4.3.3 Other Cross-sectoral policies and measures
4.3.3.1 Regulation by the Pollution Control Act
The Pollution Control Act lays down a general prohibition against pollution. Pollution is prohibited unless one has a specific permission to pollute according to law or a decision made by the relevant authority. The Pollution Control Act applies also to greenhouse gas emissions. Greenhouse gas emissions are however to a large extent covered by other specific policy instruments such as the CO2 tax, the EU ETS and specific agreements with the industry on reduction of emissions.
Several provisions have the objective of ensuring efficient enforcement of the Act, or regulations or decisions issued pursuant to the Act. For example, violation of provisions may result in closure, coercive fine or criminal liability.
In the waste sector, regulations under the Pollution Control Act are used to ensure minimum environmental standards of landfills and incineration plants, and to regulate the handling of certain waste fractions. The EU directives on waste are implemented through the Pollution Control Act and through different parts of the Waste Regulation under the Pollution Control Act. The Waste Regulation includes the following measures:
- Requirement to collect methane from landfills (gradually introduced from 1998).
- Prohibition of depositing biodegradable waste (introduced 1 July 2009 with an opening for exemptions until 2013).
- Requirement to utilise energy from incineration from incineration plants.
From 2002 landfilling of wet-organic waste has been prohibited. This prohibition was replaced by the wider prohibition of depositing (2009) that applies to all biodegradable waste.
The Waste Regulation includes a formulation that incineration plants should be designed and operated with a view to utilise energy. This is normally followed up in the concessions of the plants by a condition that at least 50 per cent of the energy from the incineration should be utilised. For the effects of these measures, see 4.2.11.
Estimated effect on emissions
The effect in terms of emission reductions of the Pollution Control Act is not estimated since GHG emissions are to a large extent covered by other specific policy instruments.
4.3.3.2 The Planning and Building Act
The Planning and Building Act sets the framework for the planning and use of land areas and building requirements. Planning pursuant to the Act shall ensure sustainable development for the whole country and requires the participation of all those that are concerned by the decisions made in accordance with the Act.
The Act is a process law, regulating how decisions concerning land use and building must be made, as well as outlining some core topics that must be taken into consideration in decisions made in accordance with the Act. The legislative purpose of the Act is to ensure sustainable development in the interest of individuals, society and future generations. Among the core tasks and considerations required in all planning in accordance with the Act, are reducing climate gas emissions and adaptation to climate change. This is further elaborated in guidelines and the building code (energy requirements in the building code are further elaborated in chapter 4.3.6.4.)
Estimated effect on emissions
The effect ons emissions reduced through the regulations in the Planning and Building Act is difficult to estimate, as the emission reduction potential includes transport, land use change and buildings from all Norwegian municipalities. In addition, the base line is not defined. The Norwegian Ministry of Local Government and Regional Development is currently assessing the possibilities to strengthen the tools for dealing with climate gas emission reductions through the Act, including increased measuring and estimating of emission reduction potential.
4.3.3.3 Enova
Enova (www.enova.no) is a state-owned enterprise, owned by the Ministry of Climate and Environment. Enova is managed by the ministry based on four-year rolling agreements. The Government has given Enova a clearer climate profile for the current four-year period, so that its purpose is to contribute to Norway’s emission reduction commitment and contribute to Norway’s transition to a low-emission society. Enova contributes to the development of technologies necessary towards 2030 and the low emission society in 2050.
Enova provides funding and advice for climate and energy projects, and supports both companies and individual households, as well as local and regional governments. Funding for projects is drawn from the Climate and Energy Fund, which was provided NOK 4.1 billion in 2022. The rolling four-year agreements between Enova and the Ministry and flexible, long-term funding through the Climate and Energy Fund gives Enova a wide degree of freedom and flexibility to respond quickly to new opportunities and to support those projects that offer the greatest opportunities to influence developments. Given uncertainties about how rapid technology development may be in various sectors, freedom and flexibility within the framework of the four-year agreement is important.
Enova’s activities focus on late-phase technology development and early-stage market introduction. Grants for late-phase technology development help to speed up the pace and scale of pilot and demonstration projects and full-scale testing, so that new technologies and solutions reach the market more quickly. Enova’s programs deal with technologies and solutions at various stages of maturity. During the innovation process from technology development to market introduction, the goal is to reduce costs and the level of technological risk. Once a solution is technologically mature and ready for market roll-out, the goal is to achieve widespread deployment and market take-up. It is always necessary to overcome various market barriers as a solution proceeds through technology development and market introduction. Enova seeks to identify the most important of these and designs its programmes for the introduction and deployment of energy and climate solutions to lower such barriers.
New climate and energy technology developed in Norway can also play a part in reducing greenhouse gas emissions at global level when deployed widely enough. Investment in new technology and innovation often carries a high level of investment risk. Using public funding to reduce risk is an important strategy, because a new technology often provides greater benefits for society than for individual investors.
It generally takes time for a new technology or solution to become established and diffuse through the market. The reasons for the delay may vary. Possible barriers to the spread of new technology and products include a lack of information, scepticism to new and relatively untried solutions, and prices. Enova’s programmes for market change are designed to reduce these and other barriers and thus promote permanent market change.
Estimated effect on national emissions
Enova supports projects with an aim to contribute to Norway’s emission reduction commitment and contribute to Norway’s transition to a low-emission society. The technology projects Enova supports are intended to have immediate climate implications, but also long-term effect through dissemination and adoption of the new technologies including outside Norway. It is difficult to calculate these effects, but the potential impacts are substantial also on a global scale. For example, Enova supported the aluminium producer Hydro in developing a more energy efficient aluminium production technology which decreases energy use to 12.3 kWh per kilo aluminium, 15 per cent below the world average. In 2021, Enova supported TiZir Titanium and Iron to carry out a demonstration project that will lead to the use of hydrogen instead of coal to reduce ilmenite in the production of titanium dioxide. If the technology succeeds, and spreads globally, it may contribute to large emission reductions globally. Enova also supported REC Solar in the building of a pilot to increase material recycling in the production of solar silicon, which will reduce the need for the virgin material by 30 per cent. If such technologies become widespread, the impact on national and global greenhouse gas emissions would be significant.
Enova does not support projects in a policy vacuum. There are a variety of other policy instruments in Norway, which directly or indirectly aim to reduce domestic greenhouse gas emissions, support for R&D, taxes, regulations, and various other instruments. In such a context it is hard to say which instrument contributed to which development or reduction. An effect of the signalled steep increase in the carbon tax toward 2030 and onwards may be to reduce the need of financial support from Enova to drive early market diffusion. This illustrates the interplay between different instruments.
Enova estimates the direct reductions from each supported project, but these numbers will not represent the entire effect, nor can they be wholly attributed to Enova because the individual business cases build on and incorporate the incentives provided by other instruments. The reductions Enova calculates reflect the effects compared to the baseline in each project and only take into account the reduction of greenhouse gas emissions due to reduced consumption of fossil fuels such as coal, oil and natural gas. The reductions come as a result of improved efficiency of fossil sources and conversion from fossil to renewable energy.
Only Enova-supported projects with final report delivered in 2017 or later contain direct emission reduction results. Therefore, projects with final report delivered before 2017 are not included in the estimate of Enova’s direct contribution to reducing greenhouse gas emissions.
The estimated effect from Enova’s project portfolio is based on the yearly direct effect from each project on emissions, from the project start (defined as the date where the final report was delivered) and over the project’s expected lifetime. Other instruments such as the CO2 tax also play an important role when it comes to the profitability of the project, but the grant from Enova is assumed to be the factor that triggers the project, and the entire direct effect on emissions is in this case credited to Enova.
In the estimates, a project’s lifetime is assumed to be equal to the average lifetime of projects in the relevant sector. The assumed average lifetime of projects is based only on those applications in each sector where a full profitability analysis is required, and thereby expected lifetime is stated. For example, the expected lifetime of projects in transport, industry and the energy system is assumed to be 9, 13 and 23 years, respectively.
For the years after 2021 some assumptions need to be made when it comes to emission effects from the various sectors. Based on historic projects, we assume the following yearly effect from new projects: 300 000 tons CO2 in total, where 180 000 comes from transport projects, 80 000 from ESR within industry, 30 000 from ETS industry and 10 000 from other sectors. As the time goes by and the carbon price rises, it is likely that the carbon price increasingly will trigger projects in the market introduction phase. This will possibly result in Enova increasing the focus on technology development and decreasing the focus on market introduction. Technology developing projects usually contribute to less direct emission results than projects in the market introduction phase. Therefore, it is assumed a 20 per cent reduction in direct emission result for projects supported during the years 2025–2035, compared to the assumed results from 2022–2024.
Enova reports direct emission results as emissions compared to a fossil alternative. This means that in some cases, the reported emission results are not direct reduction of existing emissions, but rather projects that prevents an increase in emissions. An example is a company without a vehicle, that then buys an electric duty vehicle (supported by Enova) instead of a fossil duty vehicle.
The most important effects of Enova are not the direct emission reductions, but rather technology development and market change that in the longer run contributes to emission reductions. This effect is difficult to estimate and does not show in these estimates.
The estimated accumulated contribution to direct greenhouse gas emission reductions from Enova’s project portfolio is about 0.9 million tonnes of CO2 equivalents in 2020 and about 2.4–2.7 million tonnes in 2025, 2030 and 2035, see table 4.4 for details.
As a result of the bottom-up method of calculation and the use of individual baselines there is no direct link between this number and the national environmental accounts. An additional result of the bottom-up method is the partial inclusion of the effects of other policies. It is important also to note that Enova works by reducing the barriers to adoption of energy and climate technologies with an aim to facilitating a lasting market shift towards such technologies. It is not practical to attempt to attribute such wider changes to Enova or any other policy instrument, so it is important to bear this in mind when contemplating the effects of Enova’s support.
Box 4.4 Examples of projects supported by Enova
Fast-charging infrastructure for electric vehicles: NOK 250 million allocated through several rounds of competitive bidding, since 2015. Funding has been provided for a total of 320 charging stations. The first years, Enova focused on developing a basic charging infrastructure network along Norway’s main roads. The latest fundings have focused on the more rural parts of Norway.
Production of ammonia from natural gas with CCS: NOK 482 million to Vår Energi to build the first large-scale production facility for ammonia in Europe based on natural gas with carbon capture and storage. The project will demonstrate a new and energy-efficient technology.
Electrification of industry process: NOK 137.9 million to Inovyn in to electrify their production of vinyl chloride by using a new and world leading technology. The project will reduce emissions by 21 000 CO2 per year and contribute with important technology development in the petrochemical industry.
Fishing boat using hydrogen: NOK 92.5 million to the world’s first sea-going fishing boat using hydrogen. The boat will be out at sea for 4–6 weeks in a row and needs several energy sources to supply its energy consumption. This will be covered by a container-based storage of hydrogen, two fuel cells, a large battery and conventional diesel engines.
4.3.3.4 Klimasats
In 2016, the Solberg Government introduced a financial support scheme to promote emissions reduction projects in Norwegian municipalities and counties. The scheme is called Klimasats and is administered by the Norwegian Environment Agency that assesses and prioritises the applications based on given criteria. The objective of Klimasats is to reduce emissions at the local level and contribute to the transition to a low emission society. Examples of supported projects are the use of climate friendly building materials in public buildings, reduction of food waste in local institutions, zero emission construction sites and reduction of methane emissions from former landfills. The municipalities can also apply for funding to strengthen the climate perspectives in urban planning, where local governments have a key role. Support is also given to networks of four or more municipalities with the aim of capacity building and sharing experiences on emission reduction.
From 2016 to 2021, Klimasats allocated NOK 1064 million to 1589 projects all over Norway. An additional NOK 202 million has been allocated to facilitate the introduction of zero- and low-emission solutions for high-speed vessels in the public transport system, during 2019 – 2021.
Estimated effect on national emissions
The municipalities that have received funding report on the results and effects of the projects as well as their experiences from the implementation. The Environment Agency actively use and spread the reported results and experiences from the projects in order to facilitate the start-up of new projects in other municipalities.
The effects of the support scheme are both immediate emission reductions within areas such as transport, waste handling, buildings and public procurement. In addition, most projects contribute to the transition to a low emission society through increased focus on climate change and climate measures among local politicians, increased climate focus in urban planning, capacity building within the local administrations and cross-sectoral cooperation. The funding also provides a possibility of finding and testing new solutions, which in many cases are more expensive and the results uncertain.
An external evaluation of the Klimasats scheme has concluded that the funding to a large degree is contributing to the realization of local emission reductions projects that would not have been implemented without financial support. According to the evaluation, the support scheme stimulates local governments and administrations in identifying new emission reduction projects, it contributes to capacity building and to the dispersion of project ideas and experiences from projects among municipalities.
The effect in terms of emission reductions of the Klimasats scheme is not estimated since it supports a variety of projects and there is limited data available. All projects can be found at the website of the Norwegian Environment Agency (in Norwegian only).6
The environmental technology scheme – Innovation Norway
The Environmental Technology Scheme was established in 2010. The overall target of the scheme is to encourage the Norwegian industry to introduce new and better products and processes related to environmental technology to the market. The scheme aims at promoting profitable business opportunities and helping to realize Norway’s environmental goals.
In this context, the definition of environmental technology is all technology that directly or indirectly improves the environment, including technology and services that limits pollution through purification processes, more environmentally friendly products and production processes, more efficient handling of resources and technological systems that reduce the impact on the environment.
The Environmental Technology Scheme offers grants and other support for development and investments in pilot and demonstration projects for new Norwegian environmental technology.
It is a nationwide scheme to which all Norwegian companies can apply. The companies apply for grants related to the costs for planning and development of the project, investment costs during the development and pilot phase, and costs relating to start-up and testing after the initial work to establish the pilot. The criteria for receiving grants are related both to the projects’ economic and commercial effects, environmental effect and level of innovation.
In 2021, NOK 677 million was granted from the environmental technology scheme to 110 projects. Total investments in these projects (including the companies’ own funds) are NOK 2.3 billion. The projects are based across a range of different technologies, including metallurgic industry, bio-refinery, renewable energy, water treatment, maritime sector and aquaculture.
Estimated effects on national emissions
The environmental technology scheme supports projects in the demonstration and piloting phase, and it is difficult to quantify the results. The final product or process may not be taken up by the market until several or many years after the support is granted. In their applications, the companies indicate the expected environmental impact of the pilot and the expected effect if the new solution spreads. However, there is no requirement for the effects to be converted into CO2 equivalents and climate-specific reporting.
Table 4.4 Summary policies and measures, other cross-sectoral.
Name of policy or measure a | Sector(s) affected b | GHG(s) affected | Objective and/or activity affected | Type of instrument c | Status of implementation d | Brief description e | Start year of implementation | Implementing entity or entities | Estimate of mitigation impact (not cumulative, in kt CO2 equivalents) | |||
|---|---|---|---|---|---|---|---|---|---|---|---|---|
2020 | 2025 f | 2030 f | 2035 f | |||||||||
Regulation by the Pollution Control Act * | Industrial processes, Energy | CO2, HFC, CH4, NO2, PFC, SF6 | Reduce pollution | Regulatory | Implemented | The Act lays down a general prohibition against pollution. Pollution is prohibited unless one has a specific permission. | 1983 | Norwegian Environment Agency | NE | NE | NE | NE |
The Planning and Building Act * | Cross-cutting | CO2 | Energy consumption | Regulatory | Implemented | State act regulating the management of land use in Norway. Planning pursuant to the act shall ensure sustainable development and take climate into account. The PaM “Energy requirements in the building code” follows the planning- and building act. | 1985 | Ministry of Local Government and Regional Development | NE | NE | NE | NE |
Enova * | Transport, Industrial processes, Energy | CO2 | Efficiency improvements of buildings; Efficiency improvement in industrial end-use sectors; Demand management/reduction; Low carbon fuels; Electric road transport; Reduce emissions from international air or maritime transport; Installation of abatement technologies | Economic; Information | Implemented | Financial support to climate projects aiming for technology development or early market diffusion. | 2002 | Ministry of Climate and Environment | 959 | 2 411 | 2 629 | 2 662 |
Klimasats * | Cross-cutting | CO2, HFC, CH4, NO2, PFC, SF6 | Reduce emissions | Economic | Implemented | Reduce emissions at local level and contribute to the transition to a low carbon society. | 2016 | Norwegian Environment Agency | NE | NE | NE | NE |
The environmental technology scheme – Innovation Norway * | Cross-cutting | CO2 | Contribute to sustainable business development in Norway and realize Norway’s environmental goals | Research | Implemented | The Environmental Technology Scheme offers grants and other support for development and investments in pilot and demonstration projects for new Norwegian environmental technology. | 2010 | Norwegian Ministry of Trade, Industry and Fisheries | NE | NE | NE | NE |
Nysnø Klimainvesteringer AS (Nysnø) * | Cross-cutting | CO2 | Contribute to reducing greenhouse gas emissions through investments with such an effect directly or indirectly. | Economic | Implemented | Nysnø invests in non-listed companies and funds aimed at non-listed companies that have operations in Norway. It focuses on early-stage companies and invests primarily in the transition from technology development to commercialisation. | 2018 | Norwegian Ministry of Trade, Industry and Fisheries | NE | NE | NE | NE |
For note and footnotes, see under table 4.2.
4.3.3.6 Nysnø Klimainvesteringer AS (Nysnø)
Nysnø Klimainvesteringer AS (Nysnø) is an investment company wholly owned by the Norwegian State, through the Ministry of Trade, Industry and Fisheries. Nysnø was established in December 2017 in order to contribute to reducing greenhouse gas emissions through investments with such an effect directly or indirectly. Nysnø invests in non-listed companies, and funds aimed at non-listed companies that have operations in Norway. Nysnø focuses on early-stage companies and invests primarily in the transition from technology development to commercialisation. Nysnø has so far received NOK 2 925 million in capital. Capital and competence are drivers for developing and applying new technology for a low-emission society. Together with private investors, Nysnø provides both.
Estimated effects on national emissions
Nysnø’s overall effect on greenhouse gas emissions will be determined by Nysnø’s ability to identify and invest in high-return companies and funds, within its mandate. Nysnø’s effect on national emissions will have to be calculated based on future avoided emissions. Methodology to do this with sufficient precision is under development, but does not exist as of today.
4.3.4 Petroleum Sector
4.3.4.1 General policy instruments
Environmental and climate considerations are an integral part of Norway’s policy for the petroleum industry. A range of policy measures ensures that actors in the industry take environmental and climate considerations into account during all phases of their activities, from exploration to development, operations, and field cessation.
Environmental and climate standards in the Norwegian petroleum industry are very high compared with those in other petroleum producing countries. This is a result of effective policy instruments and joint initiatives between the authorities and oil companies on research, technology development and increased knowledge.
Emissions to air from petroleum activities originate from the combustion of natural gas and diesel in turbines, engines, and boilers, flaring of natural gas for safety reasons, venting of diffuse emissions of gas, and storage and loading of crude oil. These activities result in emissions of waste gas containing CO2, NOx (nitrogen oxides), NMVOCs (non-methane volatile organic compounds), CH4 (methane) and sulphur dioxide (SO2).
Emissions from Norwegian petroleum activities are regulated through several acts, including the Petroleum Act, the CO2 Tax Act on petroleum activities, the Sales Tax Act, the Greenhouse Gas Emission Trading Act and the Pollution Control Act.
Requirements for impact assessments and approval of plans for new developments (PDOs/PIOs) are cornerstones of the petroleum legislation. Facilities onshore and within the territorial waters are also subject to the provisions of the Planning and Building Act.
Emissions from the petroleum sector in Norway are well documented. The industry’s own organisation, the Norwegian Oil and Gas Association (NOROG), has established a national database for reporting all releases from the industry, called EPIM Environmental Hub (EEH). All operators on the Norwegian continental shelf report data on emissions to air and discharges to the sea directly in EEH.
4.3.4.2 Climate policies that affect the petroleum sector
The taxes on emissions of GHGs and the Greenhouse Gas Emission Trading Act are Norway’s most important cross-sectoral climate policy instruments for cost-effective cuts in greenhouse gas emissions. Both of these instruments apply to the petroleum industry, as opposed to most other sectors. A small part of emissions, mostly methane (CH4) from the sector is not covered by the CO2 tax or ETS.
The CO2 tax on petroleum activities on the continental shelf
The CO2 tax is levied on all combustion of natural gas, oil and diesel in petroleum operations on the continental shelf and on releases of CO2 and natural gas, in accordance with the CO2 Tax Act on Petroleum Activities. For 2022, the tax rate is NOK 1.65 per standard cubic metre of gas or per litre of oil or condensate. For combustion of natural gas, this is equivalent to NOK 705 per tonne of CO2. Emissions of natural gas to the atmosphere is not subject to the ETS. The tax rate is NOK 10.66 per standard cubic metre, equivalent to the standard rate for non-ETS emissions of NOK 766 per tonne of CO2
Emission Trading
Norwegian installations in the petroleum industry are included in the EU ETS, and subject to the same rules for emissions trading as those within the EU.
Emission allowances are allocated by auctioning or given free of charge. Sectors that are considered to be at risk of carbon leakage receive more of their allowances free of charge, following harmonised allocation rules. A certain proportion of the petroleum-sector emissions to which the ETS applies, is considered to be at risk of carbon leakage. Allowances for emissions from electricity generation on offshore installations are not allocated free of charge.
The combination of the CO2 tax and the emissions trading system means that emissions covered by the ETS on the Norwegian shelf, in 2022, face a price of approximately NOK 1 500 per tonne for their CO2 emissions, which is very high compared to emission prices in other petroleum producing countries.
Estimated effect on national emissions
In 2021, greenhouse gas emissions from petroleum activities corresponded to about 12 million tonnes CO2 equivalents (carbon dioxide equivalent). Emissions from the petroleum sector account for about one quarter of Norway’s aggregate greenhouse gas emissions.
The companies operating on the Norwegian continental shelf are front runners in the use of solutions to reduce and prevent greenhouse gas emissions. Emissions per unit of oil and gas produced are therefore lower compared to similar operations in other petroleum producing countries.
Energy efficiency measures, including the introduction of energy management systems and the installation of more energy-efficient equipment such as compressors and pumps, have helped to reduce emissions from petroleum activities. Combined-cycle gas turbines (CCGT) are one technological solution, in which waste heat from the turbines is used to produce steam, which in turn is used to generate electricity. CCGT plants improve energy efficiency and reduce emissions. Power from shore is increasingly being applied as power solutions on terminals and offshore fields and there are CCS projects in some fields.
Estimated effect on national emissions have been calculated by comparing the emission intensity of Norwegian production with another petroleum producing country with a modern infrastructure, mostly offshore production, but little to no pricing and less direct regulation of emissions. Australia has been chosen for this analysis. Estimated effect for 2020 is calculated by comparing actual Norwegian emission and counterfactual Norwegian emissions calculated using Norwegian production figures and the Australian emission intensity. For the ex ante analysis we create a counterfactual emission scenario for 2022–2035 using projected Norwegian petroleum production and the average Australian emission intensity for 2018 through 2021. The estimated effect is given by the difference between the counterfactual emissions and the emissions given by the projections in chapter 5. The estimated effect in 2020 is 7 million tonnes CO2, 11 million tonnes in 2025, 10 million tonnes in 2030 and 8 million tonnes in 2035.
4.3.4.3 Indirect CO2 emissions from offshore and onshore NMVOC regulation
Emissions of non-methane volatile organic compounds (NMVOC) lead to indirect CO2 emissions since NMVOC oxidises to CO2 in the atmosphere. Measures taken to reduce the NMVOC emissions therefore also reduce CO2 emissions.
In 2020, the petroleum sector accounted for 26 per cent of the total NMVOC emissions, with 38 kilotonnes emitted. The NMVOC emissions in the petroleum sector in Norway peaked in 2001. Since then, there has been a decline of 85 per cent until 2020. From 1990, NMVOC emissions in the petroleum sector have been reduced by 69 per cent in total.
The NMVOC emissions in the petroleum sector are mainly from loading of crude oil offshore, with offshore storage as another important source. The petroleum sector’s share of total NMVOC emissions has decreased as a result of regulations and because oil production has been reduced by approximately 45 per cent from 2001 to 2020. Starting from 2001, emissions of NMVOC linked to offshore loading and storage of crude oil have been governed under the emission permit system, pursuant to the Pollution Control Act. Since 1 January 2003, all vessels have been required to install equipment for recovering NMVOCs (vapour recovery units, VRUs). A large proportion of the shuttle tankers operating on the NCS have installed a technology that enables a 100 per cent reduction during the loading operations.
Several fields on the Norwegian Continental Shelf employ floating storage installations. This type of installation may produce higher emissions of NMVOCs than fields where the oil is stored in the base of the platforms (Statfjord, Draugen and Gullfaks). This is because, in the case of floating storage installations, the need to gas-free the tanks for inspections.
Regulations onshore are based on the Industrial Emission Directive (2010/75/EU) and corresponding BAT conclusion 2014/738/EU. Loading of crude oil and other hydrocarbons has been governed
under the emission permit system, pursuant to the Pollution Control Act. A vapour recovery unit (VRU) for NMVOCs was in operation at the crude oil terminal at Sture in 1996. The vapour recovery unit (VRU) at Mongstad crude oil terminal came into operation in June 2008. On the Nyhamna gas processing plant, gas displaced from loading condensate cargo tanks of the ship is returned to an onshore VRU. The VRU at Nyhamna has been in operation since start-up of the gas plant in 2007. At the Kårstø gas processing plant, gas return from condensate loading is burned in an incinerator.
Estimated effect on national emissions
The regulation on offshore loading and storage of crude oil has, compared to no regulation, reduced the indirect CO2 emissions of NMVOC by almost 0.10 million tonnes CO2 in 2020. The estimated effects are based on reported data from the oil fields operators to the Norwegian Environmental Agency. In 2025, 2030 and 2035 the projected effects are 0.11, 0.10 and 0.09 million tonnes CO2 respectively. The latter estimates are based on the assumption that it is the same relationship between oil production and emissions without VRU as in 2015 and VRU has an efficiency of about 60 per cent.
For NMVOC regulation on land terminals, the emissions from the terminals are estimated with and without measures. The emissions in 2025, 2030 and 2035 without measures have been back-calculated from the projected amount of crude oil loaded and an implied emission factor equal to the latest year ahead of the implementation. The emissions in 2025, 2030 and 2035 with measures have been calculated with an implied emission factor equal to 2021, which is the most recent year with historical emissions data from the installation. The effect of the regulations is approximately 0.05 million tonnes of CO2 equivalents per year since 2017, and the projected effect is also approximately 0.05 million tonnes of CO2 equivalents per year.
The regulations are expected to reduce methane emissions, as well as NMVOC emissions. However, it has not been possible to quantify this effect.
Box 4.5 Examples of measures implemented in the petroleum sector
Energy efficiency
Energy efficiency measures, including the introduction of energy management systems and the installation of more energy-efficient equipment such as compressors and pumps, have helped to reduce emissions from petroleum activities. Combined-cycle gas turbines (CCGT) are one technological solution, in which waste heat from the turbines is used to produce steam, which in turn is used to generate electricity. CCGT plants improve energy efficiency and reduce emissions. They have been installed on the fields Oseberg, Snorre and Eldfisk.
CCS
Since 1996, about 1 million tonnes of CO2 per year has been separated during processing of natural gas from the Sleipner Vest field, and stored in the subsea Utsira Formation. Since 2014, CO2 has also been separated from natural gas from the Gudrun field and stored in the Utsira Formation together with the CO2 from Sleipner. The Snøvhvit facility on Melkøya has since 2008, separated CO2 from the natural gas before the gas is chilled to produce liquefied natural gas (LNG). The CO2 is transported back offshore, injected and stored.
Power from the onshore electrical grid
The Storting (parliament) resolved in 1996 that power from the onshore electricity grid should be explored by developers and followed up by the government for each new project on the NCS. The abatement cost of installing power from the onshore grid on facilities varies considerably between different developments. Features which make this approach more cost-effective include closeness to shore, a limited need for process heat, a substantial demand for power, a well developed onshore electricity grid at the shore point, and a long lifetime for the field.
The fields Ormen Lange, Snøhvit, Troll A, Gjøa, Goliat, Valhall, Martin Linge and Johan Sverdrup are already supplied with power from shore. A joint solution for supplying power from shore to the Utsira High region will be in place by the end of 2022 , and the fields Edvard Grieg, Ivar Aasen and Gina Krog will all be connected to it. Sleipner Øst willo also be connected to the grid within 2022, and further electrification of Troll (B and C) has been approved for development. In addition, the onshore facilities Kårstø, Kollsnes, Melkøya LNG and Nyhamna are supplied partly or wholly with power from the grid. At present, these fields and facilities account for the majority of Norwegian gas production.
Floating offshore wind
The Hywind Tampen project is a floating offshore wind farm consisting of 11 wind turbines that will provide electricity for the Snorre and Gullfaks fields in the North Sea. It will be the first floating wind farm to power offshore oil and gas platforms with a system capacity of 88 MW. The first wind turbines are on stream, and all 11 turbines will be generating within 2023.
Table 4.6 Summary policies and measures, petroleum.
Name of policy or measure a | Sector(s) affected b | GHG(s) affected | Objective and/or activity affected | Type of instrument c | Status of implementation d | Brief description e | Start year of implementation | Implementing entity or entities | Estimate of mitigation impact (not cumulative, in kt CO2 equivalents) | |||
|---|---|---|---|---|---|---|---|---|---|---|---|---|
2020 | 2025 f | 2030 f | 2035 f | |||||||||
Climate policies that affect the petroleum sector * | Energy | CO2 | Reduce emissions | Regulatory | Implemented | Coverage and rates changed since 1991, see text for further details. | 1991 | Ministry of Finance/Norwegian Environment Agency | 7 000 | 11 000 | 10 000 | 8 000 |
Indirect CO2 emissions from offshore NMVOC regulation * | Energy | CO2, CH4 | Reduce indirect CO2 emissions from offshore oil and gas production | Regulatory | Implemented | Phase in of vapour recovery units technology, see text for further details. | 2002 | Norwegian Environment Agency | 96 | 112 | 104 | 88 |
Indirect CO2 emissions from onshore NMVOC regulation * | Energy | CO2, CH4 | Reduce indirect CO2 emissions from offshore oil and gas industries | Regulatory | Implemented | Installation of vapour recovery units. | 1996 | Norwegian Environment Agency | 55 | 55 | 55 | 55 |
For note and footnotes, see under table 4.2
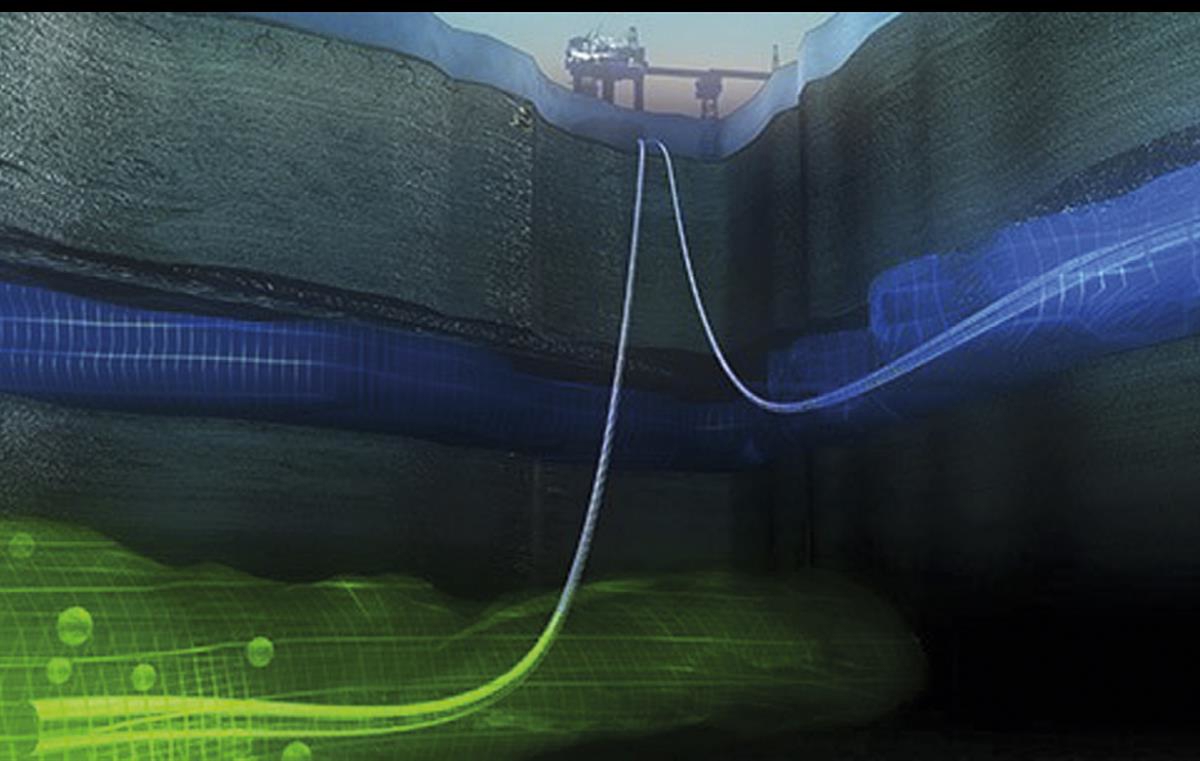
Picture: Illustration of CO2 injection and storage on the Sleipner field in the North Sea. The gas from the field has a high content of CO2. During processing of the gas on the platform, CO2 is separated and injected into the Utsira formation far below the seabed. Since 1996, up to 1 million tonnes of CO2 a year has been stored here. Statoil is the operator for Sleipner (Photo: Alligator film/BUG, Statoil).
4.3.5 Carbon Capture and Storage (CCS)
The Norwegian government will continue its work on promoting CO2 management as a global climate mitigation tool. The Norwegian Government’s CCS strategy span activities from research, development and demonstration to large-scale projects and international work promoting CCS.
CCS comprises capture, transport and permanent geological storage of CO2 emissions from fossil-fuel combustion, industrial production and waste incineration. According to the Intergovernmental Panel on Climate Change (IPCC), CCS is a key measure for reducing global greenhouse gas emissions. Technology development in an international perspective and ways of reducing costs are key to the deployment of CCS at a global scale.
Norway has demonstrated experience with safe and secure CCS. Since 1996, CO2 from natural gas production on the Norwegian Continental shelf has been captured and reinjected into sub-seabed formations in the Sleipner and Snøhvit petroleum fields.
Since 1996, nearly one million tonnes of CO2 per year have been separated during processing of natural gas from the Sleipner Vest field and stored in the Utsira formation. Since 2014, CO2 from natural gas production at the Gudrun field has also been separated out at the Sleipner Vest platform and stored there.
Since 2008, the Snøhvit facility on Melkøya has separated CO2 from the well stream before the gas is chilled to produce liquefied natural gas (LNG). The CO2 is transported back to the Snøhvit field by pipeline and injected into a subsea formation. During normal operations, up to 700 000 tonnes of CO2 is stored annually.
4.3.5.1 CO2 Technology Centre Mongstad (TCM)
The Technology Centre Mongstad (TCM) is the world’s largest facility for testing and improving CO2 capture technologies. TCM has been operating since 2012, providing an arena for targeted development, testing and qualification of CO2 capture technologies on an industrial scale. It is a collaborative project between the Norwegian Government, Equinor (formerly named Statoil), Shell and Total. From 2012 to 2017 the South African Company Sasol was a partner. It was designed for long-term operation, with two plants testing two different CO2 capture technologies:
- Amine technology, in which CO2 is captured by scrubbing flue gas with a water-based solution of amines.
- Ammonia technology, which uses chilled ammonia as the solvent for absorbing CO2 from the flue gas.

Picture: Technology Center Mongstad (TCM) Photo: Helge Hansen/Statoil
The TCM facility was designed to be versatile enough to test CO2 capture using flue gas either from the combined heat and power (CHP) plant or from the refinery at Mongstad. So far, the companies Aker, Alstom, Shell Cansolv, Carbon Clean Solutions, IoN Engineering and Fluor have all used the test facility.
4.3.5.2 Research and technology development
In Norway, government funding for CCS research is provided through the CLIMIT programme and a Centre for Environmental-friendly Energy Research. The CLIMIT programme is a national programme for research, development and demonstration of technologies for capture, transport and storage of CO2 from fossil-based power production and industry. The programme supports projects in all stages of the development chain, from long-term basic research to build expertise to demonstration projects for CCS technologies. Projects under the CLIMIT programme have yielded important results for the development of CCS in Norway and internationally.
In addition, a Centre for Environment-friendly Energy Research for CCS, NCCS, has been established. The centre is co-financed by the Research Council of Norway (governmental agency), industry and research partners.
4.3.5.3 Large-scale CCS
A full-scale CCS demonstration project, Longship, for capture, transport and storage of CO2 is under development in Norway. The Longship project is a central part of the Norwegian government’s policy for CO2-management, and of Norway’s contribution to developing necessary climate technologies. The project consists of two Norwegian CO2 capture facilities, Hafslund Oslo Celsio (waste incineration) and Norcem (cement), and a CO2 transport and storage project, The Northern Lights (Equinor, Shell and Total). The permanent storage will take place on the Norwegian continental shelf. Northern Lights is engaging with industrial emitters around the North Sea to enlarge the project in a possible next phase.
The Longship project is a result of close cooperation between the Government and the industrial partners over many years. Gassnova, the state enterprise for CCS in Norway, is responsible for coordination of the entire CCS chain. The Government has funded the two above mentioned capture projects in Norway, as well as the storage facility. The expected costs for Longship are NOK 27.6 billion, of which the expected government contribution is NOK 17.9 billion.
The Northern Lights project is expected to be operational in 2024. In its first phase, the potential is 1.5 million tonnes of CO2 stored annually for 25 years. In its second phase, the potential is of 5 mill tonnes stored annually. In addition, the Government has awarded two new exploration permits for CO2 storage acreage, in the North Sea and in the Barents Sea respectively.
4.3.5.4 International support and activities
In order for CCS to play an effective role in climate change mitigation, international cooperation on developing and commercialising new technology is essential. Norway collaborates with relevant countries on a bilateral basis, as well as the European Commission, and various regional and international fora. Examples of such fora are North Sea Basin Task Force, The Clean Energy Ministerial, The Mission Innovation and The Carbon Sequestration Leadership Forum. Norway furthermore provides funding for CCS projects abroad in cooperation with other countries and through existing programmes and institutions.
Estimated effect on national emissions
The Norwegian CCS policy will help to develop and demonstrate CO2 capture and storage technologies with a potential for technology transfer. The full-chain demonstration project in Norway, Longship, should contribute to knowledge sharing and technology development in an international perspective. The Norwegian government’s policy includes research, development and demonstration, and international work for the implementation of CCS as an international mitigation measure.
The full-scale project will lead to emission reductions from 2025, if the projects at the cement factory and waste-to-energy plant are realized. It is estimated that the CCS on these plants will reduce the emissions 0.4 million tonnes annually from 2025, and 0.8 million annually from 2027. It is difficult to quantify the emission reductions that will be realized through the policy beyond this.
Table 4.8 Summary policies and measures, CCS.
Name of policy or measure a | Sector(s) affected b | GHG(s) affected | Objective and/or activity affected | Type of instrument c | Status of implementation d | Brief description e | Start year of implementation | Implementing entity or entities | Estimate of mitigation impact (not cumulative, in kt CO2 equivalents) | |||
|---|---|---|---|---|---|---|---|---|---|---|---|---|
2020 | 2025 f | 2030 f | 2035 f | |||||||||
Carbon capture and storage (CCS) * | Industrial processes, waste | CO2 | Reduce emissions | Economic, research | Adopted g | CCS is a key tool for reducing global greenhouse gas emissions. Work in this field is focusing on the development of technology and ways of reducing costs. The government supports a full-scale CCS demonstration project, which consist of two capture sites in Norway, and transport and storage of CO2 at the continental shelf. | 2005 | Ministry of Petroleum and Energy | 0 | 400 | 800 | 800 |
For note and footnotes, see under table 4.2
g Custom footnote. Under construction.
Box 4.6 Ambition for offshore wind production
The Norwegian government has announced an ambition to allocate areas for 30 GW offshore wind power production, by 2040. This is nearly equivalent to the total amount of electricity produced in Norway today. The Norwegian government is currently preparing to allocate seabed for the first commercial scale offshore wind projects in Norway. Two of the projects will be bottom-fixed with a capacity of 1,5 GW each, placed in Sørlige Nordsjø II next to the Danish boarder. The other 3–4 projects will be floating offshore wind farms totalling 1,5 GW, placed in Utsira Nord on the Norwegian west coast.
Norway had an early start with floating offshore wind. The world’s first floating turbine, Hywind Demo, was installed in 2009. Building on this experience, The Hywind Tampen project is a floating offshore wind farm consisting of 11 wind turbines that will provide electricity for the Snorre and Gullfaks fields in the North Sea. It will be the first floating wind farm to power offshore oil and gas platforms with a system capacity of 88 MW. The first wind turbines are on stream, and all 11 turbines within 2023.
This is, as of today, the largest floating wind farm under development.
4.3.6 Energy and transformation industries
Taxes and emission pricing through participation in the EU emissions trading system (ETS) are key tools of Norwegian climate policy. They raise the price of energy use that results in greenhouse gas emissions and encourage low-emission energy production. More than 85 per cent of Norway’s emissions are taxed and/or regulated through the EU ETS.
The EU ETS also influences Norwegian electricity prices because Norway trades electricity with the rest of Europe. One of the effects of the EU ETS is to raise the cost of fossil electricity production in Europe, thus pushing up electricity prices. This has an effect on electricity prices in Norway as well, even though production is based on hydropower.
4.3.6.1 Electricity tax
A tax on consumption of electricity was introduced in 1951. At present, an excise duty is levied on electricity supplied in Norway regardless of whether the power is generated domestically or imported. Households, agriculture, service industries and the public sector are subjected to the ordinary rate, which in 2022 is NOK 0.0891 per kWh for January to March and NOK 0.1541 per kWh for April to December. Electricity used in chemical reduction and in electrolytic, metallurgical and mineralogical processes, greenhouses and rail transport, as well as households and public services in the action zone in the county of Troms and Finnmark, is exempted from the electricity tax. Electricity used in other manufacturing industries, mining and quarrying, data centres, commercial shipping and district heating is subject to a reduced rate, which in 2022 is NOK 0.00546 per kWh.
Estimated effect on national emissions
The objective of the excise duty on electricity is mainly fiscal, but the tax also provides incentives for citizens and firms to reduce their consumption of energy. The supply of electricity in Norway comes primarily from hydroelectric power plants. Consequently, reduced consumption of electricity will not have a direct effect on greenhouse gas emissions in Norway.
4.3.6.2 Base tax on mineral oils etc.
The base tax on mineral oil was introduced in 2000. The original intention of the base tax was to avoid substitution of electricity in the heating market when the electricity tax was raised. From 2020 the use of mineral oil for heating of buildings has been banned, so the original intention of the tax is no longer relevant. Today the tax is mainly a fiscal tax. The tax applies to mineral oil used for other purposes than road transport, but aviation, shipping and fishing are exempted. In 2022 the base tax is NOK 1.76 per litre. A reduced rate (in 2022 NOK 0.23 per litre) applies to the pulp and paper industry and dyes and pigment industry.
Estimated effect on national emissions
The base tax on mineral oil is not regarded as a climate policy instrument. estimated. Mineral oil encompassed by the base tax is also encompassed by the CO2-tax on mineral products. The Norwegian Ministry of Finance has developed a model to analyse the mitigation effects of changes in the taxes on GHGs. The model combines price data, volume data from the tax authorities, and elasticities from economic literature to predict the mitigation effect of each tax for the different sectors and products that the tax covers. Results from this model indicates that removing the base tax on mineral oil in 2022 would increase annual emissions by roughly 40 000 tonnes of CO2.
4.3.6.3 Electricity Certificate Act
1st January 2012 Norway and Sweden established a common market for electricity certificates. The goal of the two countries was to develop new electticity production based on renewable energy sources amounting to 28.4 TWh by the end of 2020. Sweden will finance 15.2 TWh and Norway 13.2 TWh. In May 2019 Norway and Sweden achieved the goal of 28.4 TWh. Sweden has established an additional goal of 18 TWh in 2030, which will be financed by Sweden. The new goal of 46.4 TWh was achieved in March 2021. The policy change of 18th September 2020, and resulting laws in Sweden, establish a common end date for the certificate scheme 31st December 2035. In both Norway and Sweden renewable energy plants with an operating date after 31st December 2021 is not eligible for electricity certificates. The electricity certificate market is a constructed market in the sense that the demand for certificates arises from a statutory obligation for specified electricity users to purchase them. Sales of electricity certificates give power producers a supplementary income in addition to that derived from sales of electricity. For more information about the electricity certificate scheme, see the Norwegian Water Resources and Energy Directorate’s annual report for 2019.
Estimated effect on national emissions
The electricity certificate system is a market based support scheme to promote new electricity production based on renewable energy sources. The support scheme is technology neutral, which means that all energy sources defined as renewable energy sources in accordance with Directive 2009/28/EC on the promotion of the use of energy from renewable sources qualifies for the right to certificates. For Norway most of the electricity were already produced from renewable energy sources. The effects on national emissions are indirect, and not possible to calculate.
4.3.6.4 Energy requirements in the building code
The building code (Byggteknisk forskrift – TEK177) is the main legal instrument for improving energy efficiency. The energy requirements specify that installation of fossil fuel heating installations are not permitted and that larger buildings (more than 1000 m2 heated usable floor space) must have flexible heating solutions.
New buildings and buildings subject to major rebuilds must meet either a total net energy need for space heating, cooling and hot water lower than specified in the regulation (kWh per m2 of heated floor area per year) for 13 different building categories, as shown in table 4.6.
Table 4.9 Total net energy requirements for various buildings according to the new building code of 2016.
Building category | Total net energy requirement [kWh/m2 heated gross internal area per year] |
|---|---|
Small houses and leisure homes with more than 150 m2 of heated gross internal area | 100 + 1.600/m2 heated gross internal area |
Block of flats | 95 |
Kindergarten | 135 |
Office building | 115 |
School building | 110 |
University/university college | 125 |
Hospital | 225 (265) |
Nursing home | 195 (230) |
Hotel building | 170 |
Sports building | 145 |
Commercial building | 180 |
Cultural building | 130 |
Light industry/workshop | 140 (160) |
Residential buildings can also use a set of energy efficiency measures for individual building components to meet the energy efficiency requirements, as shown in table 4.7.
Table 4.10 Energy efficiency measures for individual building components.
Energy-saving measures | Small house | Block of flats | |
|---|---|---|---|
1. | U-value outer walls [W/(m2 K)] | ≤ 0.18 | ≤ 0.18 |
2. | U-value roof [W/(m2 K)] | ≤ 0.13 | ≤ 0.13 |
3. | U-value floors [W/(m2 K)] | ≤ 0.10 | ≤ 0.10 |
4. | U-value windows and doors [W/(m2 K)] | ≤ 0.80 | ≤ 0.80 |
5. | Proportion of window and door areas of heated gross internal area | ≤ 25% | ≤ 25% |
6. | Annual mean temperature efficiency ratio for heat recovery systems in ventilation systems (%) | ≥ 80% | ≥ 80% |
7. | Specific fan power (SFP) in ventilation systems [kW/(m3/s)] | ≤ 1.5 | ≤ 1.5 |
8. | Air leakage rate per hour at 50 Pa pressure difference | ≤ 0.6 | ≤ 0.6 |
9. | Normalised thermal bridge value, where m2 is stated as heated gross internal area [W/(m2 K)] | ≤ 0.05 | ≤ 0.07 |
Regardless of which option is chosen, all new buildings must meet minimum requirements for windows (U-value ≤1.2) roofs and floors facing free air (U-value ≤0.18), exterior walls (U-value ≤0.22) and air tightness (air change per hour at 50 Pa pressure difference ≤1.5).
Estimated effect on national emissions
As mentioned in chapter 2, Norway is in a special position in relation to renewable energy use. Nearly all of Norway’s electricity production is based on hydro power, hence the effect on emissions from the changes in energy use is moderate and will not directly affect greenhouse gas emissions in Norway. Over time, regulations of fossil fuel heating installations have become stricter. In 2016, a ban on installation of fossil heating in new buildings and after larger renovation was introduced. The gradual development, and stricter requirements on fossil fuel heating installations have limited the opportunity to use fossil fuel heating in new buildings. The impact on national CO2 emissions are however limited, because estimations indicate that very few new buildings did install heating solutions for fossil fuels even before the ban. The effect is therefore not estimated. Ban on the use of fossil fuels for heating of buildings from 2020 are elaborated below.
4.3.6.5 Ban on the use of mineral oil for heating of buildings from 2020 and house construction sites from 2022
In June 2018, the government adopted a regulation banning the use of mineral oil (fossil oil) for heating of buildings from 2020. The ban covers the use of mineral oil for heating in residential buildings, public buildings and commercial buildings. The use of mineral oil for heating of agricultural buildings and hospital buildings with 24-hour continuous patient care are exempt from the ban until January 1, 2025. From 2022, the ban was extended to also cover temporary use of mineral oil for heating and drying on construction sites. The purpose of the ban is to reduce greenhouse gas emissions from heating of buildings.
Estimated effect on national emissions
Use of mineral oils for heating of buildings has been regulated through different measures such as CO2 tax, mineral oil tax, standards in the building code and support schemes from Enova and municipalities. The ban on the use of mineral oils for heating of most buildings from 2020 means that most residential, public, and commercial buildings has phased out emissions from such use.
Total direct emissions from heating of households and businesses have declined by more than 80 per cent since 1990, from 2.7 to 0.5 million CO2 equivalents. The remaining emissions are mostly from the use of gas and from wood burning. The projection estimates emissions of 0.25 million tonnes of CO2 equivalents in 2030.
It is difficult to separate the emission effect of different measures, but on the basis of assumption mentioned above the effect of the ban can be estimated to 0.4 million tonnes in 2020 and 0.2–0.3 million tonnes CO2 equivalents in 2030. The expansion to include buildings under construction or renovation is estimated to reduce emissions by an additional 80 000 tonnes per year from 2022.
4.3.6.6 Renewable Scheme
The Ministry of Agriculture and Food offers funding for investments in small scale bioenergy or combined with solar energy (earlier The Bioenergy Scheme). Funding is provided through grants for investments, studies and training measures. The budget is substantially increased over the last years, responding to increasing demand. The main objective is to encourage farmers and forest owners to produce, use and supply feedstocks for bioenergy or heating. From 2023 the Scheme will be organized as a part of Bionova (see box in chapter 4.10). Support is also granted to develop
Table 4.11 Summary policies and measures, energy and transformation industries.
Name of policy or measure a | Sector(s) affected b | GHG(s) affected | Objective and/or activity affected | Type of instrument c | Status of implementation d | Brief description e | Start year of implementation | Implementing entity or entities | Estimate of mitigation impact (not cumulative, in kt CO2 equivalents) | |||
|---|---|---|---|---|---|---|---|---|---|---|---|---|
2020 | 2025 f | 2030 f | 2035 f | |||||||||
Electricity tax * | Cross-cutting | CO2 | Reduce electricity consumption | Fiscal | Implemented | Tax on electricity consumption | 1951 | Ministry of Finance | NE | NE | NE | NE |
Base tax on mineral oils etc * | Cross-cutting | CO2 | Increase in renewable energy | Fiscal | Implemented | Excise duty on mineral oils | 2000 | Ministry of Finance | 40 | 40 | 40 | 40 |
Electricity Certificate Act * | Energy | CO2 | Increase in renewable energy | Economic | Implemented | Norway and Sweden will increase their renewable electricity generation by 28.4 TWh from 2012 to the end of 2020 (an average of 3.2 TWh yr.) | 2012 | Ministry of Petroleum and Energy | NE | NE | NE | NE |
Energy requirements in the building code * | Energy | CO2 | Efficiency improvements of buildings | Regulatory | Implemented | Energy requirements in buildings to ensure more energy efficient buildings. | 2007 | Ministry of Local Government and Regional Development | NE | NE | NE | NE |
Ban on the use of mineral oil for heating of buildings from 2020 and house construction sites from 2022 * | Energy | CO2 | Efficiency improvements of buildings | Regulatory | Implemented | The ban covers the use of mineral oil for both main heating (base load) and additional heating (peak load), in residential buildings, public buildings, commercial buildings, and for temporary heating og drying of materials in buildings under construction or alteration. | 2020 | Ministry of Climate and Environment/Ministry of Petroleum and Energy | 400 | 430 | 380 | 330 |
Renewable Scheme * | Energy | CO2 | Replace fossil energy with bioenergy | Economic | Implemented | Monetary support schemes for converting to bioenergy. | 2003 | Ministry of Agriculture and Food | 100 | 110 | 175 | 175 |
For note and footnotes, see under table 4.2.
small scale climate friendly technology adjusted for the agricultural sector.
Estimated effect on national emissions
By 2021, installations funded through the Renewable Scheme had an accumulated production capacity of 552 GWh. This is estimated to have reduced emissions from fossil fuels by about 100 kt CO2-equivalents by 2020. Based on a presumption that the program will be continued towards 2030, and that the program contributes to emission reductions as observed so far, the estimated effect will be a reduction of 110 kt tonnes CO2 -equivalents in 2025, rising to 175 kt CO2-equivalents in 2030 and 2035.
4.3.7 Transport
4.3.7.1 Introduction
The transport sector accounts for about 1/3 of Norwegian greenhouse gas emissions, and around 2/3 of the ESR emissions. There are several measures in place that affect greenhouse gas emissions from the transport sector. The tax policy is central, and the most important measure is the CO2 tax, which is a cross-sectoral measure (see chapter 4.3.2.3.). In addition, the vehicle tax policy contributes to shifting vehicle demand towards low and zero emission vehicles. Norway also has a quota obligation for biofuels for road traffic, see chapter 4.3.7.2.4. In addition there are several other measures, such as Enova’s grant schemes, requirements in public procurement processes etc.
4.3.7.2 Taxes and regulations affecting emissions from road transport
Norway has several overlapping and impactful policies affecting emissions from road transport. The Norwegian tax scheme on emissions under the ESR, tax advantages and incentives towards the purchase of low and zero emission cars, a road usage tax levied on fuels and a biofuel sales mandate all affect emissions. Due to the overlap of these measures the effect of one measure will depend on whether the other measures are present or not. We therefore report the total effect on emissions for all measures with a substantial effect on emissions from road transportation. The individual measures are described below the discussion of effects on national emissions, under chapter 4.3.2.7.1 – 4.3.2.7.4. The taxes on emissions under the ESR are described under chapter 4.3.2.2.
Estimated effect on national emissions
Electric vehicles Norway has the largest EV share in the world. Without the incentives, the EV share would probably be more in line with what is observed in countries without incentives. To analyse the effect on emissions we compare the EV share to a country with few incentives towards the purchase of EVs. The EV-share in Australia is approximately 1.5 per cent In total, Norwegian EVs drove approximately 6 bill. kilometeres in 2022, and the EV share is 17 per cent of personal cars. If the EV share was 1.5 per cent instead, 5.5 mill. of those kilometeres is assumed to be driven by conventional cars with internal combustion engines (ICE) instead, with an average fuel efficiency of 0.8 and 0.65 litres per ten kilometeres for petrol and diesel cars. The effect covers both the VAT-exemption, one off registration taxes and other advantages for EVs. While the registration tax also favours hybrid cars over pure ICEs, the main effect of the tax going forward is assumed to be incentivizing the sales of EVs, thus the effect on emissions due to increased sales of hybrid vehicles is not calculated explicitly.
The use of biofuels, blended or pure, has led to reduced CO2 emissions from road vehicles. The estimated emission reduction for 2020 is based on estimated consumption of fossil fuels adjusted for the increased consumption an abolishment of all EV-incentives would entail. Due to double counting of advanced fuels the actual share of biofuels is represented by an interval. The observed share of biofuels in 2021 is used as a point estimate. In the calculation of the CO2 effect, it is taken into account that the energy content in biofuel is lower than in fossil fuel, i.e. 1 litre of biofuel replaces less than 1 litre of fossil fuel. Since biofuels are more expensive than fossil fuels the sales mandate will lead to an increase in prices.
The taxes on emissions under the ESR and the road usage tax both levy a priceon fossil fuels, reducing consumption and thereby emissions. The Norwegian Ministry of Finance has developed a model to analyse the mitigation effects of changes in the taxes on GHGs. The model combines price data, volume data from the tax authorities, and elasticities from economic literature to predict the mitigation effect of each tax for the different sectors and products that the tax covers. The analysis has been adjusted to include the increased sales volumes of fossil fuels stemming from an abolishment of the biofuel sales mandates and abolishing the incentives towards purchasing low and zero emission vehicles.
The total effect on emission is estimated to approximately 4 million tonnes of CO2 in 2020. The effect of these measures is also estimated to increase drastically toward 2035, largely due to the gradual influx of EVs in the passenger car fleet. Effects for 2025, 2030 and 2035 are calculated assuming that without these measures, emissions from Norwegian road transportation would remain stable over the period 2020–2035 instead of being reduced by half by 2035. Effects for 2025, 2030 and 2035 are estimated to be 5.4, 6.8 and 9 million tonnes respectively.
4.3.7.2.1 Tax advantages for electric vehicles
Norway provides very strong tax incentives for zero emission vehicles, through the value added tax, the one-off registration tax and the road usage tax on fuels.
The value added tax is a general tax on the domestic consumption of goods and services which is intended to raise revenues for the central government. The standard rate of value added tax in Norway is 25 per cent and to most goods and services, including vehicles.
Since 2001, electric cars (EVs), has been zero-rated in the value added tax. This gives a very strong incentive to choose electric cars, but also a considerable revenue loss, as the share of EVs increases. In the budget proposal for 2023, the Norwegian Government has proposed to introduce value added tax on the purchase amount for electric cars over NOK 500 000.
The one-off motor vehicle registration tax was introduced in 1955. The original intention of the tax was to slow down the import of foreign capital-intensive goods. Now the tax is regarded as a fiscal tax, but that has been used extensively to give economic incentives to choose low and zero emissions vehicles.
Since 1990, electric cars have been exempted from the one-off registration tax. As the one-off-registration tax for an ICE car can typically be NOK 200 000, the exemption gives a very strong incentive to choose electric cars, but also gives a considerable revenue loss, as the share of EVs increases.
The traffic insurance tax was introduced in 1917 and is an annual tax on car ownership. Between 1996 and 2020, electric cars were exempted. In 2021, a reduced rate applied to electric cars, and from 1. March 2022, the tax rate for electric cars is the same as for ICE cars.
The re-registration tax was introduced in 1956. It’s a fiscal tax instead of value added tax on the sale of used vehicles. Between 2018 and 2021, electric cars were exempted. In 2022, a reduced rate (25 per cent of the general rate), applies to electric vehicles.
The road usage tax on fuel was introduced in 1931. The intention of the tax, besides creating revenue, is to price the external costs of road transport, except emissions of CO2. The major external costs are congestion, noise, accidents, wear and tear and local emissions. The road usage tax applies to petrol, mineral oil, biodiesel, bioethanol, natural gas and LPG. Electricity is not encompassed by the road usage tax. This gives an economic incentive for electric cars.
Tax expenditures are provisions of tax law, regulation, or practice that reduce or postpone revenue for a comparatively narrow population of taxpayers relative to a benchmark tax. Table 4.9 shows the estimated tax expenditures related to EVs in Norway in 2022.
Table 4.12 Tax expenditures for EVs in 2022. Mill. NOK.
EVs are zero-rated in the VAT | 13 400 |
|---|---|
EVs are exempted from the one-off registration tax | 10 000 |
EVs have reduced traffic insurance tax (until 28 February 2022) | 265 |
EVs have reduced re-registration tax | 225 |
Source: Ministry of Finance
Figure 4.3
Figure 4.4 Share of EVs of new passenger cars and in the fleet of passenger cars. 2012–20221. Per cent.
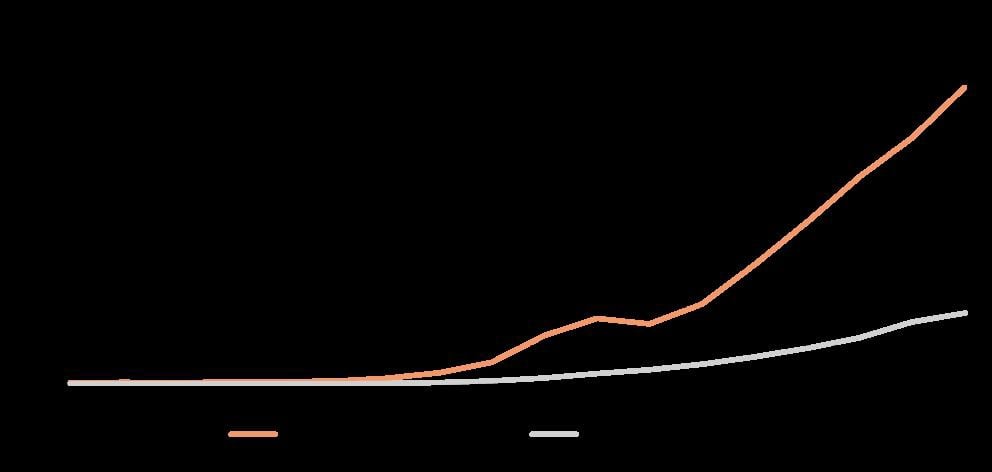
1 January to August 2022.
Source: Norwegian Road Federation and Ministry of Finance
The non-inclusion of electricity in the road usage tax is not considered a tax expenditure, but it constitutes a tax advantage of EVs of approximately 1 500 mill. NOK in 2022.
As the one-off registration tax is dependent on CO2-emissions, the tax in itself is an advantage for zero-emission vehicles. This is not considered as a tax expenditure. If the average one-off registration tax on ICE cars also would apply to EVs, the revenue from the one-off registration tax would increase with 23 700 mill. NOK in 2022.
The tax incentives for electric vehicles, together with non-tax incentives, has had a major effect on the sale of electric vehicles, ref. figure 4.4. The share of new zero emission cars in the sales of new cars in 2021 was about 65 per cent. By the end of 2021, 16.2 per cent of the Norwegian passenger car fleet was battery electric. This is the largest share of electric cars as percentage of the entire passenger car fleet in the world.
The tax incentives for electric vehicles, combined with a rapid increase in the share of electric vehicles, has resulted in reduced revenue from car related taxes and the value added tax. Figure 4.4 shows that the revenue from car related taxes has been reduced by approximately 50 per cent, in real terms, from 2007 to 2022. Figure 4.5 shows the rapid increasing tax expenditure related to EVs being zero-rated in the VAT.
Figure 4.5
Figure 4.6 Revenue from motor vehicle taxes and fuel taxes in road transport, 2023-bill. NOK.
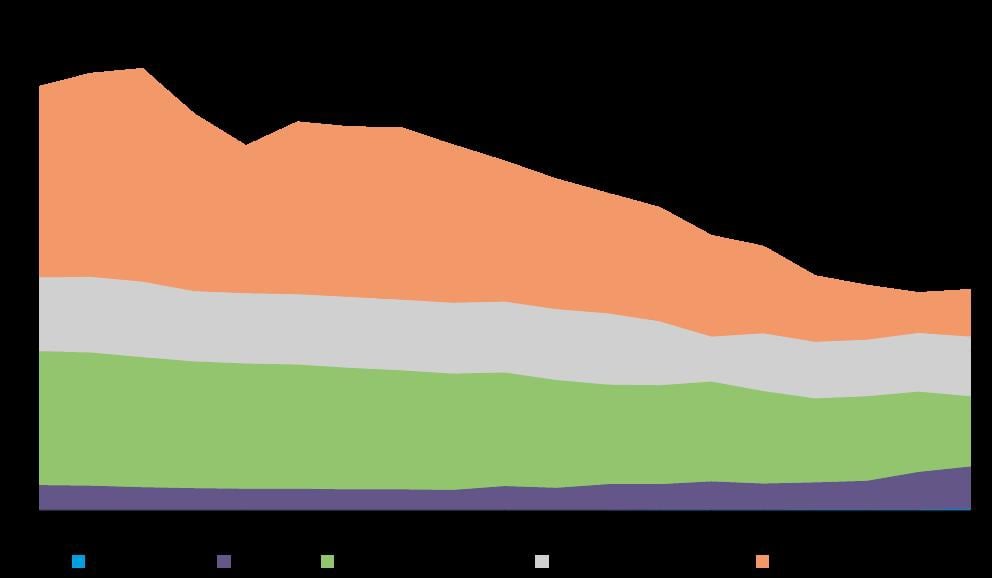
Source: Statistics Norway and Ministry of Finance.
The National Transport Plan 2018–2029 (Meld. St. 33 (2016–2017) Report to the Storting (white paper)) set targets for the sales of zero emission vehicles. These targets were continued in the National Transport Plan 2022–2033 (Meld. St. 20 (2020–2021) Report to the Storting (white paper)). For instance, all new passenger cars and light vans should be zero emission in 2025. Improvements of technological maturity in the vehicle segment that makes zero emission cars competitive with fossil solutions is a prerequisite for the target figure.
Figure 4.7
Figure 4.8 Tax expenditure from EVs being zero-rated in the VAT, 2022-bill. NOK.

Source: Ministry of Finance.
Box 4.7 Other advantages for electric vehicles
In addition to the tax benefits, EVs have other benefits, such as access to bus lanes (decided locally), reduced toll fares, a rebate on car ferry crossings, and reduced parking fees on public parking spots. Norway has more than 20 000 publicly available charging points, and over 5000 of these are fast charging points. Many publicly available charging points have received funding via the state-owned enterprise Enova.4.3.7.2.2 One-off registration tax based on CO2-emissions
The one-off motor vehicle registration tax was introduced in 1955. The original intention of the tax was to slow down the import of foreign capital-intensive goods. Now the tax is regarded as a fiscal tax, but that has been used extensively to give economic incentives to choose low and zero emissions vehicles.
From 2007 CO2 emissions was introduced in the tax base. The main reason for including CO2 emissions in the calculation of the registration tax was to reduce CO2 emissions from new cars. Since 2007 the registration tax has been shifted to place greater weight on CO2 emissions. The registration tax on cars now depends on the weight, CO2 and NOX emissions of the car. Changes in the motor vehicle registration tax towards a system that rewards vehicles with low CO2 emissions and penalizes vehicles with high emissions have contributed to reduced emissions from new cars.
In 2007 CO2 emissions was introduced in the tax base of the one off registration tax. This resulted in an immediate drop in average CO2 emissions from new passenger cars, see figure 4.7. From 2006 to 2007, the average CO2 emissions from new passenger cars in Norway was reduced by 10.2 per cent. For comparison, from 2006 to 2007 the average CO2 emissions from new passenger cars in EU was reduced by 1.6 per cent. The decline in average CO2 emissions of new passenger cars continued to be somewhat higher in Norway than in EU, until 2013. Since 2014, the average CO2 emissions from new passenger cars have dropped considerably in Norway due to the increased share of electric vehicles.
Since diesel cars have lower CO2 emissions than petrol cars, the introduction of the one-off registration tax for new passenger cars based on CO2-emissions resulted in a decrease in the sales of petrol cars and an increase in the share of diesel cars, see figure 4.8. In addition, the share of fuel- efficient cars increased. Since 2011, the share of electric vehicles has increased rapidly, due to the tax advantages for electric vehicles (see 4.3.7.2).
4.3.7.2.3 Road usage tax
The road usage tax on fuel was introduced in 1931. The intention of the tax, besides creating revenue, is to price the external costs of road transport, except emissions of CO2. CO2 emissions from road transport are priced by the CO2 tax on mineral products, see 4.3.2.2 The major external costs are congestion, noise, accidents, wear and tear and local emissions. The road usage tax applies to petrol, mineral oil, biodiesel, bioethanol, natural gas and LPG. The 2022 tax rates are shown in table 4.10.
Figure 4.9 CO2-component of the one-off registration tax on motor vehicles. Total tax in NOK and marginal tax in NOK per g/km CO2-emissions (WLTP). 2022.
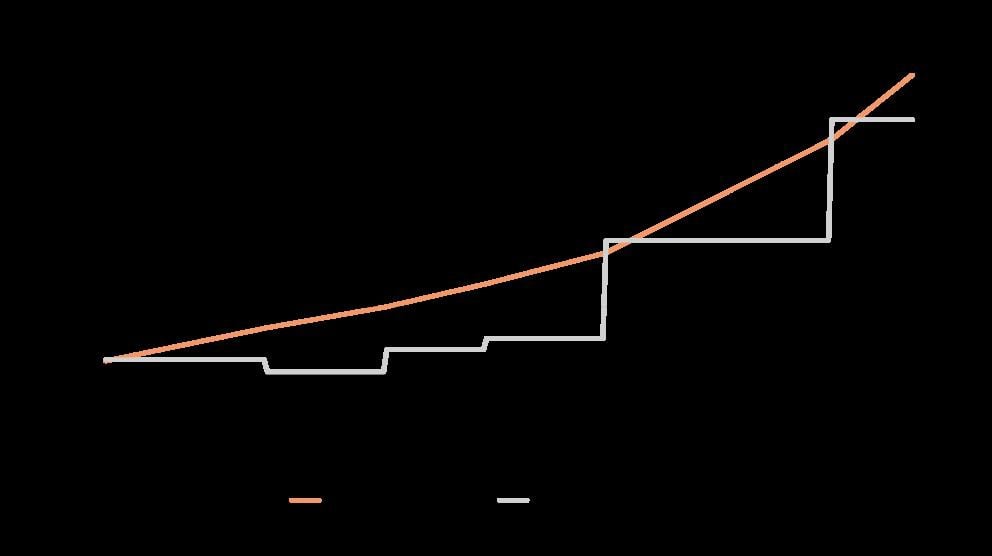
Figure 4.10
Figure 4.11 Average CO2 emissions from new passenger cars. Grams/km.
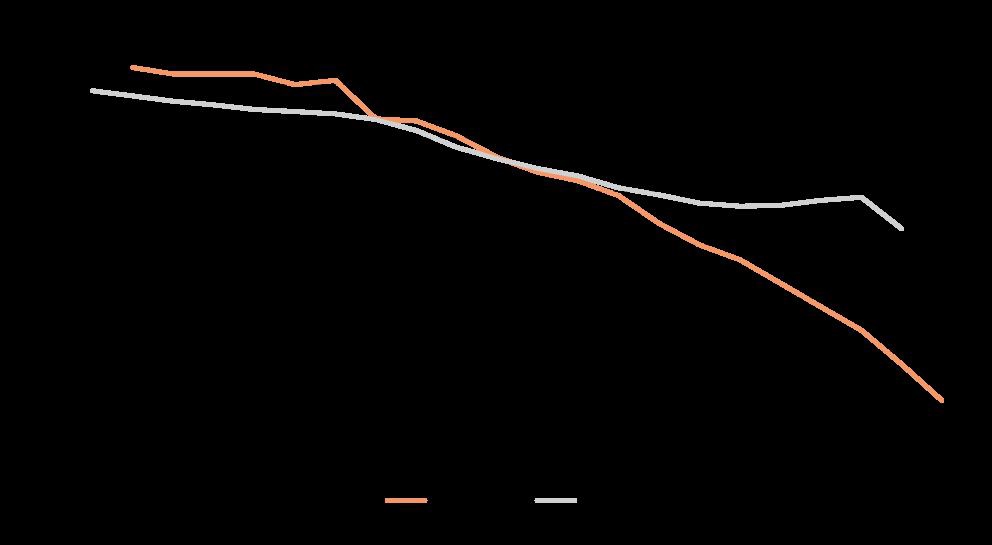
Source: European Environment Agency and Norwegian Road Federation.
Figure 4.12 New passenger cars by fuels.
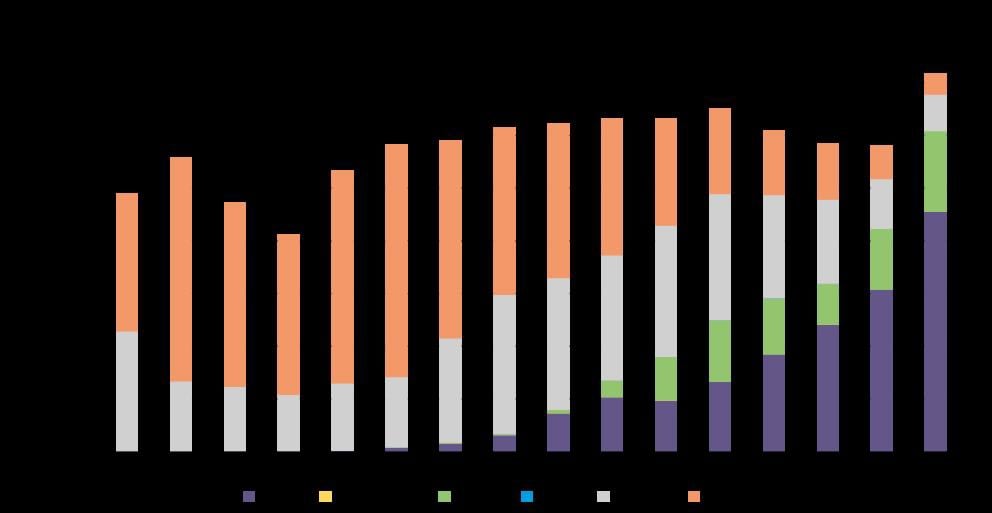
Source: The Norwegian Public Roads Administration.
Table 4.13
Table 4.14 Road usage tax on fuels.
Fuel | Tax rate |
|---|---|
Petrol, NOK per litre | 4.95 |
Mineral oil, NOK per litre | 3.52 |
Bioethanol, NOK per litre | 2.02 |
Biodiesel, NOK per litre | 3.09 |
Natural gas, NOK per Sm3 | 2.76 |
LPG, NOK per kg | 5.05 |
Source: Ministry of Finance
4.3.7.2.4 Biofuel requirement road transport
There is a mandatory biofuels turnover in Norway. A quota obligation was introduced in 2009, committing the economic operators to sell at least 2.5 per cent biofuels as a share of the total yearly amount of fuel sold for road transport. The quota obligation has since been increased several times. The obligation is 24.5 per cent (since January 1st, 2021) including double counting of advanced biofuels. In the quota obligation in Norway ‘advanced biofuels’ means biofuels that are produced from the feedstock listed in Part A and part B of Annex IX in the EU ILUC-directive (Directive (EU) 2015/1513). This definition of advanced biofuels differs from both the ILUC-directive and the Renewable Energy Directive (Directive (EU) 2018/2001), where only biofuels from feedstock listed in Part A are considered ‘advanced’. As of January 1st, 2014, sustainability criteria must be met by all biofuels and bioliquids included in renewable energy obligations or government support schemes. The sustainability criteria are the EU criteria implemented in the Fuel Quality Directive and the Renewable Energy Directive. Norway aims to promote development of the value chain for advanced biofuels. Since January 1st, 2014, advanced biofuels are double counted towards the quota obligation. In addition, a subtarget was introduced in the quota obligation on January 1st, 2017, requiring at least 0.75 percentage points of the quota obligation (without double counting) to be met by the use of advanced biofuels. This sub target has been increased several times and is at 9 per cent (since January 1st, 2021).
In addition to the quota obligation, the CO2 tax is levied on mineral products. This entails that petrol and diesel are subject to CO2 tax, whereas bioethanol, biodiesel and hydrogen are not. The amount of biofuels in petrol and auto diesel sold has increased since 2006, cf. Table 4.11.
Table 4.15 Content of biofuels in petrol and auto diesel. 2005–2020. Per cent by energy.
2005 | 2010 | 2015 | 2020 | |
|---|---|---|---|---|
Petrol | 0.0 % | 0.4 % | 1.1 % | 5.8 % |
Auto diesel | 0.2 % | 5.1 % | 5.0 % | 14.5 % |
Source: Statistic Norway, Norwegian Environmental Agency and Ministry of Finance
4.3.7.3 CO2-tax on domestic aviation under the EU-ETS
Mineral oil for domestic aviation under the ETS is also subject to the CO2-tax on mineral products. The tax rate is NOK 631 in 2022. It covers close to all of Norwegian emissions from domestic aviation. The combined marginal carbon price from the tax and the ETS is estimated to be approximately NOK 1 500 per ton CO2 in 2022.
Estimated effect on national emissions
The estimated CO2 effect is 10 000 tonnes CO2 in 2025, 2030 and 2035. This is estimated using the price elasticity model developed by the Norwegian Ministry of Finance, cf. item 4.3.2.2.
4.3.7.4 Blending mandate for advanced jet biofuel in aviation
On January 1st, 2020, a requirement that 0.5 per cent of aviation fuel sold in Norway is advanced biofuels was introduced. The quota obligation applies to all suppliers of aviation fuel and covers all types of aviation fuels for both domestic and international flights. Fuel sold to flights carried out by military aircrafts, however, are exempted from the regulation due to technical requirements in the defence sector. The same definition of advanced biofuel and sustainability criteria apply as in road transport.
Estimated effect on national emissions
The estimated CO2 effect is six thousand tonnes CO2 in 2025, 2030 and 2035.
4.3.7.5 Pilot projects for fossil free construction sites
To speed up the introduction of zero-emission machines and vehicles on construction sites in the transport sector, the government established in 2021 a 6-year support scheme for increased use of zero emission equipment. With financial support from the scheme the three main public infrastructure builders have established twelve different pilot projects. The main objectives of the pilot projects are to speed up implementation, gain knowledge and experience, identify risks and potential barriers and support technology development. In the National Transport Plan 75 mill NOK per year has been proposed as a financial scope. For 2022, 62 mill NOK was granted by Parliament.
Estimated effect on national emissions
The first pilots have very recently started. Thus, the direct effect from the scheme has not been possible to estimate, but the emissions from machines and vehicles used in transport infrastructure projects are estimated to be at least 4–5 per cent of the total emissions from the transport sector, 600–700 000 tonnes CO2 equivalents. Speedier introduction of non-emission machines and advanced technology development could also benefit other sectors and thereby lead to an even larger reduction in national emissions.
4.3.7.6 Urban growth agreements and reward schemes for public transport.
To prevent car-based traffic growth that contributes to greenhouse gas emissions, queues and air and noise pollution, Norway has a goal of zero growth in passenger transport by car in large urban areas.
The zero-growth target is followed up through comprehensive, long-term urban growth agreements that include road-, public transport-, bicycle-, walking- and land use-measures as well as restrictive measures for car traffic such as road tolls and parking restrictions. The purpose is better coordination between the state and local authorities that are responsible for various measures and instruments in urban areas. The solutions chosen shall contribute to reduce the need for car-based transport and facilitate that more people can walk, cycle and use public transport. Great efforts are required to achieve the zero-growth target and significant government contributions, in addition to other policy instruments.
The nine largest urban areas in Norway either have an urban growth agreement or a reward scheme for public transport. The agreements are concluded between the government, the municipalities and the county council in urban areas.
Estimated effect on national emissions
It is difficult to single out the effect of measures in the urban growth agreements and the reward schemes for public transport. For instance, the effect on greenhouse emissions of more cycling and walking depends on this transport being replaced by travels with fossil cars. Nevertheless, the Norwegian Public Roads Administration has made a simplified analysis of the effect of the zero growth target, aggregates for all measures. The analysis indicates that zero growth in passenger traffic by cars in the nine largest urban areas could reduce emissions by 60 000 tons CO2 equivalents by 2030, compared to a reference path. The figures are uncertain. The reference path includes population growth, economic growth, and growth in electric car sales. It does not include technology developments such as autonomous vehicles or Intelligent Transport Systems.
4.3.7.7 Green shipping
Green shipping is a focus area for the government. The Governments ambition is to reduce emissions form domestic shipping and fisheries by half by 2030. Norway has a leading role in the climate negotiations in the UN Maritime Organization IMO and is working to ensure that a new ambition on zero emission shipping by 2050 is achieved. To cut national emissions from domestic shipping and fisheries, and to contribute to the green transition in the shipping sector, a number of policies and measures have been implemented over the years. These measures work in combination, and some emission effects will depend on several measures being in place at the same time.
4.3.7.7.1 Maximum CO2 emissions from the coastal services Bergen-Kirkenes
The Ministry of Transport is the competent authority for issuing a licence for the coastal route from Bergen to Kirkenes, and for procuring sea transport services on the route. The current contracts with Hurtigruten Coastal AS and Havila Kystruten AS entered into force in 2021 and expires December 31, 2030. Havila Kystruten’s four newbuilds run on natural gas (LNG) while Hurtigruten’s seven vessels run on a blend of marine diesel oil and biofuel. Mainly due to the pandemic Havila Kystruten’s vessels were delayed from the yard and only two vessels are in operation as of October 2022. In order to comply with the emission limits in the contracts, three of Hurtigruten Coastal’s vessels are upgraded in 2022–2024 by installation of battery packs and engine/hull modifications.
The contract sets the limit for the maximum allowed CO2 emissions from the vessels serving the Coastal Route. The annual maximum allowed emissions are 162 000 tonnes of CO2 on average for the whole contract period. All vessels must also be equipped for receiving electric power from shore, which allows operation of the ship without the use of its own machinery when the ship is docked. Electric power from shore will be used in the ports where the infrastructure facilitates it. A maximum of 0.10 per cent (wt. %) sulphur content of the fuel used is required. It is also not permitted to use heavy oil as fuel.
Estimated effect on national emissions
Emissions from the coastal route Bergen-Kirkenes in 2016, was 230 000 tonns CO2-equivalents. Based on the annual maximum allowed emissions level, it is estimated that the emissions will be reduced by approximately 60 000 tonnes CO2-equivalents in 2030. There is no contract beyond 2030, but the effect for 2030 is also assumed for 2035.
In April 2017, the Solberg Government submitted the white paper National Transport Plan 2018–2029 (Meld. St. 33 (2016–2017)) to the Norwegian Parliament. One of the main goals of this plan is “Reducing climate emissions in line with the transition to a low-carbon society and reducing other negative environmental impacts”, and for the 12-year period, the following goal has been adopted: “Reducing climate emissions in line with the Norwegian climate targets”.
Several measures are affecting greenhouse gas emissions from the transport sector. The tax policy is central, and the most important measure is the CO2-tax, which is a cross-sectoral measure (see chapter 4.3.2). In addition, the vehicle tax policy contributes to shifting vehicle demand towards low and zero emission vehicles. Norway also has a quota obligation for biofuels for road traffic, see chapter 4.3.7.2.4.
4.3.7.7.2 Requirements for zero and low-emission technology in tenders for public ferries
In 2015 the CO2-emissions from both national and regional ferry routes in Norway were approximately 600 000 tonnes, and almost all the ferries used conventional technology and marine gas oil or liquid natural gas as energy carriers. In 2021 one third of the ferries on these routes had batteries installed. The ferries are operating either all-electric or with hybrid solutions. This number is based on signed contracts with ferry operators and requirements in issued public tenders. Such a development is largely a result of requirements for zero and low-emission technology in tenders for public ferries, both on the national highways and on the regional road network. The National Public Road Administration (NPRA), the body responsible for the procurement of ferry services on the national highways, estimates that in 2030, more than two-thirds of domestic car ferry routes will be possible to operate with ferries powered by electricity.
Due to high energy demand or lack of access to electricity, there are a few ferry routes that are not suitable for all electric operation. In their analysis, the NPRA expects that ferries powered by hybrid solutions or exclusively on other energy carriers such as biogas, biodiesel, and hydrogen will operate the remaining part of the domestic ferry routes. In 2019, the NPRA signed a development contract, with the result of an electric hybrid fuel cell battery powered car ferry. The car ferry will be powered by equal amounts of hydrogen and electricity as energy carriers, and the final equipping is due in 2022. The objective of the development contract was to make zero emission technology available for ferry routes that would not be suitable for all-electric operation, and has led to yet another signed contract with the requirements of two hybrid fuel cell powered car ferries in operation in 2025. These car ferries will be powered by hydrogen in addition to biodiesel as energy carriers.
Estimated effect on national emissions
The emissions from ferries have decreased by about 100 kt CO2 from 2015 until 2020 and is estimated to decrease by a further 100 kt CO2 by 2025. This is likely as a result of the requirements for zero and low-emission technology in tenders for ferries on the national highways, on tenders that have been awarded, announced or expected as of today It’s likely that the downward trend will continue, but this is not certain. The potential emission reductions described in box 4.8 from possible new tenders from 2023 are additional.
4.3.7.7.3 Aid scheme for short sea shipping
Starting in 2017, the Norwegian Coastal Administration (NCA) provides grants to projects that move freight from road to sea by establishing new short sea services between ports in the European Economic Area (EEA), or, under special conditions, the upgrading of existing services. The objective of the aid scheme is to transfer freight from Norwegian roads to maritime transport.
Estimated effect on national emissions
By using factors8 for the emission of tonnes CO2 per tonnes kilometre of, respectively, road transport and maritime transport, the net reduction in CO2 emissions can be calculated. In order to estimate the climate mitigation impact in 2020 and 2030 it is assumed that the applications’ estimations of the amount of freight to be transferred, will be realised 100 per cent according to the business plan. The maximum funding period is three years. Grants are awarded to projects that are expected to be viable in the long run, and therefore the estimated amount of freight transferred in the fourth year of the project is assumed to be constant in the following years up to 2035.
Box 4.8 Zero emission public ferries
The current political platform in Norway states that it wants to require zero emission public ferries from 2023. The Norwegian Maritime Authority, The Norwegian Environment Agency, National Public Road Administration (NPRA), and The Norwegian Agency for Public and Financial Management (DFØ) has delivered a report to the ministry on how the requirement may be structured. The agencies suggested a strict zero emission requirement for vessels in new tenders from 2023. Furthermore, they opened for exemptions under certain criteria, such as lack of infrastructure.
Estimating the emissions effect from this requirement includes a high degree of uncertainty, because there’s a high probability that measures would have been taken in the segment without the regulation, mainly because of climate ambitions in the county councils and from the NPRA and current requirements to valuate emission reductions in new tenders. However, based on knowledge of upcoming tenders, the difficulty of the routes and assumptions of available technology, the Norwegian Environment Agency has estimated that the emission effect of the requirement could be 84 000 tonnes CO2 in 2025, 184 000 tonnes in 2030 and 364 000 tonnes in 2035.
Since the initiation of the Norwegian Aid Scheme for Shortsea Shipping, 10 projects have been approved by the Norwegian Coastal Agency (NCA). However, due to various reasons, several of the projects have been cancelled. Five of the ten approved services are in operation today. The NCA’s estimates of emission reductions is about 23 000 tonnes CO2 in 2020 and 24 000 tonnes CO2 from 2025 and onwards.
4.3.7.7.4 Green shipping programme
The government’s policy on green shipping has been developed through close cooperation between the authorities and the industry. A good example is the cooperation on the Green Shipping Programme (GSP), a public-private partnership that aims to advance the Norwegian government’s strategy and plans. The GSP perform studies, start pilots, transfer knowledge between theory and practice and facilitate dialogue and collaboration between all stakeholders. The program consists of 114 partners, 103 private companies as well as 11 government observers. The GSP is finances partly by public allocations from the state budget and partly by the members themselves. Since the program was started in 2015, 44 green pilot projects have been initiated, of which 14 have been implemented or are under construction.
Estimated effect on national emissions
Immediate effects are expected from the pilots that are realized, as well as the projects from the Service Center. The effects are ships in operation with dramatically reduced emissions, and in many cases with zero emissions. The potential in scaling of the successful pilots must not be underestimated, and the technologies that are proven feasible can be realized on a larger scale in 5–10 years. Hence, the emission reduction potential is substantially larger than what is shown in the individual projects within the programme. The effect of the pilots has not been quantified.
The emission reduction potential from the Service Center’s projects is approximately 260.000 tonnes CO2e/year. In the table below, realization of half of the projects are assumed in 2025. In 2030, an increase of projects in the portfolio is assumed, in addition to realization of the other half of today’s portfolio. A further increase is assumed in 2035.
A primary role for GSP is also to funnel projects into available public and private funding schemes, e.g. from Enova, thus enhancing the impact of these schemes. Effects in the longer run and outside of GSP are expected, as results from barrier studies, roadmaps, and reduction of business risk after successful demonstration in the pilots. A primary function of the GSP is to identify barriers through work on concrete, actual projects – and to communicate these barriers, as well as possible measures and policies to overcome them, to stakeholders including government entities. One example is the GSP barrier study on electrical ferries that accelerated the implementation of emission requirements from the authorities. The Service Center’s focus on the cargo owners stimulates the development of the market for green fuels and environmentally friendly transport services, increasing the demand for, and availability of such.
4.3.7.7.5 Risk loan scheme for Norwegian short sea vessels and fishing fleet
The loan scheme was established in 2020 and is similar to the Innovation Norway’s innovation loan scheme, but is limited for vessels in short sea shipping fleet and the fishing fleet. The aim is to stimulate green fleet renewal and reduced greenhouse emissions. The short sea segment is characterized by older vessels, which vary in size and sail between different ports on short-term contracts. Risk loans can be given to investments in new vessels using low and zero emission technology or for upgrading existing vessels into low or zero emission vessels. The risk loan scheme is state aid under GBER and supplements other public and private market-based financing and loans.
Estimated effect on national emissions
Innovation Norway (IN) has issued loans of total 290 mill. NOK, for investments on a total of 14 ships, including two fishing vessels. The risk loan scheme has given an estimated emission reduction of average 39 per cent on the projects supported by the scheme, based on self- reporting from the shipowners. The emission reduction effect has not been estimated due to lack of data.
4.3.7.7.6 Recycling scheme for short sea vessels and offshore vessels
The recycling scheme for short sea vessels was established in 2020 with the aim of fomenting fleet renewal in a segment with little ability or incentives for green fleet renewal. The intention was to give incentives for shipowners to take on investments in new vessels or upgrading existing vessels using low and zero emission technology, provided an older ship was sold off for scrapping. The grant was calculated on the basis the eligible cost of the investment, was state aid under GBER and limited to 8 mill. NOK per undertaking. The funding of the scheme was 75. mill. NOK, and a total of 16 mill. NOK was allocated. The scheme was terminated in the 2022 revised national budget.
In 2021, the Storting funded 150 mill. NOK to a recycling scheme for offshore vessels. The scheme was similar to the scheme for short sea vessels except the limit of 8 mill. NOK per undertaking and was launched in June 2021. The funding was allocated by the end of the year, supporting investments on 20 offshore vessels by recycling 11 vessels.
Estimated effect on national emissions
The schemes have supported investments on 22 ships, and a total of 14 ships have been recycled. The recycling schemes have given an estimated emission reduction of 10–25 per cent per project, based on self- reporting from the shipowners. The results have not been aggregated and are reported as not estimated.
Both schemes constitute state aid under GBER, where the eligible cost for the most part is calculated according to art 36 which is investment aid enabling undertakings to go beyond Union standards for environmental protection or to increase the level of environmental protection in the absence of Union standards. The allocation of funds has contributed to investments on ships that are significantly greener than corresponding older tonnage.
4.3.7.7.7 High speed passenger ferries scheme
In 2019, the Government introduced a new policy instrument to promote emissions reduction project for high-speed passenger ferries in Norwegian municipalities and counties called “Hurtigbåtprogrammet”. The Norwegian Environment Agency is responsible for administering the financial support scheme. The Norwegian Environment Agency assesses and prioritises the application based on given criteria. The objective of the programme is to reduce emissions from the segment and contribute to the transition to a low carbon society. Examples of supported projects are feasibility studies for zero emission vessels, development of new technologies such as battery-electric and hydrogen powered vessels, dedicated funding of new tenders that require zero emission technologies and cooperative projects between country councils.
“Hurtigbåtprogrammet” has allocated NOK 240 million to 19 different projects since it was started in 2019. There have been 5 different tenders where municipalities and county councils have competed for funding. There has been substantial interest in the scheme, and it has so far contributed to significant and necessary development of zero emission high-speed ferries.
Estimated effect on national emissions
Some projects will directly reduce emissions by implementing zero emission vessels. The estimated effect of this is around 12 000 tonnes of CO2 per year from 2025, possibly more in 2030 and 2035 depending on funded projects in upcoming tenders. The emission reduction estimates are based on the county councils own actual emissions data for current vessels in operation. These vessels will be replaced with zero or lower emission vessels. Actual emission reductions will in some tenders depend on what operators will offer, while some set clear minimum emission standards because of support from the scheme.
4.3.7.7.8 Maritime Zero 2050
The initiative Maritime Zero 2050 is directed towards development of zero emission solutions for large ships sailing long distances. The research council of Norway is responsible for the call and the funding will go to projects that will achieve new knowledge and develop new technologies and solutions, suitable for vessel segments and sailing distances which do not already have available zero emission solutions. The initiative is important for the Norwegian Government’s ambition to reduce emissions from domestic shipping and fishing vessels by half by 2030 and promote the development of zero- and low emission solutions for all vessel categories. The Norwegian government has allocated NOK 38.5 million to the initiative Maritime Zero 2050. The Research Council of Norway has distributed this to the Collaborative Project to Meet Societal and Industry-related Challenges and the calls for Innovation Project for the Industrial Sector 2022 and Demonstration Project for the Industrial Sector 2022. In June 2022, two applications related to energy efficient operation of hydrogen powered vessels and one application related to nuclear propulsion of merchant ships were approved.
Estimated effect on national emissions
The Maritime Zero 2050 call was first initiated in 2022, and the three research projects given funding this year will start up in 2023 and last until 2025 (when prototypes will be tested on board vessels etc). This means that the effect on national emissions resulting from these projects the earliest can be seen from 2025 and after. The funded projects will provide new knowledge and potential new zero-emission solutions for large ships sailing long distances, but it is not given how many ships that will be converted or replaced from conventional fossil fuel ships to zero-emission fuel ships based on this. As the relevant ships are large ships sailing long distances, it should also be noted that some of the emission reductions may be outside of Norway. The emission reduction effect has not been estimated due to lack of data.
However, it is possible to give high-level indications on emission reduction potential per ship that is converted or replaced based on the project results. For an example, looking at the project related to nuclear propulsion of merchant ships, this nuclear solution may replace a conventional LNG carrier typically consuming almost 40 000 metric tons HFO per year, which will result in emission reductions of roughly 120 000 metric tons of CO2 per ship.
The results from the two hydrogen projects will be essential elements in a combined knowledge base and technology platform that will facilitate the widespread, efficient, sustainable and safe use of liquid hydrogen for merchant ships. Optimizing entire power and propulsion systems will save large amounts of power and energy, and this is a necessary step to enable use of hydrogen and obtain reduction in GHG emissions in the maritime sector.
4.3.7.8 Investments in railways
The broad political agreement on climate gives high priority to developing a competitive railway transport system for passengers and freight. Emphasis is placed on improving the passenger rail network around the big cities, and improving capacity for freight transport. There have been substantial increases in funding for investment in new railways and maintenance of existing railways. The railway sector was granted, NOK 26.6 billion in 2020, NOK 31.9 billion in 2021 and NOK 31.8 billion in 2022.
One of the main objectives for increased investments in railways is related to the goal “zero traffic growth for passenger cars” (see above 4.3.7.8) in the nine largest city-areas in Norway. All of these cities are working towards urban growth agreements with national authorities, which obliges them to reduce growth in passenger car transport.
Estimated effect on national emissions
Investments in railway in the first six years in the National Transport Plan (2022–2033) is by the Norwegian Railway Directorate estimated to reduce the emissions with approximately 40 000 tonnes CO2 equivalents in 2026, 41 000 tonnes CO2 equivalents in 2030 and 52 000 tonnes CO2 equivalents in 2035. The reduction is mainly caused by transferred traffic from road to railway, both passengers and freight. The estimate also includes emissions from railway transport. It does not include emissions from operation, maintenance and construction of the infrastructure and land-use change. The first six years of the plan includes different projects for developing the freight and passenger services, but the concrete plan and implementation of the projects have to be decided upon in the annual budgets.
4.3.7.9 Grant funding to transport freight by rail
In order to reduce the negative external effects of transport, such as local and global air pollution, climate gases, noise, congestion and accidents, the Norwegian government aims to encourage a modal shift from road to rail and sea transport. It is a political goal to transfer 30 per cent of the freight transports that occur on distances of more than 300 km from road to rail or sea by 2030. However, rail freight companies in Norway have scarce opportunities to invest and expand due to strong competition from road transport. To improve conditions for rail freight operators, and to facilitate a shift from road to rail, the Norwegian government issued a temporary support scheme which was approved by ESA and adopted by the parliament in 2019.
According to Section 6-5 of the Regulation on Railways Operations, the Ministry of Transport has the possibility to introduce, under certain conditions, a support scheme for Railways. The Ministry have delegated this power to the Norwegian Railway Directorate. The Directorate draws up the detailed provisions in guidelines, in accordance with the notification to ESA, and administer the scheme. The scheme is financed through the annual national budget.
Estimated effect on national emissions
During 2019 to 2021, the freight transport by rail increased by annual average growth-rate of approximately 10 per cent. In the first six months of 2022, the freight transport increased by eight per cent as compared to the corresponding period in 2021. Further, rail freight companies have applied to transport 30 per cent more freight in 2023 compared to 2022. However, it is not possible at this time to single out the effect of the support scheme on national emissions. Increased rail capacity, freight transport demand and restrictive measures for road transport are key drivers for a modal shift from road to rail. The support scheme is thus one of multiple measures that works simultaneously to increase transport freight by rail. Additionally, the Covid 19 pandemic had an impact for both global and national demand for goods, which increased national freight transport by rail in the second half of 2020. This sudden increase occurred simultaneously as the first payment from the support scheme took place.
To determine the effect of the support scheme on national emissions, more data over time is needed to isolate different explanatory variables. Nevertheless, the support scheme did improve market conditions for rail freight companies, and thus contributed to the growth observed in the last years.
Box 4.9 Electrification of railways
Roughly 80 per cent of all trains driven each year in Norway runs by electricity, while the rest is driven by fossil fuels. In 2019, the total amount of greenhouse gas emissions from rail transport was approximately 50 000 tonnes CO2-equivalents Electrification of the rail network is an important measure to reduce emissions, and parts of the rail network (Trondheim–Stjørdal, Hell–Riksgrensen and Stavne–Leangen) are currently being electrified. The Norwegian Railway Directorate will present a concept study in 2023 with recommended zero or low-emission solutions for the rest of the non-electrified lines.
4.3.7.9 Enova
Enova provides support for both late-phase technology development and early market introduction of climate- and energy solutions in the transport sector, both at land at sea. In 2021 Enova granted a total of 2.1 billion NOK to 4 949 projects in the transport sector. Among the supported projects are emission free light duty vehicles, heavy duty vehicles and construction machines. They have also supported charging infrastructure on land and onshore power supply for ships. At sea they support installation of batteries in ships, as well as more innovative projects like hydrogen powered fishing boats, etc. For further description and estimated effect of this mitigation action in chapter 4.3.3.2.
4.3.7.10 International transport
Norway has for a number of years worked actively through the International Maritime Organisation (IMO) to pursue limitation of greenhouse gas emissions from international shipping. Since the last National Communication submitted by Norway, the IMO has adopted energy efficiency requirements which entered into force on 1 January 2013. This framework has been expanded further in 2014, and further tightening and expansion of the energy efficiency requirements is adopted with entry into force in April 2022 (EEDI strengthening) and November 2022 (EEXI and CII). Further, proposals for mid- and long-term measures for reduction of GHG emissions from shipping are under consideration. The IMO data collection system which will collect fuel consumption data entered into force on 1 March 2018. At present Norway is contributing actively to strengthen the ambition for the Revised IMO strategy on the reduction of Greenhouse Gases from international shipping to zero by 2050. The revised IMO GHG Strategy is planned to be adopted at MEPC 80 in July 2023. Further the IMO is also addressing short-lived climate forcers through the ongoing work on Black Carbon emissions from shipping. The existing regulation on emissions on volatile organic compounds also addresses these emissions.

In 2020 the IMO updated the estimate of the global greenhouse gas emissions from international shipping. Further, new studies on emission reduction pathways will be executed in 2022/2023.
At the national level, Norway implements all relevant provisions of the IMO to limit or reduce emissions. In addition, Norway has promoted the introduction of battery-electric ferries through public procurement as a climate measure. Development of more energy-efficient technologies for shipping is also enhanced through research and development programmes under the Research Council of Norway, Innovation Norway and Enova. Pilot projects on low- and zero-emission shipping are being developed through the Green Shipping Programme which is a private-public partnership.
ICAO has set a goal of achieving carbon neutral growth from 2020 for international aviation. The general assembly reiterated two global aspirational goals for the international aviation sector of 2 per cent annual fuel efficiency improvement through 2050 and carbon neutral growth from 2020 onwards, as established at the 37th Assembly in 2010. The largest emission challenge in air traffic is related to large aircraft and long-distance flights and Norway therefore welcomes international regulations on international aviation.
Within the ICAO, Norway has as an observer in the Civil Aviation Environment Programme (CAEP). Further, as a member of the European Civil Aviation Conference (ECAC), Norway participates actively with a view to limit greenhouse gas emissions from international aviation. To achieve the global aspirational goals and to promote sustainable growth of international aviation, ICAO is pursuing a basket of measures including aircraft technology improvements, operational improvements, sustainable aviation fuels, and market-based measures (CORSIA). Norway supported the development of the global market-based measure (CORSIA), and has since 2021 taken part of its voluntary phase.
During ICAO’s 40th Assembly in 2019, it was decided to initiate a process to investigate the feasibility of new long-term climate goals for international aviation (Long Term Aspirational Goals, or “LTAGs”). The matter was dealt with at the 41st General Assembly of ICAO in October 2022. Norway has expressed support, as a member of ECAC, for the long-term goals to be in accordance with the Paris Agreement and net zero carbon emission by 2050. This has further been underlined through support for the “International Aviation Climate Ambition Coalition”, which was formed during COP26 in Glasgow in 2021, and the “Declaration on Future Sustainability and Decarbonisation of Aviation” presented during the French presidency of the EU’s European aviation summit in 2022.
Norway participates in the EU Emission Trading Scheme (EU ETS) for aviation, through the implementation of EU Directive 2008/101/EC in the EEA Agreement.
Table 4.16 Summary policies and measures, transport
Name of policy or measure a | Sector(s) affected b | GHG(s) affected | Objective and/or activity affected | Type of instrument c | Status of implementation d | Brief description e | Start year of implementation | Implementing entity or entities | Estimate of mitigation impact (not cumulative, in kt CO2 equivalents) | |||
|---|---|---|---|---|---|---|---|---|---|---|---|---|
2020 | 2025 f | 2030 f | 2035 f | |||||||||
Taxes and regulations on emissions from road transportation * g | Transport | CO2 | Reduce emissions from road transport | See below | Implemented | Several policies affecting road traffic, see below | See below | Ministry of Finance | 4 000 | 5 400 | 6 800 | 8 300 |
The Norwegian tax scheme on emissions of GHGs under the ESR (road transport only) * | Transport | CO2 | Cost-effective reductions of emissions | Fiscal | Implemented | CO2 taxes on mineral oil, petrol and emissions from petroleum extraction on the continental shelf were introduced in 1991 to cost-efficiently limit greenhouse gas emissions | 1991 | Ministry of Finance | IE | IE | IE | IE |
Road usage tax * | Transport | CO2 | Besides creating revenue, the intention is to price the external costs of road transport, except emissions of CO2 | Fiscal | Implemented | The road usage tax applies to petrol, mineral oil, biodiesel, bioethanol, natural gas and LPG | 1931 | Ministry of Finance | IE | IE | IE | IE |
One-off registration tax based on CO2-emissions and with special rules for plug-in hybrid cars * | Transport | CO2 | Reduce emissions from new cars | Economic | Implemented | Registration tax is based on CO2 emissions, NOx emissions and weight. CO2 emissions included in 2007 – increasingly emphasised. Additional weight rebates for plug-in hybrids in the registration tax. | 2007 | Ministry of Finance | IE | IE | IE | IE |
Tax advantages for electric vehicles * | Transport | CO2 | Reduce emissions from new cars | Economic, regulatory | Implemented | Excemption from registration tax and VAT for EVs. Reduced rate in annual motor vehicle tax. Other user advantages as free or low charges for toll roads, ferries and public parking. | 2001 | Ministry of Finance | IE | IE | IE | IE |
Biofuel requirement in road transport * | Transport | CO2 | Reduce emissions from road transport | Regulatory | Implemented | From January 1st 2021, the requirement is that 24.5 % of total fuel sold to road traffic is biofuel, with a sub requirement that 9 % should be advanced biofuel. Advanced biofuel is double counted within the overall requirement. | 2009 | Ministry of Climate and Environment | IE | IE | IE | IE |
CO2 tax on domestic aviation (ETS) * | Transport | CO2 | Cost-effective reductions of emissions | Fiscal | Implemented | Mineral oil for domestic aviation under the ETS is also subject to the CO2-tax on mineral products. | 1999 | Ministry of Finance | 10 | 10 | 10 | 10 |
Blending mandate for advanced jet biofuel in aviation * | Transport | CO2 | Reduced emissions from aviation | Regulatory | Implemented | From January 1st 2020, 0.5 % of total fuel sales in aviation is required to be advanced biofuel. | 2020 | Ministry of Climate and Environment | 6 | 6 | 6 | 6 |
Pilot projects for fossil free construction sites * | Transport | CO2 | Reduces emissions from construction machinery | Economic | Implemented | Support scheme for increased use of zero emission equipment on construction sites for public transport infrastructure | 2022 | Ministry of transport and communication | NE | NE | NE | NE |
Urban growth agreements and reward schemes for public transport * | Transport | CO2 | Modal shift to public transport or non-motorized transport, demand management/reduction | Economic; Voluntary/negotiated agreements | Implemented | The 9 largest urban areas either have urban environment agreements, urban growth agreements or a reward scheme for public transport, which all share the same common goal of zero growth in passenger traffic by car. | 2012 | Ministry of transport and communication | NE | NE | 60 | 60 |
Maximum CO2-emissions from the coastal service Bergen-Kirkenes * | Transport | CO2 | Reduce emissions | Regulatory | Implemented | Requirements for maximum CO2-emissions from the coastal route Bergen to Kirkenes. | 2016 | Ministry of transport and communication | NE | NE | 60 | 60 |
Requirements for zero and low-emission technology in tenders for public ferries * | Transport | CO2 | Reduce emissions from ferries | Economic, regulatory | Implemented, planned | Low- and zero emission criteria for ferries from 2023 where suitable | 2015 | Ministry of transport and communication | 100 | 200 | 200 | 200 |
Aid Scheme for Short Sea Shipping * | Transport | CO2 | Reduce emission from freight transport | Economic | Implemented, Planned | Shipowners may receive financial aid for operational costs or for investments costs over a three-year period in order to establish a sustainable maritime transport route. | 2017 | Ministry of Trade, Industry and Fisheries | 23 | 24 | 24 | 24 |
Green Shipping Programme * | Transport | CO2 | Reduce emission from freight transport | Economic | Implemented, Planned | The Green Shipping Programme (GSP) is a public-private partnership working to reduce barriers for the introduction of low and zero emission solutions within the maritime sector. The program has initiated 28 green pilot projects since its beginning in 2015, and completed 8 of them. Since 2019, the programme has had a special focus on fleet renewal within the short shipping segments. | 2019 | Ministry of Trade, Industry and Fisheries | NA | 130 | 360 | 600 |
Recycling scheme for Norwegian short sea vessels and offshore vessels * | Transport | CO2 | Reduce emission from freight transport | Economic | Implemented | Established with the aim of fomenting fleet renewal in a segment with little ability or incentives for green fleet renewal. | 2020 | Ministry of Trade, Industry and Fisheries | NE | NE | NE | NE |
High speed passenger ferries scheme * | Transport | CO2 | Reduce emission from freight transport | Economic | Implemented | Financial support scheme dedicated to projects in county councils aiming at reducing emissions for high speed passenger vessels. | 2019 | Ministry of Climate and Environment | NA | 12 | 12 | 12 |
Maritime Zero 2050 | Transport | CO2 | Reduce emission from freight transport | Economic | Implemented | Directed towards development of zero emission solutions for large ships sailing long distances. | 2022 | Ministry of Trade, Industry and Fisheries | NA | NE | NE | NE |
Investments in railways * | Transport | CO2 | Reduce emission from transport | Economic | Implemented, planned | 1) Investment in railway infrastructure in the larger capital area, the so called InterCity-project. 2) Investment in specific infrastructure measures for freight transport. | 2011 | Ministry of transport and communication | NE | 40 | 41 | 52 |
Grant funding to transport freight by rail * | Transport | CO2 | Reduce emission from freight transport | Economic | Implemented | To improve conditions for rail freight operators, and to facilitate a shift from road to rail. | 2019 | Ministry of transport and communication | NE | NE | NE | NE |
For note and footnotes, see under table 4.2
g Custom footnote. The effects of the Norwegian tax scheme on emissions of GHGs under the ESR (road transport only), road usage tax, one-off registration tax based on CO2 emissions and with special rules for plug-in hybrid cars, tax advantages for electric vehicles and biofuel requirement in road transport are included in the effects of taxes and regulations on emissions from road transportation.
4.3.8 Industry
4.3.8.1 Introduction
This sector covers primarily emissions from the manufacturing industry, including emissions from industrial processes. A number of policies and measures have been implemented over the years. From 2013, emissions of CO2 PFCs and N2O from processes in the manufacturing industries are to a large extent covered by the EU Emissions Trading Scheme (EU ETS). Prior to the EU ETS, a number of agreements concerning the reduction of greenhouse gas emissions have been concluded between the industry and the Norwegian Government. HFCs are regulated through a tax and reimbursement scheme together with F-gas regulation and the Kigali Amendment.
4.3.8.2 Arrangement to reduce emissions in the processing industry, 2004
The Norwegian industry has for many years reported their emissions to the Norwegian Environment Agency and these are reflected in Norway’s GHG inventory. The emissions in 2007 from the industries covered by the arrangement were reduced by 1.11 million tonnes of CO2 equivalents. The reduction in N2O emissions from the production of nitric acid was enough to fulfil the arrangement, but the effect is reported as included elsewhere (IE) in F table 3 under the PaM N2O reduction, production of nitric acid.
Estimated effect on national emissions
The Norwegian industry has for many years reported their emissions to the Norwegian Environment Agency and these are reflected in Norway’s GHG inventory. The emissions in 2007 from the industries covered by the arrangement were reduced by 1.11 million tonnes of CO2 equivalents. The reduction in N2O emissions from the production of nitric acid was enough to fulfil the arrangement. The effect is reported as included elsewhere (IE) since the effect is included under the PaM N2O reduction, production of nitric acid.
4.3.8.3 Arrangement to reduce emissions in the processing industry, 2009
In September 2009, the Ministry of Climate and Environment entered into an agreement with the processing industry that was not covered by the EU ETS. This agreement set a limit for total emissions of 6.2 million tonnes CO2-equivalents per year for the years 2008–2012. The limit equalled a reduction of 39 per cent compared with the emissions in 1990
Estimated effect on national emissions
In 2007, the emissions from the processing industry were 6.4 million tonnes CO2-equivalents. The target of 6.2 million tonnes CO2 equivalents was met, thus resulting in a reduction in emissions of 0.2 million tonnes of CO2 equivalents from when the agreement was made. This reduction is used as an estimate for the effect of the agreement for 2020, 2025, 2030 and 2035. From 2013 onwards, nearly all the emissions from the processing industry are included in the emissions trading scheme.
4.3.8.4 CO2 compensation scheme
In 2013, Norway established a CO2 compensation scheme for the manufacturing industry. The purpose of the scheme is to prevent carbon leakage resulting from increased electricity prices due to the EU Emissions Trading System (EU ETS), and affected companies can apply for such compensation to the Norwegian Environmental Agency. Norway is part of the integrated Nordic electricity market and there are electricity cables linking our system to both Germany and the Netherlands. Hence, increased electricity prices in Europe, due to the EU ETS, result in increased electricity prices in Norway as well. The result is a competitive disadvantage for the electricity intensive manufacturing industry in Norway, compared with businesses outside of Europe. The CO2 compensation scheme is intended to partly counteract this disadvantage.
The compensation scheme is based on the EFTA Surveillance Authority’s (ESA) state aid guidelines. The scheme is governed by the Norwegian Ministry of Climate and Environment, and administered by the Norwegian Environment Agency. The scheme applies from 1 July 2013 to 31 December 2020. The scheme includes all 15 sectors listed in the EU Guidelines, among others aluminium, ferro alloys, chemicals and pulp and paper.
Estimated effect on national emissions
Since the purpose of the scheme is to prevent carbon leakage, it is not relevant nor possible to estimate the effect on national emissions. The effect is therefore reported as not applicable (NA).
4.3.8.5 Use of bio carbon in the production of cement and ferroalloys
In the production of cement and ferroalloys, the sectors have replaced some of the coal consumption with bio carbon.
Estimated effect on national emissions
The estimated effects on the CO2 emissions from the production of cement and ferroalloys are based on the plants’ reported use of biocarbon to the Norwegian Environment Agency. The consumption of biocarbon fluctuates between years, but the trend is increased use. The production in these sectors is in the national emission projection anticipated to be at approximately the same level as today. The CO2 effect of the use of biocarbon in 2025, 2030 and 2035 is set equal to the estimated emissions from biocarbon in 2020 (500 kt CO2).
4.3.8.6 N2O reduction, production of nitric acid
In 2020, the N2O emissions from the production of nitric acid equalled about 0.1 million tonnes CO2 equivalents. The N2O emissions from the production of nitric acid decreased by 95 per cent from 1990 to 2020. This is partly explained by the fact that one of the production lines was restructured in 1991, but mainly because more and more of the production from 2006 and onwards has been equipped with a new technology – N2O decomposition by extension of the reactor chamber. As a result of the new technology, the implied emission factor (IEF) for nitric acid production decreased from 5.0 kg N2O per tonne nitric acid in 1990 to 0.17 kg N2O tonne of nitric acid in 2020.
Estimated effect on national emissions
The estimated effects on national emissions have been estimated by assuming a “business-as-usual” scenario from 1990 with no change in emission intensity since 1990, but with actual production levels. The effect in 2020 is estimated based on production levels and emissions from the emission inventory, while 2030 estimates are consistent with the GHG projections. The effects for 2020 is estimated to 2.8 million tonnes CO2 equivalents, while the projected effect is estimated to 3.0 million tonnes CO2 equivalents.
The reduction in N2O emissions from the production of nitric acid was enough to fulfil the 2004 arrangement between the Ministry of Climate and Environment and the processing industry, (see section 4.2.8.2). The production of nitric acid was opted-in to the EU ETS in 2008 and this has provided incentives for further emissions reductions.
4.3.8.7 Agreement with the aluminium industry
In 1997, the major aluminium producers signed an agreement with the Ministry of Climate and Environment to reduce emissions of greenhouse gases (CO2 and PFCs) per tonne of aluminium produced by 50 per cent in 2000 and 55 per cent in 2005, compared with 1990 levels. The agreement was followed by a new agreement with the industry for the years 2005–2007. In 2005 the CO2 equivalent emissions of PFCs per tonne of aluminium produced were 85 per cent lower than in 1990 and 84 per cent lower in 2007. The emissions covered by this agreement were included in the 2009 agreement with the processing industry, see section 4.2.8.3, and from 2013 they are covered by the EU emission trading scheme. The emission intensity has continued to decrease and the PFC emissions were 97 per cent lower in 2018 than in 1990.
Estimated effect on national emissions
The reduced emission intensity is a result of the sustained work and the strong attention on reduction of the anode effect frequency and time in all these pot lines and the shift from the Soederberg production technology with high emission intensity to prebaked technology with considerably lower emission intensity. The emphasis on reducing anode effect frequency started to produce results from 1992 for both technologies.
The effects assume a “business-as-usual” scenario from 1990, with no change in emission intensity since 1990 but with actual production level for 2020. For 2025, 2030 and 2035 the production levels and emissions are consistent with the latest GHG projections. The effect for 2020 is estimated to 5.8 million tonnes CO2 equivalents and to about 6.2–6.3 million tonnes CO2 equivalents in 2025, 2030 and 2035.
4.3.8.8 Agreement on SF6 reductions from use and production of GIS
In 2002, a voluntary agreement between the Ministry of Climate and Environment and the business organisations representing most users of gas-insulated switchgear (GIS) and a producer of switchgear was established. According to this agreement, emissions were to be reduced by 13 per cent by 2005 and 30 per cent by 2010 relative to base year 2000. By the end of the agreement period in 2010, emissions were 45 per cent lower than the base year emissions in 2000. Although the formal agreement was terminated in 2010 the intentions and practical implications of the agreement are still in place. Although the installed amount of gas in GIS has increased considerably since 2000, the emissions from GIS in use have decreased.
Estimated effect on national emissions
Emission estimates from the Norwegian inventory have been used to calculate the emission reductions resulting from the agreement. Ex post evaluation for 2020 gives an estimated effect of 56 000 tonnes CO2 equivalents. For 2025, 2030 and 2035, projections are compared to the emission estimates for the base year 2000. The effects are estimated to 69 000, 67 000 and 25 000 tonnes CO2 equivalents in 2025, 2030 and 2035 respectively.
4.3.8.9 F-gas regulations and the Kigali Amendment to the Montreal Protocol
Norway has implemented the EU Regulations on certain fluorinated greenhouse gases (No. 842/2006 in 2010, revised by No. 517/2014 in 2018. The regulation sets up measures to prevent emissions of F-gases from existing equipment by requiring checks, proper servicing and recovery of the gases at the end of the equipment’s life. It also bans the use of F-gases in many new types of equipment and products where less harmful alternatives are widely available.
Norway is exempted from the EU HFC phase-down scheme of the EU f-gas regulation. This is mainly justified by the implementation of the Kigali Amendment to the Montreal Protocol. Norway has ratified the Kigali Amendment, and the phase-down scheme for HFCs entered into force in national legislation by 1 January 2019. In the national legislation, Norway has implemented a stricter phase-down scheme than its obligations under the Montreal Protocol.
Norway has implemented the EU Directive 2006/40/EC which gradually bans the use of HFCs with high GWP in air-condition systems in passenger cars and light commercial vehicles.
Estimated effect on national emissions
The Norwegian Environment Agency provided an updated assessment on the effect on HFC emissions of planned measures in 2016, based on the work of a national expert. For 2020, the Norwegian Environment Agency has estimated a reduction in HFC emissions of about 150 thousand tonnes CO2-equivalents. Comparing projected emissions with emission levels in 2015 gives an estimated effect of approximately 0.66 million tonnes CO2-equivalents in 2035. The effect in 2035 includes an effect of 27 thousand tonnes CO2-equivalents from restrictions on SF6 in certain products, such as windows. The effect is estimated as likely emissions without the measure.
Table 4.17 Summary policies and measures, industry
Name of policy or measure a | Sector(s) affected b | GHG(s) affected | Objective and/or activity affected | Type of instrument c | Status of implementation d | Brief description e | Start year of implementation | Implementing entity or entities | Estimate of mitigation impact (not cumulative, in kt CO2 equivalents) | |||
|---|---|---|---|---|---|---|---|---|---|---|---|---|
2020 | 2025 f | 2030 f | 2035 f | |||||||||
Arrangement to reduce emissions in the processing industry, 2004 * g | Industrial processes | CO2, HFC, CH4, N2O, PFC, SF6 | Reduce emissions | Voluntary/negotiated agreements | Implemented | The Ministry of Climate and Environment entered into an arrangement with the processing industry. | 2004 | Ministry of Climate and Environment | IE | IE | IE | IE |
Arrangement to reduce emissions in the processing industry, 2009 * | Industrial processes | CO2, HFC, CH4, N2O, PFC, SF6 | Reduce emissions | Voluntary/negotiated agreements | Implemented | The Ministry of Climate and Environment entered into an agreement with the processing industry that was not covered by the EU ETS. | 2009 | Ministry of Climate and Environment | 200 | 200 | 200 | 200 |
CO2 compensation scheme * | Industrial processes | NA | Prevent carbon leakage | Voluntary | Implemented | The purpose of this compensation scheme is to prevent carbon leakage from Europe resulting from increased electricity prices due to the EU Emissions Trading System (EU ETS). | 2013 | Ministry of Climate and Environment | NA | NA | NA | NA |
Use of bio carbon in the production of cement and ferroalloys * | Industrial processes | CO2 | Reduce emissions | Voluntary/negotiated agreements | Implemented | The producers have voluntarily replaced some of the coal consumption with bio carbon | 1990s (cement), 2000 (ferroalloys) | 500 | 500 | 500 | 500 | |
N2O reduction, production and nitric acid * | Industrial processes | N2O | Reduce emissions | Voluntary/negotiated agreements | Implemented | The producers have voluntarily restructured production | 1992 | Ministry of Climate and Environment | 2 833 | 2 985 | 2 985 | 2 985 |
Agreement with the aluminium industry * | Industrial processes | PFC | Reduce emissions | Voluntary/negotiated agreements | Implemented | The major aluminium producers signed an agreement with the Ministry of Climate and Environment to reduce emissions. | 1997 | Ministry of Climate and Environment | 5 830 | 6 260 | 6 300 | 6 240 |
Agreement on SF6 reduction from use and production of GIS * | Industrial processes | SF6 | Reduce emissions | Voluntary/negotiated agreements | Implemented | Agreement between the Ministry of Climate and Environment and the business organisations representing most users of gas-insulated switchgear (GIS) and the single producer. | 2002 | Ministry of Climate and Environment | 56 | 69 | 67 | 65 |
F-gas regulation and the Kigali Amendment to the Montreal Protocol * | Industrial processes | HFC, SF6 | Reduce emissions | Regulatory | Implemented | Implementation of the revised EU regulation No. 517/2014 and the Kigali Amendment to the Montreal Protocol. | 2019 | Norwegian Environmental Agency | 154 | 377 | 600 | 662 |
For note and footnotes, see under table 4.2.
g Custom footnote. The effect is included under N2O reduction, production of nitric acid.
4.3.9 Agriculture
Norwegian agriculture is covered by overall Norwegian climate targets and policies as specified in our NDC and our agreements with the EU. The 2022 agricultural agreement (Prop. 120 S (2021–2022)), as adopted per the subsequent recommendation to the parliament June 2022 (Innst. 462 S (2021–2022)), reaffirm that Climate targets are an integral part of agricultural policies. These policies also build on the 2021 White Paper on climate policies (Meld. St. 13 (2020–2021)). The Norwegian Parliament stated that the most important role for agriculture in the context of climate change is to reduce emissions per unit produced, increase the uptake of CO2 and adapt the production to a changing climate.
Current policies and practices to control GHG emissions in Norwegian agriculture include a combination of regulatory, economic and informatorily measures. CO2 from the use of fossil fuel in activities related to agriculture meets CO2-taxation similar to other sectors. The government has proposed a mandatory biofuels turnover for non-road machinery from 2023 and this will also include agricultural machinery, whereas the general ban on fossil fuels for heating buildings is imposed for agriculture from 2025. Emissions related to transport and energy are accounted for in other sectors. Direct emissions from agriculture are covered neither by the emissions trading system, nor subject to GHG taxation, rather they are covered by other measures as specified below.
Previous reporting of the emission inventory and reports to the UNFCCC have identified key emission sources from Norwegian agriculture. These include methane from livestock and manure, nitrous oxide from manure and fertilized soils, and losses of carbon- and nitrogen-compounds from soils, particularly organic soils. While abatement of such emissions is considered important, it is difficult to decouple the volumes of emissions from the volumes of production.
Emissions from livestock have been slightly reduced over the last decades. This results from successes with animal breeding, welfare and feeding which have enabled increases in output per animal.
Key measures to reduce N2O include improving manure management and fertilizer use so that less N-input is needed per unit of product. Such improvements can have various co-benefits, including reduction of run-off to water as well as ammonia emissions. The sector is making efforts to improve the use of fertilizers through improved storage, spreading, timing and dosage of fertilizer – according to crops’ needs. Precision agriculture is under development with increasing use of GPS technology in land management. A combination of regulatory and economic instruments support such improved practices and emission reductions.
Across emission sources, regulations have mostly been constant over recent years, for instance for livestock management, manure management and land management. On the other hand, agri-environmental financial instruments in agriculture have been expanded. Restrictions on cultivation of peatland and on the use of fossil fuels for heating purposes indicate willingness to use a combined set of measures.
Emission figures for agriculture have high uncertainty as emissions also depends on precipitation patterns, temperature or soil properties. Various emission sources have been identified as “key category sources” that have priority for further methodology development. Collaboration between agriculture and climate experts has improved the technical understanding, and enables development of measures and instruments to further reduce emissions.
4.3.9.1 Policy development in co-operation with farmers and stakeholders
Policies and measures for controlling GHG fluxes in Norwegian agriculture and food systems are developed in close cooperation with stakeholders. There are agricultural negotiations between the government and farmer’s unions leading to an annual “agricultural agreement” that specifies support schemes and requirements for agriculture. In the white paper on agriculture from 2016 it was concluded that climate change should be given more emphasis in the agricultural negotiations with the farmers’ unions.
Based on the same co-operative approach, the Government and farmers’ organisations negotiated a climate agreement for agriculture in June 2019. The letter of intent sets out a climate target for the agricultural sector, which is to reduce emissions and enhance removals by a total of 5 million tonnes CO2-equivalents over the period 2021–2030, compared to a business-as-usual emission level of approximately 4.5 mill tonnes CO2-equivalents annually. According to the letter of intent, responsibility for reducing emissions is shared between the agricultural sector and the Government. The agricultural sector will be in charge of on-farm improvements, while authorities will be responsible for efforts to promote changes in consumption patterns that may indirectly reduce greenhouse gas emissions from the agricultural sector. These efforts include initiatives to achieve the goal of reducing food waste by 50 per cent by 2030 and to persuade people to follow the dietary recommendations from the Directorate of Health. In 2020, farmers’ organisation issued the “farmer’s climate action plan”. In this plan, farmers task themselves to take the lion’s share of abatement through on-farm improvements. The plan lays out action in eight areas, including fuel switch and improvement in livestock, manure and soil management. Alongside; authorities will take due steps in areas such as reduced food losses and waste and persuade people to follow the dietary recommendations from the Directorate of Health. A joint public and private agreement to reduce food waste was completed and signed in June 2017. The goal is to half the food waste within 2030.
Measures to control emissions on-farm include transfer of know-how, technology and financial resources to support best practices. Research, extension services, breeding programs and veterinary services are key to succeed in crop and livestock management. In Norway, farmer co-operatives have a strong position in various supply chains, and are key to secure farmers with adequate support, also to control climate change. Numerous organizations and companies in Norwegian agriculture have joined forces in a project called “climate-smart agriculture” to succeed in these fields.
Various agri-environmental measures to control emissions are listed below. These include investment schemes that are mostly operated on the local level, and support for improved practices that are mostly operated on the regional level. While these measures are considered helpful, their effect on emissions can only be quantified in retrospect.
4.3.9.2 Regional agri-environmental programmes
The regional agri-environmental programmes are support schemes directed at environmental challenges in different parts of the country. Each county (region) uses schemes/measures taken from a national “menu”, according to the priorities of the regional environmental programme. These involve area-based payments for farming practices to achieve various agri-environmental targets, such as reducing run-off and emissions.
In the 2022 agricultural agreement, funds for Regional Agri-environmental Programmes were upscaled. The lion’s share of the additional funds were earmarked to reduce erosion and run-off, see PaM 4.3.10.2, while the upscale will also benefit climate goals. Other priority areas include support to environmentally friendly spreading of manure, which is primarily directed to abate ammonia, but will also have co-benefits for GHG-emissions. From 2022, delivery of on-farm climate extension services has also been eligible for support over regional agri-environmental programmes. Such extension is expected to increase the adoption of climate measures on farms and in this way indirectly lead to reduced emissions. From 2023, measures to advance soil health and soil carbon sequestration are established as a separate focus area in regional agri-environmental programmes.
Estimated effects of measures primarily targeted at abatement of emission to air
Environmentally friendly spreading of manure corresponds to category 1 techniques as identified in the guidance document for the LRTAP-convention (ECE/EB.AIR/120). Such techniques save ammonia emissions and indirectly also N2O emissions from deposition of ammonia. Such savings may also reduce the need for mineral fertilizers and resulting N2O emissions from this source, however, the latter effect only arise if farmers reduce the dosage of fertilizer according to improved input efficiency.
In Norwegian reports to the LRTAP-convention, we note that uptake of category 1 techniques has risen over recent years and in 2020 the area with environmentally friendly spreading of manure reached 9 per cent of the agricultural area. The regional agri-environment programme was introduced in 2013 and to estimate the effect of the measure, activity data from 2013 was compared to activity data from 2020. The use of environmentally friendly spreading of manure reduced the emissions with about 3 900 tonnes of CO2-equivalents in 2020. Spreading of manure in the growing season instead of in autumn reduced emissions by a further 1 700 tonnes CO2-equivalents.
Estimated effects of measures primarily targeted at abatement of erosion and run-off
Various policies under regional agri-environmental programmes address erosion and run-off from arable cropping systems, with effects also for conservation of nutrients and soils, and thus for abatement of GHG emissions. In the abovementioned scale up of funds for Regional Agri-environmental Programmes in 2022, particular priority has been given to support such abatement. Furthermore, from 2023, farms in specific regions draining to the Oslofjord estuary meet requirements that zones adjacent to water courses shall have plant cover over winter, and 60 per cent of the cropland of individual farms shall be equipped with plant cover over winter. Similar policy development in other erosion-prone regions are due in coming years.
Practices to comply with support schemes and/or requirements targeted at arable cropping systems include use of buffer strips, no-autumn tillage, and catch-/cover-crops. There is general agreement that such practices support retention of soil organic matter and nutrients, and in this way sequester carbon and reduce N2O emissions, while quantifying such effects is more complex. First, we can estimate that uptake of soil conserving practices in arable cropping increase substantially. Uptake currently amount to 1/3 of overall land allocated to arable crops, corresponding to around 100.000 ha of land. With policies and measures under implementation, we project that in the near future, uptake will increase to 1/2 of arable cropland (around 150.000 ha of land).
The effect of these measures is currently not included in the official inventory. The effect of no-autumn tillage has not been estimated due to lack of research. The carbon sequestration of catch crops can however be estimated using factors from the literature9. Assuming a carbon sequestration of 880 kg CO2 pr ha pr year, an increase in direct N2O emissions of 16 kg CO2 equivalents pr ha pr year, a reduction in indirect N2O from leaching of 70 kg CO2-equivalents pr ha pr year, and an increase in CO2 from field operations of 4 kg pr ha pr year, the net mitigation effect from use of cover crops on 8 000 ha correspond to 7 500 tonnes of CO2-equivalents for 2020. If, as result of policies under implementation, uptake of catch-crops will double, we can project abatement of another 7 500 tonnes of CO2-equivalents for 2030.
4.3.9.3 Requirements and support for livestock on pasture
Keeping livestock on pasture may help abate emissions from manure management compared to keeping animal in confinement. Naturally, most livestock in Norway must be kept indoors for part of the year, while there are requirements that cattle, sheep and goats should be free-range for minimum periods in summer, and additional support is paid for those who are kept outdoors longer. Through such practices, emissions from storage and spreading of manure are avoided and replaced by lower emissions from dung and urine deposited on pasture.
Estimated effect on national emissions
According to default emission factors in 2006 IPCC guidelines used in current emission calculations, deposition on pasture has modest effect on overall emissions compared to management of manure from confinements. The mitigation effect of this measure has therefore not been estimated. According to the 2019 refinement of IPCC guidelines, however, deposition on pasture reduces the rate of emissions. Consequently, the ratio of pasture use has little effect for the current emission data, however, this ratio will influence what emissions level and mitigation effect we report retrospectively in the future.
4.3.9.4 Support scheme for Special Environmental Measures in Agriculture
The support scheme for Special Environmental Measures in Agriculture support investments towards environmentally friendly practices. From 2017 this scheme has been expanded to support better storage of manure, to control emissions of CH4 and N2O.
Estimated effect on national emissions
The effect on emissions from better storage of manure depends on several characteristics and is therefore hard to estimate. Investment support is given only to storage constructions that are better than requirements established in overall regulations, e.g. capacity to store manures for longer periods in order to optimise the timing of application, and/or instalment of cover on storage silos in order to prevent excessive emissions.
4.3.9.5 Drainage of agricultural soils
The main purpose of the scheme is to increase the quality of cultivated land by financial support for drainage of poorly drained soil, in order to increase productivity and reduce risk for erosion and water pollution. As a side-effect, better drainage may also reduce GHG emissions.
Estimated effect on national emissions
There is a tendency of higher emissions of N2O from soils with high humidity. Drainage may therefore reduce such emissions. Additionally, yields on properly drained fields are higher, which lower the emissions pr kg of product. However, the effect also depends on e.g. fertilizer, time of fertilization, humidity of the soil, structure of the soil and pH values. There are currently few studies available that can help quantifying the effect on emissions, and more knowledge is therefore needed.
4.3.9.6 Project Climate Smart Agriculture
A project called Climate Smart Agriculture was established in 2017. The aim of the project is threefold; Making a system for data collection and documentation of practical measures, develop a system for on-farm climate decision support, and information and sharing of knowledge. Under the project, training has been provided for extension services in support of climate-smart agriculture, and a “climate calculator” has been developed for on-farm assessment and decision-making support in these areas.
Estimated effect on national emissions
The effect on emissions has not been estimated since the project should be considered as a support system and enabling condition for other, more specific improvements.
4.3.9.7 Climate and environment programme
The aim of the Climate and environment programme is to contribute to climate and environmental goals within the agricultural policy through research and information measures. The programme is directed towards practical and agronomical knowledge on climate and environmental challenges, that can be quickly disseminated to on-farm implementation. Examples of projects that have been supported by this programme are Climate smart agriculture, Quality of roughage and Effects of tillage on run-off of nitrogen and phosphorus.
Estimated effect on national emissions
The project is related to development and dissemination of knowledge, while actual effect on emissions can only happen through on-farm implementation. The effect on emissions has therefore not been estimated.
4.3.9.8 Delivery of manure for production of biogas
There is a support scheme for delivery of manure to biogas production plants, to compensate for additional costs arising from such delivery and increase the uptake of such treatment.
Estimated effect on national emissions
The effect of the support scheme is estimated to about 900 t CO2-equivalents pr year. It is difficult to estimate the effect from the delivery support scheme isolated from other incentives. The effect on emissions should e.g. be seen in relation to grants for biogas projects and tax incentives for the use of biogas as compared to fossil fuels.
4.3.9.9 Restrictions on cultivation of peatlands
Land conversion from peatland to cropland has been extensive historically, and approximately 60 000 ha of croplands (7 per cent of the total cropland area) in Norway are identified as drained organic soils. These soils are a significant source of N2O and CO2, as reported under the agricultural sector and LULUCF, respectively. As described under chapter 4.2.10.5, restrictions for the cultivation of peatland are under establishment. Such restrictions will affect the emissions of N2O alongside the effects for CO2 as presented below.
Table 4.18 Summary policies and measures, agriculture.
Name of policy or measure a | Sector(s) affected b | GHG(s) affected | Objective and/or activity affected | Type of instrument c | Status of implementation d | Brief description e | Start year of implementation | Implementing entity or entities | Estimate of mitigation impact (not cumulative, in kt CO2 equivalents) | |||
|---|---|---|---|---|---|---|---|---|---|---|---|---|
2020 | 2025 f | 2030 f | 2035 f | |||||||||
Regional agri-environmental programme * | Agriculture, LULUCF | CO2, CH4, N2O | Reduce emissions and leaching from agriculture | Economic, regulatory | Implemented | Several support schemes. Differs between regions. No-autumn tillage implemented in 2003 will be strengthened in 2023. Environmentally friendly spreading of manure implemented in 2012. | 2003, 2012 | Ministry of Agriculture and Food | 13 | 13 | 13 | 13 |
Requirements and support for livestock on pasture * | Agriculture, LULUCF | CH4, N2O | Increase the time on pasture to improve resource use and animal welfare | Economic, regulatory | Implemented | Various requirements and support schemes differentiated between livestock category and pasture category. | 1990 | Ministry of Agriculture and Food | NE | NE | NE | NE |
Support scheme for Special Environmental Measures in Agriculture * | Agriculture | CH4, N2O | Improved animal waste management systems | Economic | Implemented | Several support schemes, of which storage of manure is mostly related to climate mitigation | 2017 | Ministry of Agriculture and Food | NE | NE | NE | NE |
Drainage of agricultural soils * | Agriculture | N2O | Improve the drainage of fields to improve productivity, climate adaptation and reduce emissions from soils | Economic | Implemented | National support scheme | 2013 | Ministry of Agriculture and Food | NE | NE | NE | NE |
Project Climate Smart Agriculture * | Agriculture, LULUCF | CO2, CH4, N2O | Data collection, councelling, sharing knowledge | Information | Implemented | Project to develop and maintain tools to quantify greenhouse gas emissions from farms | 2017 | Ministry of Agriculture and Food | NE | NE | NE | NE |
Climate and environment programme * | Agriculture, LULUCF | CO2, CH4, N2O | Develop knowledge | Information | Implemented | Develop knowledge which, among others, will contribute to reduced emissions on farm level | 2013 | Ministry of Agriculture and Food | NE | NE | NE | NE |
Delivery of manure for production of biogas * | Agriculture, Transport | CH4, N2O | Reduce emissons from storage of manure | Economic | Implemented | Support scheme for delivery of manure. The goal is to increase the utilization of livestock manure to biogas production. | 2015 | Ministry of Agriculture and Food | 0.9 | 0.9 | 0.9 | 0.9 |
Restrictions on cultivation of peatlands * | LULUCF, Agriculture | N2O | Reduce emissions from cultivated organic soils | Regulatory | Implemented | Avoid conversion of peatland into cropland | 2020 | Ministry of Agriculture and Food | 0 | 2 | 5 | 7 |
For note and footnotes, see under table 4.2.
Estimated effect on national emissions
Emissions from land conversion from peatland to cropland are reported in the agriculture chapter for N2O, while the LULUCF chapter covers CO2 emissions. In 2020, the area of new cultivation of peatland was about the same as in 2019, but in 2021 the restrictions reduced the area of new cultivation and the related emissions of N2O and CO2. Since 2021 is the first year where the regulation was effective the whole year, the area of new cultivated peatland in this year was used when estimating the future effect of the measure.
Since the restrictions were enforced in June 2019, the effect for 2020 is set to 0. The effect is estimated to increase to 7 ktonnes CO2 equivalents for the year 2035, based on the prevention of cultivation of 180 ha per year. The effect of the restrictions is increasing over time because the emissions from each hectare of drained peatlands continue for decades after the drainage have happened.
Box 4.10 Policies for agricultural soils’ quality, health and carbon retention
Policies for carbon storage include actions to reduce land take/soil sealing, and action to halt and reverse soil degradation. In 2020, a working group mandated by the Norwegian Agriculture Agency issued the National Soil Programme. Activities in this programme align with policy development for soils in the EU, including under Horizon Europe where soils are subject of one of five so-called “missions”. The National Soil Programme include activities to advance practices, know-how and incentives to advance soil ecosystems, soil quality and soil health.
In the letter of intent with the agricultural organisations from 2019, there is a combined ambition to reduce emissions and enhance removals in the agricultural sector. Policy developments for removals in agricultural soils that have been taken or that are due, include:
- National target to limit the land take of agricultural land to max. 300 ha per year (corresponding to max 0.03 per cent of total utilized agricultural area) was reached in 2021, and more ambitious targets and strategies are due.
- Various grant schemes for research on soil health and for practices that promote carbon sequestration in soils is included in the annual Agricultural Agreement under regional agri-environmental programmes.
- System to monitor status and changes in soils and track progress with efforts that are taken, are established from 2023.
- Soil carbon sequestration is part of the funding portfolio of Bionova, a new funding instrument to incentivize emission reductions, increased removals, and a more circular bio-economy.
4.3.10 Land Use, Land Use Change and Forestry
4.3.10.1 Introduction
Forests absorb CO2 and store large quantities of carbon, and are also an important source of renewable energy and wooden materials that can be used to replace materials with a larger carbon footprint. Other terrestrial ecosystems and organic soils are also large carbon sinks. On the other hand, human activity can cause large greenhouse gas emissions through land use and conversion of areas and ecosystems to other forms of use. To achieve a balance between anthropogenic greenhouse gas emissions and removals by sinks in the second half of this century, which is one of the aims of the Paris Agreement, it will be vital to reduce emissions and increase removals by the LULUCF sector. Boreal forests grow slowly, hence the mitigation effects must be considered in a very long timescale.
Box 4.11 Bionova
The government has decided to establish Bionova. Bionova is a new funding instrument for reaching Norway’s climate goals for 2030 and the goal of being a low-emission society in 2050 by contributing to reduced greenhouse gas emissions and increased soil carbon sequestration and storage as well as value creation through a transition to a more circular bioeconomy based on renewable biological resources from land and sea. Bionova will contribute to reducing greenhouse gas emissions and increased removals and carbon sinks at farm level.
4.3.10.2 Policies and measures in the LULUCF sector
A wide range of measures, including legislation, taxation, economic support schemes, research, extension services and administrative procedures, support the implementation of forest policy and mitigation actions. The current Forestry Act was adopted by the Norwegian Parliament in 2005 and entered into force in 2006. Its main objectives are to promote sustainable management of forest resources with a view to promote local and national economic development, and to secure biological diversity, consideration for the landscape, outdoor recreation and the cultural values associated with the forest. The Forestry Act also contributes to the conservation of biodiversity and the sustainable use of natural resources. However, the measures implemented will also influence CO2 sequestration. The Forestry Act requires the forest owner to regenerate areas within three years after harvesting.
The municipalities are the main spatial planning authorities under the Planning and Building Act, but the central government determines the overall framework through regulations, government expectations for regional and municipal planning and central government planning guidelines. The municipalities are obliged to take greenhouse gas emissions from the LULUCF sector into account in their land-use planning, as stated in the Planning and Building Act. Also, the planning guidelines for “Municipal and county climate- and energy planning and climate adaptation” requires municipalities to adopt measures and policies to reduce greenhouse gas emission. These should include measures and policies to reduce deforestation and to increase carbon sinks in forests and other land. Central government guidelines on spatial planning emphasise that spatial planning processes should be used to promote the development of compact towns and urban areas, and that the potential for densification, transformation and re-use of areas and buildings should be used before new areas are developed. Spatial planning in accordance with these principles will generally lead to lower GHG emissions from land use change compared to spatial planning that allows for extensive development of virgin land.
The methods and projections for managed forests are relatively well developed, although uncertainties are present, and the models are subject to continuous improvements. As for other types of land use and land use change, it is challenging to estimate the GHG effects of existing and possible new policies and measures. The government has requested relevant agencies to analyse the potential for GHG reductions from land use and land use change further.
4.3.10.3 Higher seedling densities in existing areas of forest land
Using higher seedling densities for forest regeneration increases the growing stock and CO2 removals by forest. In 2016, a grant scheme was launched to increase the seedling density used for regeneration after harvesting. This measure forms part of ordinary planting after harvesting, and thus does not involve any afforestation.
Estimated effect on national emissions
Higher seedling densities have no effect by 2030. However, in the longer term, it has greater potential, estimated to be around 2 million tons of CO2 in 2100.The total potential is not yet reached. Based on statistics, about 50 per cent of the total regeneration area has been covered by this scheme since it was implemented in 2016 and the remaining potential is approximately 1 mill tonnes CO2.
4.3.10.4 Genetical improvement, plant breeding
Tree breeding involves using of the genetic variation in forest trees to produce seeds that are more robust and provide higher yields than non-improved seed from ordinary forest stands. High-quality seeds have been produced in seed orchards, making it possible to develop forests where the tree survival rate is high, timber quality is better and volume growth is 10–15 per cent larger. If more effective tree breeding techniques are used, it may be possible to increase the growth in volume by 20 per cent or more. Thus, tree breeding is a way of increasing CO2 removals by forests. In addition, it is possible to ensure that forest reproductive material is resilient to future climate change. In 2016, a grant scheme was launched to support plant breeding.
Estimated effect on national emissions
Given these assumptions, it is estimated that the potential for CO2 removals could be approximately 0,15 mill. tonnes CO2-equivalents for 2035. For 2100, the estimated potential is 1.1 million tonnes CO2 annually. The most important tree species in Norwegian forestry is Norway spruce (≈50 per cent of the growing stock and 93 per cent of the planted seedlings). More than 90 per cent of the spruce trees that are planted annually originate from improved seeds.
4.3.10.5 Fertilization of forest as a climate mitigation measure
On forest land where growth is inhibited by the availability of nitrogen, using nitrogen fertiliser will increase both diameter and height growth, and increase annual CO2 removals for the next ten years. A grant scheme for fertilisation of forest as a climate mitigation measure was started in 2016. It is designed to meet recommended environmental criteria and avoid unacceptable effects on biodiversity and the environment otherwise.
Estimated effect on national emissions
It is estimated that fertilization of 5 000–10 000 hectares of forest is an acceptable amount of fertilization for biodiversity and the environment. The estimates show that the activity may give additional CO2 removals of 0.14–0.27 mill. tonnes annually.
4.3.10.6 Afforestation
From 2015 to 2018, the government tasked the Norwegian Environment Agency in close cooperation with the Norwegian Agriculture Agency, to carry out a pilot project for planting trees on new areas. The government has tasked the agencies to finalize a potential grant scheme for afforestation within a certain set of criteria that aims to ensure that no significant harm will be done to biodiversity.
Estimated effect on national emissions
The effect of afforestation depends on the amount planted, where the impact in the short term is meagre. However, the long-term effect can be substantial. Afforestation on new areas must be based on thorough assessments to find a balance between climate, environmental and commercial interests. The pilot project has helped identify challenges and opportunities, potential scoping of area and climate effect, as well as updated environmental criteria for planting trees as a climate solution. The government is assessing if and how to proceed with the initiative.
4.3.10.7 Tending of juvenile stands
Tending of young stands is necessary to select the most adapted tree-species and optimize growth. Correct spacing between the most adapted tree species lead to improved tree stability with straight stems that provide high quality lumber. The need for tending is stipulated to 40 000 ha per year, but the area treated is only about half of the area (20 000 ha per year).
Estimated effect on national emissions
By doubling the area treated each year it is possible to increase removals by 0–0,5 million tons CO2 equivalents by 2030 and 1.5–3.3 million tons CO2 by 2100 (estimate from the former Government’s Climate Action Plan for 2021–2030 — Meld. St. 13 (2020–2021) Report to the Storting (white paper))10. Tending as a climate measure is under consideration as a new climate measure in Norwegian forestry.
4.3.10.8 Measures to reduce damage from root-rot
Norway spruce grows well on soil with a high site index but is vulnerable to root-rot (hetrobasidion annosum). Twenty per cent of Norwegian spruce trees are infested with fungi and in 2019 it was estimated 500 000 m3 of sawlogs was damaged. Damaged trees typically have reduced growth and CO2 from infested trees will gradually be emitted to the atmosphere. It is important to prevent spreading of fungi to uninfected areas by treatment of stumps with Root-stop™ or urea when harvesting spruce in spring, summer, and autumn season.
Estimated effect on national emissions
Measures to reduce damage from root-rot have no effect in the short term. The measure can contribute with increased removals in 1 million tons CO2-equivalents per year by 2100 and is under consideration for implementation.
4.3.10.9 Regeneration with proper tree-species
The Norwegian Forestry Act requires preparation for regeneration to a certain number of trees pr area unit within 3 years after harvesting. The Act is not precise in terms of what tree species that can be accounted for. The former Government’s Climate Action Plan for 2021–2030 — Meld. St. 13 (2020–2021) suggests that only tree species that best can utilize the growing potential on the particular site can be accounted for.
Estimated effect on national emissions
This measure in under consideration and can increase removals by 0.1 million tons CO2 equivalents by 2030 and 1.3 million tons CO2 equivalents by 2100.
4.3.10.10 Threshold for tree-stand age by harvesting
If tree stands are cut too early, they will not be able to utilize their full potentials for carbon removals. The Government considers implementing a threshold age for harvesting that will be in line with the requirements under the Norwegian PEFC standards.
Estimated effect on national emissions
This measure can increase removals by 0.3 million tons CO2 equivalents by 2025.
4.3.10.11 Reduced emissions from peatlands and bogs
Peatland bogs and mires are important carbon stocks. There is a general prohibition against the cultivation of peatland and mires in Norway. The prohibition came into force in 2021. Farmers may apply for exceptions from the prohibition provided that certain conditions are met.
Estimated effect on national emissions
Emissions from land conversion from peatland to cropland are reported in the agriculture chapter for N2O (chapter 4.3.10.8), while the LULUCF chapter covers CO2 emissions. For CO2 alone, the projected effect can reach a little less than 80 000 tonnes by 2035, based on the prevention of cultivation of 180 ha per year. The effect of the restrictions is increasing over time because the emissions from each hectare of drained peatlands continue for decades after the drainage have happened.
4.3.10.12 New policies and measures
The Solberg government presented its Climate Action Plan for 2021–2030 — Meld. St. 13 (2020–2021) to the Parliament in 2021. Several of the new measures presented in that White Paper are under consideration for implementation by the Støre government. The Støre government’s climate status and plan was presented to the Parliament in October 2022 and outlines the government’s climate policies. For forestry, it is important for the government to continue and consider enhancing existing mitigation measures in the forest sector to increase removals. The Government will prioritize measures with a positive mitigation effect and a positive or acceptable effect for the environment. The Government will consider new mitigation measures in managed forest land that offer a high potential for enhancing CO2 removals and are easy to implement. This applies specifically to improving practices for tending young-growth stands and treatment of stumps to control root rot on Norway spruce. Furthermore, the government is considering to introduce requirements in the Forestry Act relating to minimum ages for logging in line with the requirements in the Norwegian PEFC Forest Standard, as well as considering to facilitate afforestation of new areas as a mitigation measure on the basis of clear environmental criteria.
Table 4.19 Summary polices and measures, LULUCF
Name of policy or measure a | Sector(s) affected b | GHG(s) affected | Objective and/or activity affected | Type of instrument c | Status of implementation d | Brief description e | Start year of implementation | Implementing entity or entities | Estimate of mitigation impact (not cumulative, in kt CO2 equivalents) | |||
|---|---|---|---|---|---|---|---|---|---|---|---|---|
2020 | 2025 f | 2030 f | 2035 f | |||||||||
Higher seedling densities in existing areas of forest land * | LULUCF | CO2 | Enhancing production in existing forests | Economic | Implemented | Increase the number of plants to an optimum level from a climate perspective to enhance net carbon sequestration | 2016 | Ministry of Agriculture and Food | 0 | 0 | 0 | 0 |
Genetical improvement, plant breeding * | LULUCF | CO2 | Enhanced forest management | Economic | Implemented | Genetically improvement means to single out robust plants which can improve growth and quality. | 2016 | Ministry of Agriculture and Food | 0 | 50 | 100 | 150 |
Fertilization of forests as a climate mitigation measure * | LULUCF | CO2, CH4, N2O | Enhancing production in existing forests | Economic | Implemented | Fertilization can sustain or improve carbon sequestration where nitrogen scarcity in existing forest areas limits plant growth. | 2016 | Ministry of Agriculture and Food | 0 | 270 | 270 | 270 |
Afforestation | LULUCF | CO2 | Enhancing production in existing forests | Economic | Planned | Planting trees on new areas to increase the carbon uptake | Ministry of Climate and Environment | NA | 0 | 0 | 0 | |
Tending of juvenile stands | LULUCF | CO2 | Enhancing production in existing forests | Economic | Planned | Tending of young stands is to select the most adapted tree species and optimize growth. | Ministry of Agriculture and Food | NA | 0 | 500 | 500 | |
Measures to reduce damage from root-rot | LULUCF | CO2 | Enhancing production in existing forests | Economic | Planned | Treating stumbs after harvest to reduce the spread of tree rot to increase growth. | Ministry of Agriculture and Food | NA | 0 | 0 | 0 | |
Regeneration with proper tree-species | LULUCF | CO2 | Enhancing production in existing forests | Regulatory | Planned | Regeneration with the tree species that gives the highest growth | Ministry of Agriculture and Food | NA | 0 | 100 | 100 | |
Threshold for tree-stand age by harvesting | LULUCF | CO2 | Enhancing production in existing forests | Regulatory | Planned | Regulate the minimum harvesting age | Ministry of Agriculture and Food | NA | 300 | 300 | 300 | |
Reduced emissions from peatlands and bogs * | LULUCF | CO2 | Conservation of carbon in existing forests, prevention of drainage or rewetting of wetlands | Regulatory | Implemented | Avoid conversion of peatland into cropland | 2020 | Ministry of Agriculture and Food | 4 | 41 | 60 | 78 |
For note and footnotes, see under table 4.2.
4.3.11 Waste
4.3.11.1 Introduction
The main goal of the Norwegian waste policy is that waste is to cause the least possible harm to humans and the environment. The quantity of waste generated is to be considerably lower than the rate of economic growth, whilst rates for the preparing for reuse and recycling should rise. Furthermore, the amount of hazardous waste is to be reduced and hazardous waste is to be dealt with in an appropriate way. The measures to reduce greenhouse gas emissions are to a large extent concurrent with measures to increase recycling and recovery. The most important measures are:
- Regulations under the Pollution Control Act, including the ban on depositing biodegradable waste in landfills and requirements regarding extraction of landfill gas (see below).
- Extended producer responsibility for specific waste fractions.
- The tax on waste incineration (described under 4.3.2)
In general, targets set in EU waste directives, such as EU-targets for preparing for reuse and recycling of municipal waste, also apply for Norway owing to the EEA agreement.
4.3.11.2 Requirement to collect landfill gas
The largest emissions in the waste sector derive from landfill gas. In 2017, the methane emissions from landfills amounted to approximately 33 730 tonnes, corresponding to 2 per cent of the total greenhouse gas emissions in Norway. Landfill gas emissions have been reduced by about 52 per cent from 2000 to 2020 and by more than 50 per cent from 1990 to 2020. The reduction is mainly due to the decrease of organic waste in landfills as depositing biological waste has been prohibited.
The Landfill Directive was incorporated into national law by the Norwegian Landfill Regulations of 21 March 2002, and states that all landfills with biodegradable waste must have a system for extracting landfill gas. The gas emissions are monitored by measuring boxes placed on the landfill surface. Also, visual inspection of the landfill surface for obvious leaks should be conducted regularly.
Extraction of landfill gas increased from about 950 tonnes CH4 in 1990 to about 19 400 tonnes CH4 in 2010. In 2020, extracted methane from landfills amounted to almost 6 150 tonnes CH4. The reduction is primarily due to the prohibition of depositing organic waste. In Norway, in 2020, 3 per cent of the landfill gas production was utilized to generate electricity. 56 per cent is flared, and 33 per cent is used in heat production.
Estimated effect on national emissions
To estimate effect of the requirement to collect landfill gas it has been assumed that all collection of landfill gas occurred due to requirements. Even if the regulation was implemented in 2002, some landfills had been required in their permits to collect gas before. Therefore, effect has been estimated from 1995. To estimate the effect for the years 2020, 2030, it has been assumed that the composition and the quantity of waste to be deposited to landfill will be constant during the same period. It has also been assumed that the share of collected methane among potential emissions will be constant during the same period.
The mitigation impact has been estimated to 153 kt CO2 equivalents in 2020, 119 kt CO2 equivalents in 2025, 94 kt CO2 equivalents in 2030 and 76 kt CO2 equivalents in 2035. The downward trend is due to the prohibition regulation which has reduced amounts of organic waste deposited and thus potential emissions.
4.3.11.3 Ban on depositing biodegradable waste in landfills
In 2002, Norwegian authorities introduced a ban on depositing easily degradable organic waste in landfills. This prohibition was replaced in 2009 by a ban on the depositing of all biodegradable waste in landfills. Since the introduction of these regulatory measures, the annual amount of biodegradable waste deposited in landfills has been reduced by 99.6 per cent in the period between 1990 and 2020. Meanwhile, the amount of all waste generated increased by more than 65 per cent in the same timeframe. Due to the decomposing process, CH4 production from landfills will continue for several decades after the waste has been disposed of. Nevertheless, the prohibition on depositing biodegradable waste in landfills will reduce CH4 emissions over time, as the amount of deposited biodegradable waste is reduced.
Estimated effect on national emissions
To estimate the effect of the ban of depositing biodegradable waste, it has been assumed a constant share of deposited amounts among easy degradable organic waste from 2002 to 2030. A constant share of deposited amounts of waste among other biodegradable waste has been assumed from 2009 to 2030 to estimate the effect of the prohibition of all biodegradable waste.
To calculate total produced amounts of organic and other biodegradable waste, the population growth has been used.
Between 2002 and 2009, collected landfill gas amounted to around 26 per cent of national potential methane emissions from landfills. This value has been kept constant during the period 2002–2030 to estimate the mitigation impact of the regulation. This impact has been estimated to 461 kt CO2 equivalents in 2020, 595 kt CO2 equivalents in 2025, 699 kt CO2 equivalents in 2030 and 780 kt CO2 equivalents in 2035.
4.3.11.4 Other measures in the waste sector
4.3.11.4.1 Extended producer responsibility
The systems of extended producer responsibility is based on requirements regarding waste regulation and to some degree on tax incentives. EPR is important to ensure that waste is collected and sent to approved treatment and for fulfil national or EEA-wide targets for recycling. Extended producer responsibility schemes have been made for packaging, electronic waste, tires and PCB-infected insulation of windows.
4.3.11.4.2 Agreement on reduction of food waste
In 2017 the government concluded an agreement on the reduction of edible food waste together with relevant stakeholders representing the entire food value. The parties to the agreement have committed to reduce edible food waste by 50 per cent before 2030. The initial results indicate that the levels of edible food waste in Norway have been reduced by nearly 10 per cent in the period between 2015 and 2020.
4.3.11.4.3 Measures to increase waste recycling
The waste regulations regulate a number of waste fractions, and for some fractions set specific targets for recycling, for instance for end-of-life vehicles.
When it comes to EU-targets for preparing for reuse and recycling of municipal waste, a revision made this year of the national waste regulation introduces a new requirement, applicable as of 2023, to separate biowaste (i.e. food, park and garden waste) and plastic waste at source. Furthermore, the new regulation requires that bio- and plastic waste separated at source is sent to recycling.
There is also a tax on beverage packaging. The tax is reduced by the accepted recycling rate; each percentage of recycling reducing the tax one per cent. The recycling rate is set by the Environment Agency and regulated by the waste regulation.
The pollution control act encourages municipalities to determine differentiated waste fees, as this could contribute to waste reduction and increased recycling. Many municipalities in Norway collect source separated household waste like paper and cardboard waste or biological waste free of charge or to highly reduced fees. The costs are subsidized by the fees for the mixed waste. This gives incentives to the inhabitants of a municipality to separately collect certain fractions of household waste that can be recycled.
Estimated effect on national emissions
It is difficult to quantify the mitigation effects on greenhouse base emissions of these other measures in the waste sector. Their objectives are primarily to increase waste recycling, this is not necessarily reflected in the GHG inventory that would be used to calculate GHG effects. The effects are therefore reported as not estimated (NE).
Table 4.20 Summary policies and measures, waste.
Name of policy or measure a | Sector(s) affected b | GHG(s) affected | Objective and/or activity affected | Type of instrument c | Status of implementation d | Brief description e | Start year of implementation | Implementing entity or entities | Estimate of mitigation impact (not cumulative, in kt CO2 equivalents) | |||
|---|---|---|---|---|---|---|---|---|---|---|---|---|
2020 | 2025 f | 2030 f | 2035 f | |||||||||
Requirement to collect landfill gas * | Waste | CH4 | Reduce emissions from landfills | Regulatory | Implemented | All landfills with biodegradable waste must have a system for extracting landfill gas | 2002 | Ministry of Climate and Environment, Ministry of Agriculture and Food (National government) | 153 | 119 | 94 | 76 |
Ban of depositing biodegradable waste in landfills * | Waste | CH4 | Reduce emissions from landfills | Regulatory | Implemented | From 2002 landfilling of easy degradable organic waste was prohibited. This prohibition was replaced by the wider prohibition of depositing from 2009 that applies to all biodegradable waste | 2002 | Ministry of Climate and Environment, Ministry of Agriculture and Food (National government) | 461 | 595 | 699 | 780 |
Other measures in the waste sector * | Waste | CO2, CH4, N2O | Reduce emissions, increase recycling and reduce the quantities of waste | Regulatory, fiscal, voluntary | Implemented | Agreements primarily to ensure that waste is collected and sent to approved treatment. Waste regulations for a number of waste fractions and a tax on beverage packaging. Tax on incineration up to 2010 and for landfills up to 2015. | 1995 | Ministry of Finance and Ministry of Climate and Environment | NE | NE | NE | NE |
For note and footnotes, see under table 4.2
4.4 Policies and measures no longer in place
Arrangement to reduce emissions in the processing industry, 2004 and 2009. See description in chapter 4.3.8.
Agreement with the aluminium industry. See description in chapter 4.3.8.
Agreement on SF6 reductions from use and production of GIS. See description in chapter 4.3.8
SF6 reduction, production of magnesium. See description in NC7.
Tax on final disposal of waste. See description in chapter 4.3.2.3
Grants for biogas projects. See chapter 4.2.9.8 in BR4.
Discount in the pilotage readiness fee. See chapter 4.2.7.5 in BR4.