3 Taxation and the optimal constraint on corporate debt finance
Peter Birch Sørensen1 University of Copenhagen, Department of Economics
Abstract:The tax bias in favour of debt finance under the corporate income tax means that corporate debt ratios exceed the socially optimal level. This creates a rationale for thin-capitalization rules limiting the amount of debt that qualifies for interest deductibility. This paper sets up a model of corporate finance and investment in a small open economy to quantify the deadweight loss from the asymmetric tax treatment of debt and equity and to identify the second-best optimal debt-asset ratio in the corporate sector. For plausible parameter values derived from data for the Norwegian economy, the deadweight loss from the tax distortions to corporate financing decisions amounts to 2–3 percent of total corporate tax revenue, and the socially optimal debt-asset ratio is 4–5 percentage points below the debt level currently observed. Driving the actual debt ratio down to this level would generate a total welfare gain of about 3 percent of corporate tax revenue. The welfare gain would arise partly from a fall in the social risks associated with corporate investment, and partly from the cut in the corporate tax rate made possible by a broader corporate tax base.
Non-technical summary
The tax bias in favour of debt finance under the current corporate income tax provides a rationale for restricting the use of debt via thin capitalization rules or caps on corporate interest deductions. The debt bias in the corporate income tax may also be mitigated through reduced personal taxes on dividends and capital gains on shares.
To illustrate these points, this paper sets up a model of a small open economy where companies are grouped into «large firms» and «small firms». The large firms have access to the international markets for shares and debt instruments and their marginal investors do not pay personal taxes to the domestic government. The shares in small firms are not traded internationally, and their controlling shareholders are subject to domestic personal taxes on interest, dividends and capital gains.
To maximize their after-tax profits, firms choose a cost-minimizing mix of debt and equity finance by trading off the tax and non-tax benefits and costs of the two modes of finance against each other. The risk premiums included in the required rates of return on the shares and debt of a company depend in part on its debt-to-asset ratio. The risk premiums do not only reflect non-diversifiable risk; they also compensate for the agency costs of monitoring the firm and its management and for the potential costs of bankruptcy.
Up to a certain point, an increase in a company’s debt ratio may help to reduce the shareholders’ costs of monitoring the firm, e.g. because higher debt may serve to discipline the company’s management. But as the debt ratio increases, the potential costs of financial distress and the risk of bankruptcy will also increase, and shareholders and debtholders will start to require higher risk premiums. In the absence of tax companies will balance the marginal (non-tax) benefits and costs of debt against each other and will generally choose a positive debt-asset ratio between zero and one.
Under a conventional corporate income tax there is a tax benefit from debt finance because interest payments are deductible from the corporate tax base whereas the cost of equity finance is not. This tax bias against equity at the corporate level is rarely fully offset by a corresponding tax relief for shareholder income under the personal income tax. Companies will therefore choose a higher debt ratio than they would have preferred in the absence of tax.
This additional debt induced by the tax system causes a loss of economic efficiency. The paper shows formally that this deadweight loss is closely linked to the rise in the risk premiums on debt and equity caused by the additional tax-induced debt.
With plausible parameter values derived from data for the Norwegian economy, the model developed in this paper implies that the current tax bias against equity finance has led to corporate debt-asset ratios which are on average about 4 percentage points higher than they would have been in case of a fully neutral tax treatment of debt and equity. The resulting loss of economic efficiency – roughly equivalent to a loss of net national income – is estimated to amount to 2–3 percent of the revenue from the corporate income tax.
While the non-neutral tax treatment of debt and equity generates an efficiency loss by distorting corporate financing decisions, the deductibility of interest also helps to mitigate the tax distortion to the real investment decisions of companies because it shields the marginal return on debt-financed investment from corporate income tax. Both of these effects of interest deductibility must be included in an overall evaluation of the distortions caused by the corporate tax system.
Nevertheless, it is possible to improve economic efficiency and raise net national income through a thin-capitalization rule (or a cap on interest deductions) that reduces the average debt-asset ratio somewhat below the current level. When companies have optimized their initial debt ratios, their total cost of finance will not be noticeably affected by a small shift from debt to equity. At the same time a reduction in corporate debt and the resulting fall in interest deductions will increase the corporate tax base and will therefore allow a cut in the corporate income tax rate, assuming that the government wishes to raise a given amount of corporate tax revenue. Because of this tax cut, a small shift from corporate debt to equity will actually stimulate corporate investment, thereby generating a welfare gain. In addition, there is a welfare gain from the lower risk premia induced by a lower debt ratio.
However, as the corporate debt ratio continues to fall, the concomitant fall in risk premiums will decelerate, and the cost of corporate capital will start to increase due to falling interest deductions, even if the corporate tax rate continues to drop. Hence there is a socially optimal cap on corporate debt ratios at the point where the marginal welfare gain from lower risk premiums is just offset by the marginal welfare cost from the fall in investment caused by a higher cost of capital.
For plausible parameter values, the optimal cap on the corporate debt ratio is about 5 percentage points lower than the average corporate debt ratio currently observed in Norway. This implies that it is optimal to force the average debt ratio down below the estimated level that would prevail in the absence of tax. The reason is that the broader tax base caused by the cap on debt finance allows a cut in the corporate tax rate which alleviates the investment distortions caused by the tax.
According to the model, the total corporate interest deductions associated with the socially optimal corporate debt ratio would make up about 25 percent of the total EBIT (Earnings Before Interest and Tax) of the corporate sector. In 2012, the total interest expenses of Norwegian non-financial companies amounted to 27.6 percent of their total EBIT.
A reduction of the average corporate debt ratio from the current level to the socially optimal level is estimated to generate an economic efficiency gain of about 3 percent of the total revenue from the corporate income tax.
The etimate for the optimal debt cap is subject to uncertainty. Among other things, it is sensitive to the size of the semi-elasticity of the corporate debt ratio with respect to the corporate tax rate. This semi-elasticity measures the relative increase in the debt ratio induced by a one percentage point increase in the corporate tax rate. Based on surveys of the empirical literature, the benchmark estimates reported above assume a semi-elasticity of debt equal to 0.3, but some studies have found a lower elasticity. If the elasticity is only 0.2, the estimated optimal cap on the corporate debt ratio increases from 53.9 percent to 55.3 percent. For comparison, the average corporate debt-asset ratio in Norway was 58.6 percent in 2012.
Under current Norwegian tax law, personal resident shareholders only pay personal tax on dividends and capital gains that exceed an imputed risk-free after-tax interest rate on the value of their shareholding. This tends to offset the corporate tax bias against equity finance. If this shareholder tax relief were not granted, the efficiency loss from the non-neutral tax treatment of debt and equity would be about 25 percent larger, and a tighter cap on corporate debt finance would be warranted.
The data for the Norwegian economy show that small firms are on average more leveraged than large firms, despite the fact that the tax bias against equity in small firms is mitigated by tax relief at the shareholder level. This suggests that small firms have more difficulties in tapping the market for equity, so on average they will be hit harder by a debt cap applying equally to all firms. More generally, there is considerable heterogeneity in debt ratios across industries and individual firms, indicating that the costs and benefits of debt finance may vary greatly from one firm to another. These facts may warrant a less restrictive cap on debt ratios and/or on interest deductions than the caps suggested by the model in this paper.
3.1 The problem: Addressing the debt bias of the corporate income tax
A conventional corporate income tax allows deductibility of interest but does not grant an allowance for the cost of equity finance. This tax bias in favour of debt is causing concern among policy makers, for two reasons. First, there is mounting evidence that the shifting of debt and interest deductions within a multinational group is a major tax planning instrument whereby multinational companies reallocate taxable profits towards low-tax jurisdictions (see, e.g., Desai, Foley and Hines (2004); Huizinga, Laeven and Nicodème (2008), Gordon (2010), and the survey by de Mooij (2011)). Second, in the wake of the recent financial crisis, there is a growing awareness that excessive use of debt finance makes companies more vulnerable to business cycle downturns and to credit crunches caused by financial instability, just as excessive gearing makes financial institutions more unstable (Keen and De Mooij (2012)).
During the last two decades the international tax policy debate has focused on two alternative designs for eliminating the debt bias under the corporation tax. One option for reform is the Allowance for Corporate Equity (ACE) originally proposed by the Capital Taxes Group of the Institute for Fiscal Studies (1991) and recently recommended by the Mirrlees Review (Mirrlees et al. (2011)). The ACE system allows companies to deduct an imputed return on equity as well as interest on debt, essentially turning the corporation tax into a tax on rents. The ACE is a logical policy implication of the theoretical insight that it is inoptimal to levy a source-based tax on the normal return to capital in a small open economy (Griffith, Hines and Sørensen (2010)). In recent years countries like Belgium and Italy have in fact experimented with versions of the ACE system (see Zangari (2014)), but generally policy makers have been reluctant to embrace the ACE, mainly due to the revenue loss it would imply.2
An alternative design for neutral tax treatment of debt and equity is the Comprehensive Business Income Tax (CBIT) originally described by the US Department of the Treasury (1992) and recently proposed (in a modified form) by the Swedish Corporate Tax Reform Committee (2014). In its clean version, the CBIT fully eliminates interest deductibility and turns the corporate income tax into a source-based tax on the full return to capital, regardless of the mode of finance. However, policy makers have generally shyed away from full elimination of interest deductibility for fear that it might generate capital flight and might cause severe transition problems for heavily indebted companies. The CBIT also raises difficult issues of corporate-personal tax integration and creates a need for special tax rules for deposit-taking financial institutions.
Instead of pursuing ambitious reforms like the ACE or the CBIT, most OECD countries have tried to tackle the debt bias and the problem of international debt shifting in more pragmatic ways. Early policy responses to debt shifting took the form of rules against thin capitalization. Such rules typically stipulate that companies can only deduct interest on debt up to a certain percentage of total assets. Unfortunately thin capitalization rules are potentially vulnerable to manipulation of asset values through clever accounting practices or to manipulation of interest rates on intra-company loans. Recently several countries have therefore supplemented their thin capitalization rules by direct limitations on the total amount of interest a corporate entity is allowed to deduct. Typically such a cap means that the total deduction for interest expenses cannot exceed a certain percentage of the company’s EBIT (Earnings Before Interest and Tax) or EBITDA (Earnings Before Interest, Tax, Depreciation, and Amortization).
Thin capitalization rules and caps on interest deductibility usually only apply to entities within a corporate group and they have mainly aimed at curbing international profit-shifting. This paper shows that the tax distortion in favour of debt finance provides a rationale for applying such rules to all companies (assuming that governments do not want to address the debt bias in a more radical way by introducing an ACE or a CBIT). To drive home this point in the clearest possible manner, I will simplify the exposition by abstracting from multinational group structures.3 I present a method of identifying and quantifying the second-best optimal level of corporate debt and of calculating the deadweight loss from the current tax bias against equity finance. I show that this deadweight loss is intimately linked to the rise in risk premiums generated by the tax bias in favour of debt. In this context, the «risk premiums» include not only compensation for uncertainty; they also compensate for the costs of financial distress and the agency costs incurred by investors as a consequence of imperfect and asymmetric information.
My theoretical framework is an extension of the widely used King-Fullerton and Boadway-Bruce-Mintz method of estimating the impact of taxes on the cost of capital (King and Fullerton (1984), Boadway, Bruce and Mintz (1984)), and Devereux (2004)). The main extension is that I endogenize the firm’s debt-asset ratio and introduce a distinction between firms with and without access to the international stock market. Throughout the paper I focus on a small open economy with free capital mobility.
The rest of the paper is structured as follows. Section 2 presents a model of corporate finance and investment to derive the cost of capital and the privately optimal pattern of finance for companies faced with asymmetric tax treatment of debt and equity. Section 3 illustrates the efficiency loss from the corporate income tax, including the deadweight loss from the tax bias in favour of debt finance and the loss from lower domestic investment. It also derives the second-best optimal debt-to-asset ratio of the corporate sector, assuming that the government has to raise a given amount of revenue from the corporate income tax. Section 4 calibrates the model to data from Norway and offers numerical estimates of the optimal level of debt, the deadweight loss from the non-neutral tax treatment of debt and equity, and the welfare gain from the optimal constraint on debt finance. In section 5 I summarize the main findings of the paper and discuss some limitations of the analysis.
3.2 A model of corporate finance and investment in a small open economy
This section sets up a simple model of corporate finance and investment in the King-Fullerton tradition. I focus on a small open economy facing an exogenous real interest rate determined in the world capital market. The business sector is divided into «small companies» and «large companies» . The large companies raise their equity capital in the international stock market and their marginal investor does not pay personal tax to the domestic government (although he/she may pay personal tax abroad). The shares in the small companies are not traded internationally and their marginal investors are domestic residents subject to domestic personal taxes.
The model uses the following notation:
ρ = user cost of capital
δ = real rate of economic depreciation
c= real private cost of capital
cs= real social cost of capital
re= required real rate of return on shares
r= risk-free real interest rate
π = rate of inflation
pd= risk premium in the interest rate on corporate debt
pe= risk premium in the required return on equity
q= real cost of corporate finance
β = debt-asset ratio
τ = corporate income tax rate
tr= personal tax rate on nominal interest income
te= effective personal tax rate on nominal income from shares
K= capital stock invested in the domestic economy
Π = total after-tax profit
R= corporate income tax revenue
Variables specific to the sector of large firms will carry a subscript l, while variables pertaining to the sector of small firms will be indicated by the subscript s. In the following I describe the behaviour of the two types of firm.
3.2.1 Large firms
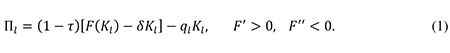
The total revenue of the representative large firm is given by the concave revenue function F(Kl). As a benchmark, I assume that the tax code allows companies to deduct the true economic depreciation of their assets from the corporate income tax base. The real after-tax profit of the representative large company may then be written as
A key feature of the model is the relationship between the individual company’s debt ratio and its cost of finance. Following Boadway (1987) and numerous other writers, I assume that the risk premiums in the required returns on a company’s debt and equity depend on its debt-to-asset ratio. Specifically, the real cost of finance for a large company is
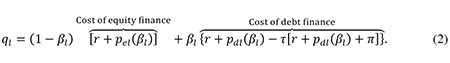
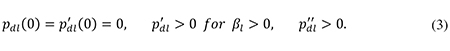
According to (2) the cost of finance is a weighted average of the cost of equity finance and the cost of debt finance, with weights determined by the debt-asset ratio. The cost of debt finance is reduced by the fact that the company may deduct all of its nominal interest payments from the corporate tax base. It is reasonable to assume that a company starting out with zero debt will face a zero risk premium on debt initially, but as it starts to borrow, the risk premium will gradually become positive and rise at an increasing rate as the debt ratio increases, reflecting the growing risk that a more indebted firm will not be able to service (all of) its debt. I therefore assume that the risk premium on debt, pdl(βl), has the following properties:
The required risk premium on equity – which must also compensate shareholders for the agency costs of controlling the firm and its management – is given by the function pel(βl). The shareholders’ agency costs of monitoring the firm may be reduced if they can be shared with the debtholders, as emphasized by Jensen (1986). Up to a certain point the required risk premium on equity may therefore decline as the company increases its debt-asset ratio. However, as the debt ratio grows, the risk of bankruptcy becomes a growing concern. Sooner or later this will generate conflicts of interest between shareholders and debtholders, as argued by Jensen and Meckling (1976). Beyond a certain debt ratio the required premium on equity will therefore start to increase at a growing rate as shareholders face accelerating risks and costs of controlling the firm. Formally, these mechanisms mean that p’el(βl) will be negative at low levels of βl, but positive at high values of βl, and that p’’el(βl) > 0. Consequently, even if debt were not favoured by the tax system, a company seeking to minimize its cost of finance would want to choose a positive debt ratio between zero and one.
The cost of finance in (2) may be rewritten as
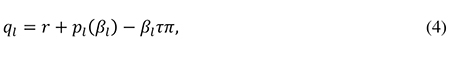
where pl(βl) is the total after-tax risk premium defined as
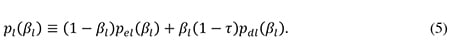
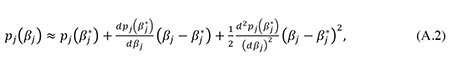
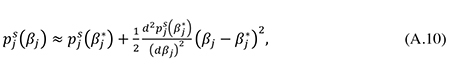
In order to derive an explicit analytical solution for the company’s optimal debt ratio, I will work with a second-order Taylor approximation of the expression for pl(βl), where the Taylor expansion is made around the cost-minimizing debt ratio βl* that the company would choose in the absence of tax. In section 1 in the appendix I show that such an approximation yields
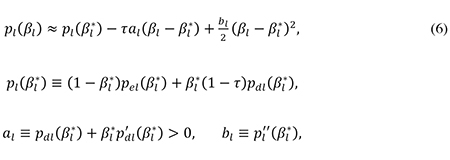
where al is the marginal risk premium on debt at the debt level βl*. A necessary condition for profit maximization is that the company minimizes its cost of finance. Using (4) and (6), one can show that the first-order condition for minimization of ql with respect to βl implies
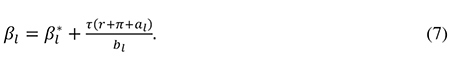
From (4) and (6) I find the second-order condition for a cost minimum to be d2ql/(dβl)2 = bl > 0. Since al is also positive (see (6)), it follows from (7) that the (marginal) tax shield provided by debt finance – captured by the term τ(r + π + al) – induces the company to choose a higher debt ratio than the ratio βl* it would have preferred in the absence of tax. Note from the definition of al that the marginal value of the tax shield includes the tax saving on the intra-marginal debt occurring when the risk premium increases due to a rise in the company’s debt.
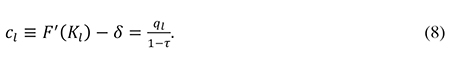
Equations (4), (5) and (7) determine the company’s cost of finance, given that it chooses the privately optimal combination of equity and debt. The firm then adjusts its capital stock so as to maximize its profit given by (1). The first-order condition dΠl/dKl = 0 yields the following expression for the company’s cost of capital, defined as the required real pre-tax return on the marginal investment:
3.2.2 Small firms
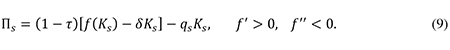
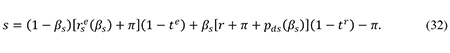
The representative small firm earns the total revenue f(Ks) and makes an after-tax profit equal to
The shares in small firms are not traded internationally and their marginal investors are subject to domestic personal income tax. The required return on equity in these firms is therefore affected by the domestic rules for the taxation of interest, dividends and capital gains on shares. As noted by Sørensen (2014), it is common for the controlling owners of small firms to invest the bulk of their equity wealth in their own company. The reason may be that, to establish a business firm of a viable size, a certain minimum amount of equity may be needed, and this may exhaust most of the entrepreneur’s limited amount of wealth. For the typical small business owner, the relevant portfolio choice may therefore boil down to deciding whether to invest (more) equity in one’s own company or to invest in interest-bearing assets, possibly by paying off some debt. I therefore assume that the required real rate of return on shares in small firms (rse) is given by the arbitrage condition
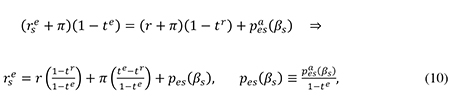
where pesa(βs) and pes(βs) are, respectively, the after-tax and the pre-tax risk premium included in the required return on equity. Eq. (10) says that the expected after-tax return on shares in small companies must equal the after-tax return on risk-free bonds plus a risk premium that depends on the company’s debt ratio. In accordance with common practice, the personal tax rates te and tr are assumed to be levied on the nominal returns, and the effective tax rate on shareholder income (te) accounts for any relief of taxes on dividends and capital gains that may be granted to mitigate the double taxation of corporate income.
Reflecting the risk of banktruptcy, the risk premium included in the interest rate on the debt of small firms is pds(βs). Using (10), we may thus write the real cost of finance for small firms as
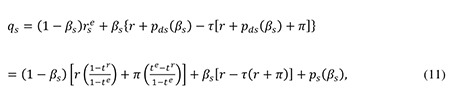
where
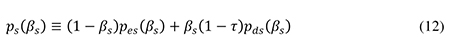
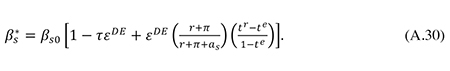
is the small firm’s total after-tax risk premium which depends on its debt policy. Making a second-order Taylor expansion of the expression for ps(βs) around the cost-minimizing debt ratio βs* that the small firm would choose in the absence of tax, one can approximate the function (12) by an expression analogous to (6):
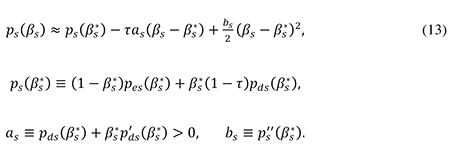
From (11) and (13) one finds the first-order condition for minimization of qs with respect to βs to imply that
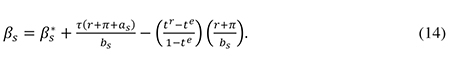
The second-order condition for a cost minimum can be shown to be bs > 0, and from (13) we know that as > 0. Eq. (14) shows that the debt bias implied by the corporate tax shield τ(r + π + as) is counteracted by the personal tax system to the extent that shareholder income is taxed more leniently than interest income (i.e., te > tr).
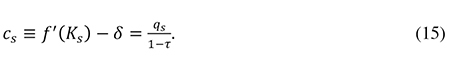
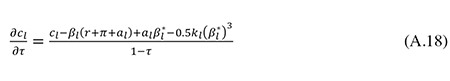
Having chosen the optimal debt ratio given by (14), the small firm adjusts its capital stock Ks so as to maximize its net profit (9). The first-order condition for optimal investment yields the following expression for the small company’s cost of capital:
3.3 The deadweight loss from the corporate income tax
It is immediately clear from (8) and (15) that the corporate income tax distorts the cost of capital, thereby generating a deadweight loss due to reduced investment. The corporate tax system also creates a deadweight loss by distorting corporate financing decisions. More precisely, the tax system increases the risk premiums that companies must pay. These risk premiums include real resource costs in the form of agency and bankruptcy costs. The deadweight loss from tax distortions to financing decisions may therefore be measured by the increase in the risk premiums caused by the tax system. I will now demonstrate this proposition, starting with the case of large companies.
3.3.1 The risk premium and the deadweight loss from the tax bias against equity
The impact of a change in the debt ratio βl on social welfare may be measured by its impact on the total rents to society generated by the investment undertaken by large firms. By definition, these rents are the sum of the after-tax (pure) profits earned by large companies and the taxes they pay to the government. When the debt ratio βl increases by a small amount, the after-tax profits will be unaffected. The reason is that, when firms have optimized their debt ratios, a small change in βl will have no first-order effect on the cost of capital and the amount of investment, since the cost increase caused by higher risk premiums will be just offset by the tax savings from higher interest deductions. Hence the effect of a small increase in the debt ratio βl on total pre-tax rents may be measured by the resulting change in tax revenue. When βl increases by one unit, the per-period loss of corporate tax revenue (ΔRl) stemming from larger interest deductions in the sector of large firms will be
The term [r + π + pdl(βl)]Kl in (16) is the interest payment on the additional debt, while the term βlp’dl(βl)Kl captures the increase in the interest payments on the pre-existing debt caused by the rise in the risk premium on debt induced by the higher debt ratio.
As mentioned, ΔRl is a measure of the marginal deadweight loss (MDWLl) from the increase in βl. When the large firm has optimized its initial debt ratio, it follows from (7) and (6) that τ(r + π) = bl(βl – βl*) – τal = p’l(βl). Inserting this into (16), we find that
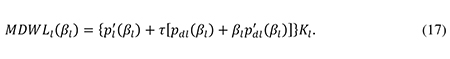
According to (17), the marginal deadweight loss from a rise in the debt ratio (measured per unit of capital) equals the sum of the increase in the private after-tax risk premium, p’l(βl), and the loss of corporate tax revenue following from the higher risk premium on debt, τ[pdl(βl) + βlp’dl(βl)]. While pl(βl) measures the private (after-tax) risk premium, the social (pre-tax) risk premium in the cost of finance for large firms is given by
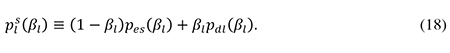
From (5) and (18) it follows that p’l(βl) + τ[pdl(βl) + βlp’dl(βl)] = dpls(βl)/dβl, so from (17) we get
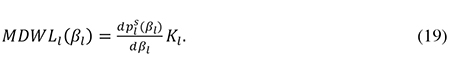
In other words, the marginal deadweight loss per unit of capital is simply equal to the rise in the social risk premium. Recalling that βl* is the cost-minimizing debt ratio in the absence of tax while βl is the corresponding ratio in the presence of tax, the total deadweight loss (TDWLl) caused by the tax distortion to the financing decisions of large firms is thus given by
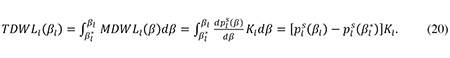
According to (20) the total increase in the social risk premium caused by the tax system provides a measure of the total efficiency loss from the tax distortion to corporate financing decisions. This result is intuitive, since the rise in the social risk premium reflects the welfare loss from a distortion to the allocation of risk and higher agency and bankruptcy costs.
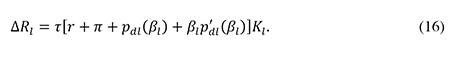
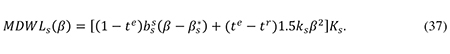
Let us now consider the welfare cost of the tax distortion to the financing decisions of small firms, recalling that their investments generate public revenue not only from the corporate income tax but also from the personal taxes paid by the shareholders and debtholders in these firms. The effect on social welfare of a small change in the debt ratio βs may therefore be measured by its impact on the sum of government revenue and the total after-tax income of small companies and their suppliers of capital. When small firms adjust their capital structure to maximize the after-tax profits accruing to existing owners, a small change in βs will have no first-order effect on the cost of capital and hence no effect on investment and after-tax profits. Moreover, the swap of debt for equity implied by a small increase in βs will have no first-order impact on the welfare of financial investors since they are indifferent (at the margin) between investing in shares or in debt instruments when the arbitrage condition (10) is met. By analogy to the case of large firms, we may therefore measure the welfare effect of a small change in βs by its impact on public revenue. The total revenue loss per period from a unit increase in βs (an increase in debt matched by a corresponding decrease in equity) is given by the following expression, where the term βsp’ds(βs)Ks reflects the increase in interest payments on the pre-existing corporate debt, and the term (1 – βs)p’es(βs)Ks captures the increase in the base for personal taxes on shareholder income generated by the rise in the risk premium on equity:
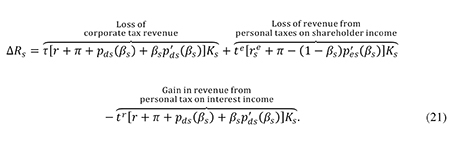
As mentioned, the revenue loss in (21) measures the marginal deadweight loss from an increase in βs, denoted as MDWLl(βs). Inserting the optimality conditions (10) and (14) in (21) and exploiting the link between p’es and p’ds implied by the definition in (12), one finds that
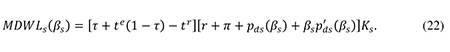
The term τ + te(1 – τ) is the total corporate and personal tax on equity income from the small company. From (22) we see that the marginal deadweight loss from an increase in βs is positive only to the extent that the total tax on equity income exceeds the personal tax on interest income. According to de Mooij (2012), this is the case in most OECD countries. By analogy to (18), we may define the social risk premium for small firms as
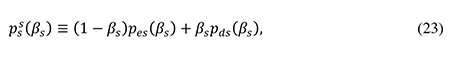
noting from (12) that pss(βs) = ps(βs) + τβspds(βs). Using these relationships along with (13) and (14), one can rewrite (22) as4
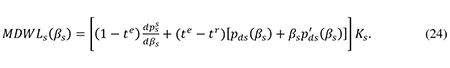
From (24) we find the total deadweight loss from the tax distortion to the capital structure of small firms (TDWLs) to be
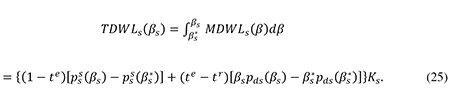
Once again we see that there is a close link between the total deadweight loss and the rise the risk premiums induced by the tax system. Further, note that in the absence of personal taxes (te = tr = 0) the total deadweight loss in (25) simply equals the total rise in the social risk premium, just as we found in the case of the large firms.
In section 3.4.2.1 I will use (20) and (25) to provide an estimate of the total efficiency loss from the non-neutral tax treatment of debt and equity and in section 3.4.2.2 I will use these formulas to derive the welfare gain from a cap on corporate debt ratios.
3.3.2 Illustrating the deadweight loss from the corporate income tax
Drawing on the above analysis, figure 1 illustrates the distortions caused by the taxation of the representative large firm. The horizontal axis measures the total stock of capital invested in the firm, and the vertical axis measures its cost of capital. The downward-sloping curve Kl(cl + δ) indicates the firm’s demand for capital which is a decreasing function of the user cost of capital, cl + δ. The capital demand curve reflects the (declining) marginal productivity of capital, so the total area under the curve Kl(cl + δ) measures the total output of the firm, valued at the exogenous world market price.
Figure 1 includes three measures of the cost of capital. The first one, cl, is the private cost of capital given by eq. (8). Faced with this ‘hurdle’ rate of return, the firm will install the capital stock Kl0.
The second measure, cl*, is the cost of capital that would prevail in the absence of taxation. It is found from (4) and (8) by setting βl = βl* and τ = 0, yielding
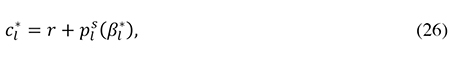
since it follows from (6) and (18) that pl(βl*) = pls(βl*) for τ = 0. In a hypothetical no-tax world where the cost of capital would be given by (26), the firm would install the capital stock Kl* indicated in figure 1.
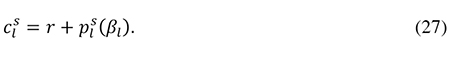
Finally, we have the measure cls which is the social cost of capital given the actual debt ratio βl chosen by the firm. This is the cost of finance to society, including the agency and bankruptcy costs caused by the additional debt βl – βl* induced by the tax system. The social cost of capital is found by setting τ = 0 in (4) and (8) and using the fact that pl(βl) = pls(βl) for τ = 0:
From (20), (26) and (27) we see that the area B in figure 1 is
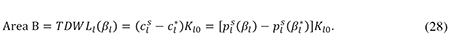
Thus area B measures the total deadweight loss caused by the tax bias against equity finance.
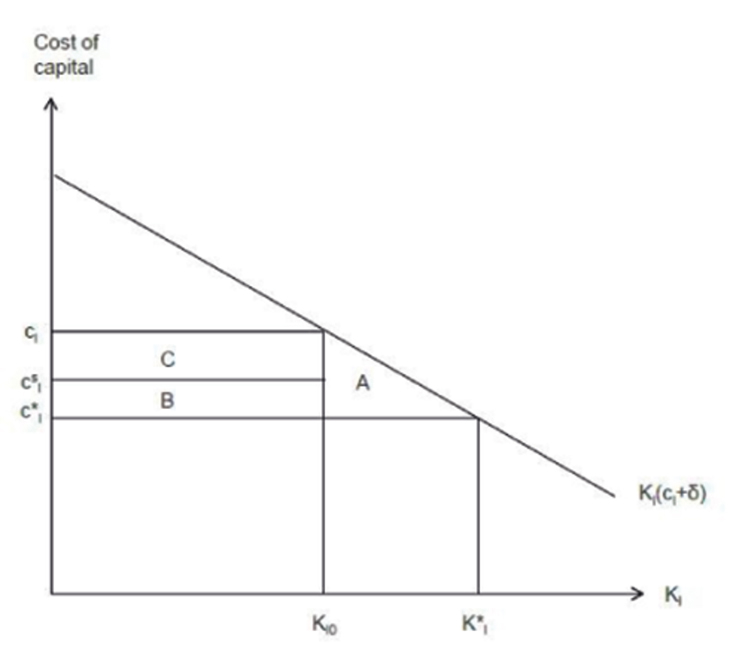
Figur 3.1 The deadweight loss from the corporate income tax in a small open economy
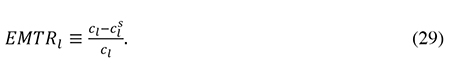
In addition, the corporate income tax generates a deadweight loss by discouraging investment, thereby reducing total real income. This efficiency loss is given by the familiar Harberger triangle A in figure 1. The effective marginal corporate tax wedge is given by the distance cl – cls on the vertical axis. If production took place under constant returns to scale, the average return to capital would equal the marginal return. The marginal effective tax rate (EMTR) would then coicide with the average effective tax rate (EATR), and the total corporate tax revenue collected from the firm would equal the area C in figure 1. However, in the realistic case where firms earn rents so that EATR > EMTR, the tax revenue will exceed area C.
The analysis in section 3.3.1 implies that it is socially optimal to restrict the use of corporate debt finance even though the deductibility of interest helps to alleviate the tax distortion to corporate investment. The reason is that a small reduction in corporate debt ratios does not increase the cost of corporate capital when companies have initially optimized their debt ratios, but it does generate a first-order welfare gain because of the fall in risk premia. However, as debt ratios continue to fall, the cost of capital will increase, thereby exacerbating the initial distortion to investment. At the same time the fall in risk premiums will decelerate, as the falling debt ratios make investment in corporate shares and bonds increasingly safe. Hence there is a socially optimal constraint on corporate debt finance at the point where the marginal gain from lower risk premiums – reflecting lower agency and bankruptcy costs – is just offset by the marginal loss from lower corporate investment. To identify the optimal cap on corporate debt finance, we must estimate the welfare cost of lower investment that has to be set against the welfare gain from lower distortions to corporate capital structures.
3.3.3 The deadweight loss from lower investment
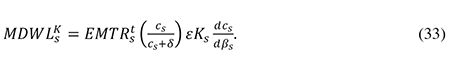
The marginal welfare cost of lower investment in large firms is the change in the area A in figure 1 caused by a unit drop in the capital stock. This marginal efficiency loss is equal to the marginal corporate tax wedge cl – cls which may be written as clEMTRl, where EMTRl is the marginal effective corporate income tax rate, defined as
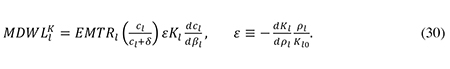
In the present context we imagine that the fall in the capital stock is caused by an exogenously imposed cut in the debt ratio βl which drives up the cost of capital. Using (29), recalling that Kl is a declining function of the user cost ρl ≡ cl + δ, and assuming that βl changes by one unit so that ρl changes by the amount dcl/dβl, we may then write the marginal deadweight loss from lower investment in large firms (MDWLlK) in the following way, where ε is the numerical user cost elasticity of capital demand:
The welfare cost of reduced investment in small firms may be calculated in a similar manner, but now we must account for the fact that the initial tax distortion is exacerbated by the personal taxes on the returns to saving. Specifically, the total marginal effective tax rate on investment in small firms is
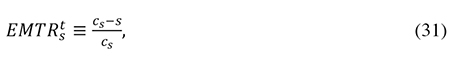
where s is the average real after-tax return to the savers supplying the debt and equity capital invested in small firms:
In parallel to (30), we can write the deadweight loss from lower investment in small firms as follows, assuming that the user cost elasticity of capital demand is the same for small and large firms:
3.3.4 The socially optimal corporate debt ratio
In our two-sector model the optimal cap on debt finance will generally differ between small and large firms. However, in practice it would be difficult for the government to apply different thin capitalization rules to different sectors, partly because of the administrative difficulty of delineating the various sectors, and partly because such a horizontal inequity might be seen as unfair (and might be challenged by the courts). In the following, I will therefore assume that any cap on the debt ratio imposed by the government will have to be the same for all firms. In that case, the economy may theoretically be in one of three possible regimes: one in which the constraint on the debt ratio is binding for all firms, and one in which it is binding only for large or only for small firms. However, the numerical analysis in section 4 will reveal that, for realistic paramenter values, the optimal cap on corporate debt ratios in our model economy will indeed be binding for both groups of firms. In this subsection I will therefore focus only on that scenario, i.e., I will assume that both groups of firms have the common debt ratio β equal to the debt cap imposed by the government.
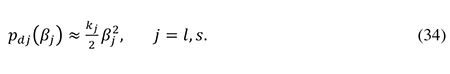
The second-best optimal limit on the corporate debt ratio is the value of β where the marginal deadweight loss from greater distortions to corporate financing decisions (in case of a marginal increase in β) is just equal to the marginal deadweight loss from lower investment (in case of a marginal fall in β). To derive a quantitative estimate for this value of β, I will use the following second-order approximation for the risk premium on debt which satisfies the plausible assumptions made in (3):
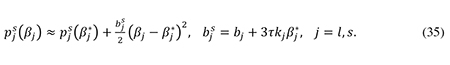
The marginal deadweight loss from greater distortions to corporate capital structures may now be calculated from (19) and (24) in a simple manner if we exploit the links between the various risk premiums. In section 1 of the appendix I show that our second-order approximations combined with the assumption of optimal financing decisions imply that the social risk premiums are given by
From (19) and (35) it follows that

and from (24), (34), and (35) one finds that
Setting the sum of the right-hand sides of (36) and (37) equal to the sum of the right-hand sides of (30) and (33), we obtain the following condition which implicitly determines the socially optimal limit on corporate debt ratios:
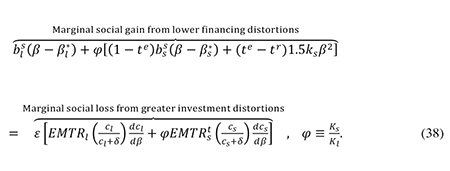
The marginal efficiency gains and losses in (38) are measured per unit of capital invested by large firms. The variable φ is a measure of the relative size of the sector of small firms and will be treated as a parameter. To apply formula (38), one must derive the changes in capital costs induced by a marginal change in β (dcl/dβ and dcs/dβ). When calculating these derivatives, I will assume that the government has to raise a given amount of corporate tax revenue given by
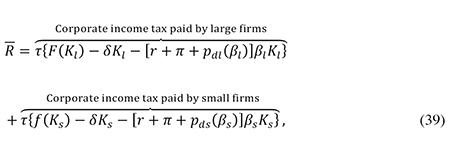
where
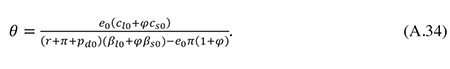
A first-order approximation to the cut in the corporate tax rate made possible by a marginal cut in corporate debt ratios can be obtained by taking total differentials in (39), setting the change in revenue equal to zero, using (8), (15), and (34), and assuming that the initial risk premiums on debt are the same across large and small firms (i.e., pdl(βl0) = pds(βl0) = pd0). One then arrives at the following expression where a 0-subscript indicates the value of the variable in the initial unconstrained equilibrium:

Here θ is the ratio between the marginal and the average pre-tax return to capital, assumed to be the same across large and small firms. Thus the variables cl0/θ and cs0/θ are the average initial pre-tax rates of return to capital in the two sectors, and 1/θ is a measure of the importance of rents in the economy. In the analysis below, θ will be treated as a parameter.
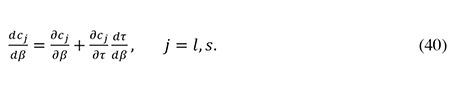
The expressions for the functions cl(β, τ) and cs(β, τ) and their partical derivatives are obtained from (11), (13) and (15)) and are documented in section 2 of the appendix. Using the results in the appendix, the derivative dτ/dβ appearing in (40) may be obtained by dividing the expression for dτ in (41) by dβ = (dβl + φdβs)/(1 + φ), where dβ is the weighted average change in the debt ratio across the two sectors.
In summary, equations (38), (40) and (41) determine the optimal value of β. Note from the derivation of welfare gains and losses in (38) that this value of β may be interpreted as the corporate debt ratio that maximizes rents to society, subject to the government budget constraint. Notice also that, at the initial equilibrium debt ratios we have ∂cj/∂βj = 0 whereas ∂cj/∂τ > 0 and dτ/dβ < 0. According to (40) this means that capital costs are likely to fall initially (due to a fall in the corporate tax rate) as the government starts to drive corporate debt ratios below their initial levels. It is only when the debt ratio has been pushed some distance below the initial leverage ratio of a sector that the sector’s capital cost will start to increase in response to a further cut in β.
In section 3 of the appendix I derive a first-order approximation to the total net welfare gain from a thin-capitalization rule that drives the average corporate debt ratio down to the socially optimal level. It will be convenient to express this gain as a fraction of the initial corporate tax revenue. Equation (39) does not allow a quantitative revenue estimate because it does not specify the production functions F(Kl) and f(Ks). To circumvent this difficulty, we may rewrite the total corporate income tax revenue in terms of the effective average corporate tax rates on the two sectors. The effective average corporate tax rate (EATR) measures the fraction of the average real pre-tax rate of return which is paid in tax. By the definitions of θ and cj, the average real pre-tax rate of return in sector j is cj/θ, so the total real amount of pre-tax profit in the sector is (cj/θ)Kj. Hence we may write total corporate income tax revenue as
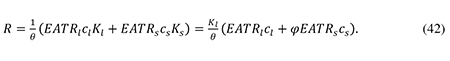
As shown by Sørensen (2004), the effective average and marginal tax rates are linked by the relationship
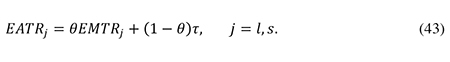
Thus the EATR is a weighted average of the EMTR and the statutory corporate income tax rate, so once the EMTRs have been derived, the EATRs can be calculated from (43). Note that while the effective marginal tax rate on small firms appearing in (38) includes the personal as well as the corporate income tax, the variable EMTRs in (43) only includes the corporate tax wedge, since we are now focusing on the revenue from corporate income tax. The EMTRs is calculated from a formula similar to (29).
3.4 Quantitative analysis
3.4.1 Calibration
I will now illustrate how the model may be calibrated for the purpose of quantitative analysis, using a data set for Norway and relevant parameter estimates from international empirical studies. The data and parameters underlying the benchmark calibration are summarized in table 1.
The value for r assumed in table 1 corresponds to current Norwegian estimates for the long-run average level of the risk-free real interest rate under normal market conditions (see, e.g. Norges Offentlige Utredninger 2012:16). The assumed level of the long-run average inflation rate equals the official inflation target of the Norwegian central bank. The initial risk premium on equity stated in the table – denoted by pe0 and assumed to be identical across the two groups of firms – is roughly equal to the long-run average (arithmetic) equity premium for Norway previously assumed by the Norwegian Ministry of Finance (see Nitter-Hauge and Frøyland (2005)). An equity premium of 4 percent is smaller than the historical average observed in Norway, but the survey by Dimson, Marsh and Staunton (2008) provides a number of reasons for believing that the future equity premiums across the world will be lower than the realized historical premiums. I have therefore maintained the assumption of a 4 percent equity premium. The risk premiums on corporate bonds vary considerably depending on their ratings. The initial risk premium on corporate debt (pd0) assumed in table 1 is believed to be a plausible average value for corporate bonds with intermediate maturity and good ratings. These values for pe0 and pd0 are introduced for the purpose of calibrating the parameters bj and kj so that the model generates realistic risk premiums in the initial equilibrium.
The corporate income tax rate and the personal tax rate on capital income assumed in table 1 are the actual rates prevailing in Norway in 2014. Under current Norwegian tax law, personal resident shareholders only pay personal tax on dividends and capital gains that exceed an imputed risk-free after-tax interest rate on the value of their shareholding (see Sørensen (2005a) for details). The excess of shareholder income over the risk-free return is taxed at the ordinary capital income tax rate tr. Using the definition of the equity premium (pe0 ≡ re – r), we may therefore calculate the effective tax rate on the nominal return to shares as

where (1 – tr)(r + π) is the deduction for the imputed risk-free return on the share. The effective marginal and average tax rates in table 1 follow from the formulas (29), (31), (32) and (43).
Tabell 3.1 Benchmark calibration
Norwegian data | Calibrated parameters | ||
|---|---|---|---|
r | 0.025 | te | 0.161 |
π | 0.025 | EMTRl | 0.098 |
pe0 | 0.04 | EMTRs | 0.026 |
pd0 | 0.01 | EMTRts | 0.33 |
τ | 0.27 | EATRl | 0.184 |
tr | 0.27 | EATRs | 0.148 |
βl0 | 0.566 | βl* | 0.52 |
βs0 | 0.664 | βs* | 0.627 |
β (average) | 0.586 | β* (average) | 0.542 |
φ | 0.258 | θ | 0.501 |
EBIT0 | 0.276 | δ | 0.075 |
EBITDA0 | 0.174 | al | 0.025 |
Estimates based on international studies | bl | 0.444 | |
kl | 0.062 | ||
as | 0.027 | ||
εDE | 0.3 | bs | 0.385 |
ε | 1.0 | ks | 0.045 |
The initial debt ratios βl0 and βs0 are estimated from data on the debt-to-asset ratios of Norwegian companies. The details of the estimation method are given in section 4 of the appendix. The parameter φ is estimated on the basis of data for the ownership structure of Norwegian companies. By construction, φ measures the extent to which the cost of corporate capital is affected by domestic personal tax rules. The method for estimating φ assumes that this impact is related to the fraction of shares owned by personal household investors (see the appendix for details).
The parameter EBIT0 in table 1 measures the average ratio of interest expenses to Earnings Before Interest and Tax in Norwegian companies in 2012, while EBITDA0 measures the ratio of interest expenses to Earnings Before Interest, Tax, Depreciation and Amortization. As section 4 in the appendix explains, the parameter θ has been calibrated to ensure that the model generates the observed value of EBIT0 in the initial equilibrium. The calibrated value of θ implies that roughly half of corporate profits are rents. Incidentally, this corresponds to the assumption made by de Mooij and Ederveen (2008). Furthermore, the parameter δ (the real rate of depreciation) has been calibrated to ensure that the model reproduces the observed value of EBITDA0 (see section 4 in the appendix).
In their survey of empirical studies of the effects of tax policy on investment, Hassett and Hubbard (2002) conclude that the numerical user cost elasticity of capital demand (ε) is probably between 0.5 and 1.0. Here I follow Auerbach and Kotlikoff (1987) in assuming that ε = 1, since this is consistent with the empirical observation that the aggregate gross profit share of GDP is relatively constant over the long run.
The debt ratios that would prevail in the absence of tax (βl* and βs*) are not directly observable, so they are calibrated to ensure that the initial model equilibrium reproduces the observed actual debt ratios, given a realistic value of the semi-elasticity of the debt-asset ratio with respect to the corporate tax rate. The semi-elasticity measures the relative increase in the firm’s debt-asset ratio when the corporate tax rate increases by one percentage point. Using (7), we can derive this semi-elasticity for the group of large firms:
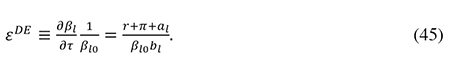
Inserting (45) in (7), we get
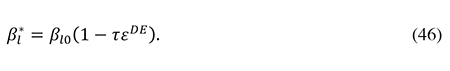
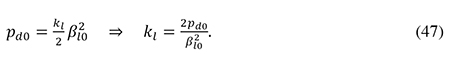
The parameter εDE has been estimated in numerous empirical studies. According to the survey by de Mooij and Ederveen (2008), a plausible value for the semi-elasticity of debt is εDE = 0.3. In an updated meta-analysis of a large number of empirical studies, de Mooij (2011) finds an average value of εDE closer to 0.2, but with a tendency for studies based on more recent data to find higher elasticities. Against this background, I have chosen to set εDE = 0.3 in the benchmark calibration of the model. Inserting this estimate for εDE and the observed initial debt ratio βl0 into (46), I arrive at the estimate for βl* reported in table 1. From (34) I can also find the value of the parameter kl that generates a realistic initial risk premium on debt, given the observed initial debt ratio:
From the definition of al given in (6) and the approximation in (34) it follows that
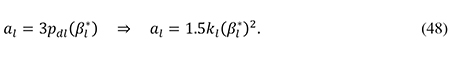
Thus al may be calculated by inserting (46) and (47) into (48), and the resulting estimate for al may then be substituted into (45) to find the value of bl.
The procedure for calibrating the parameters βs*, as, bs and ks is similar but slightly more complicated, due to the impact of personal taxes. The details of the calibration of these parameters are documented in section 4 in the appendix.
3.4.2 Results
3.4.2.1 The deadweight loss from the tax distortion to financing conditions
With the benchmark calibration described above, we can offer an estimate of the total deadweight loss caused by the non-neutral tax treatment of debt and equity (DWLf), measured as a fraction of total corporate tax revenue. From (20), (25), (34), (35) and (42) we get
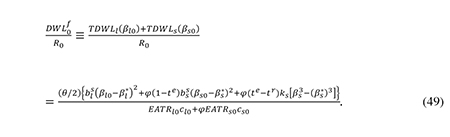
When the relevant numbers from table 1 are plugged into this formula, they imply that the deadweight loss from the tax bias against equity finance amounts to 2.54 percent of corporate tax revenue, equivalent to slightly less than 0.1 percent of mainland GDP in Norway in 2012. This is the same order of magnitude as the estimates provided by Weichenrieder and Klautke (2008) who found (using a different method) that the total deadweight loss from the tax distortion to corporate financing decisions varies between 0.05 and 0.15 percent of the capital stock, equal to between 0.08 and 0.23 percent of GDP for a corporate capital stock of 1.5 times GDP.
3.4.2.2 Effects of the optimal thin-capitalization rule
The benchmark calibration of the model also delivers the results reported in the first column of table 2. The optimal limit on the debt-asset ratio reduces the average debt ratio for the corporate sector as a whole by 4.8 percentage points. Since small firms are initially more leveraged, the reduction in their debt ratio is significantly larger, amounting to 12.5 percentage points. A model simulation reveals that, at the optimal corporate debt ratio, total corporate interest expenses make up 24.7 percent of the total EBIT generated by the corporate sector. For comparison, total interest payments amount to 27.6 percent of EBIT in the initial unconstrained equilibrium (cf. table 1).
By raising the average cost of capital, the optimal thin capitalization rule reduces the aggregate capital stock of the corporate sector (K) by slightly less than 1 percent. This is due entirely to the fall in the capital stock invested by small firms. Indeed, since the broadening of the corporate tax base allows a 1.8 percentage point cut in the corporate tax rate, and since the forced reduction in the debt ratio of large firms is only a modest 2.7 percentage points, the cost of capital for large firms actually falls a bit, thereby inducing them to increase their capital stock by 0.3 percent.
According to the second row from the bottom of table 2, the optimal thin capitalization rule generates a total welfare gain (WG) equal to 3.1 percent of the initial revenue from the corporate income tax in the benchmark calibration. Interestingly, this gain is larger than the total welfare loss from the tax distortion to financing decisions shown in the bottom row of the table. Comparing the first and the second rows in table 2, we also see that it is second-best optimal to drive the average corporate debt ratio below the first-best level that would be optimal in the absence of tax (shown in the second row from the top). The explanation for these results is that the cap on corporate debt finance allows a cut in the corporate tax rate which reduces the initial tax distortion to investment.
Tabell 3.2 Effects of the optimal thin capitalization rule
Benchmark calibration | Low debt elasticity (εDE = 0.2) | Low user cost elasticity (ε = 0.5) | Full double taxation (te = tr) | Zero double taxation (te = 0) | |
|---|---|---|---|---|---|
β | 0.539 | 0.553 | 0.538 | 0.534 | 0.545 |
β* (av.)1 | 0.542 | 0.557 | 0.542 | 0.539 | 0.546 |
Δβl | -0.027 | -0.013 | -0.028 | -0.032 | -0.021 |
Δβs | -0.125 | -0.111 | -0.126 | -0.13 | -0.119 |
Δβ | -0.048 | -0.033 | -0.047 | -0.052 | -0.041 |
Δτ | -0.018 | -0.013 | -0.018 | -0.02 | -0.015 |
ΔKl/Kl | 0.003 | 0.002 | 0.002 | 0.003 | 0.003 |
ΔKs/Ks | -0.057 | -0.056 | -0.029 | -0.05 | -0.064 |
ΔK/K | -0.009 | -0.009 | -0.005 | -0.008 | -0.011 |
WG/R02 | 0.031 | 0.016 | 0.035 | 0.043 | 0.015 |
DWL0F/R0 | 0.025 | 0.017 | 0.025 | 0.031 | 0.022 |
1Weighted average of the optimal debt ratios for large and small firms in the absence of taxation.
2WG/R0 = welfare gain as a proportion of initial tax revenue.
Memo item: The initial weigthed average debt ratio for the entire corporate sector is 0.586.
As mentioned earlier, some empirical studies have found a lower semi-elasticity of corporate debt with respect to the tax rate than the value of 0.3 assumed in the benchmark calibration. If the semi-elasticity is only 0.2, and if the parameters βj*, aj, bj and kj are recalibrated so that the model still reproduces the initial debt ratios and risk premiums stated in table 1, we obtain the results shown in the second column in table 2. Not surprisingly, we see that the welfare gain from the optimal thin capitalization rule is now smaller, because a lower tax elasticity of debt implies lower initial distortions to corporate financing decisions (i.e., a smaller difference between the average initial debt ratio and the average debt ratio that would be optimal in the absence of tax).
Some studies have also found a lower user cost elasticity of capital demand than our assumed benchmark value of 1.0. The third column of table 2 therefore reports the simulation results obtained when the user cost elasticity is cut in half to 0.5. As one would expect, the fall in the capital stock is now more modest, because capital demand is less sensitive to changes in the cost of capital. However, the overall effects of the optimal thin capitalization rule do not change very much. The reason is that the net change in the cost of capital for the corporate sector as a whole is quite modest (due to the offsetting effects of the cuts in β and τ) which makes the sensitivity of capital demand to the cost of capital less important.
The last two columns in table 2 illustrate the consequences of alternative personal tax regimes for the optimal thin capitalization rule and its impact on the economy. The fourth column assumes that there is no relief at the personal shareholder level for the double taxation of corporate income. This is the case of a classical corporate tax system where dividends and capital gains on shares are subject to the same personal tax rate as other income from capital (i.e., te = tr). Compared to the benchmark calibration which accounts for the current Norwegian rules for shareholder tax relief, full double taxation of shareholder income implies significantly larger initial distortions to the financing decisions of small companies. Hence there is a greater welfare gain from the optimal constraint on corporate debt finance, as shown in the bottom row in the table.
As demonstrated by Sørensen (2005a and 2005b), the Norwegian shareholder income tax with a rate-of-return allowance would in principle be fully neutral if the tax code allowed full loss offset so that taxpayers could always be sure to benefit from the full value of the tax allowance. The last column in table 2 illustrates the effects of such a tax regime which corresponds to a scenario with te = 0 in the present model. In this case it follows from (22) that there is no initial tax distortion to the capital structure of small firms, since the tax rate on interest income in Norway equals the corporate income tax rate. As a consequence, we see from the bottom row in table 2 that the welfare gain from the optimal thin capitalization rule is smaller than in the benchmark scenario where te is positive, reflecting the imperfect loss offsets under current Norwegian tax law.5
Overall, table 2 leaves the impression that the optimal thin capitalization rule is not particularly sensitive to uncertainty about parameter values.
3.5 Conclusions and discussion
According to the analysis in this paper the current tax bias in favour of debt finance makes it second-best optimal to impose a limit on the debt-asset ratio of companies even if they do not have the opportunity to engage in international profit-shifting. Implicitly, the analysis also provides a rationale for a general cap on deductible interest expenses. For plausible parameter values derived from a data set for Norway and from international empirical studies, the analysis suggests that the socially optimal debt ratio is about 4–5 percentage points below the current average corporate debt ratio in Norway. Reducing the average debt ratio to the optimal level would allow a cut in the corporate tax rate of almost 2 percentage points and would generate a net welfare gain of about 2–3 percent of corporate tax revenue, according to the model estimates. Part of the welfare gain would arise from a fall in the risk premiums on corporate debt and equity; the remaining part would stem from the fall in the corporate tax rate.
Our modelling of corporate financing decisions relied on a version of the so-called trade-off theory of capital structure. According to this theory companies trade off the marginal tax benefit from additional debt finance against the resulting increase in the costs of financial distress. Our model allowed for the possibility that companies will want to issue a certain amount of debt even in the absence of interest deductibility because the need to service debt may help to discipline corporate managers, thereby reducing the shareholders’ agency costs of monitoring the firm. Importantly, the model implies that companies will make a socially optimal trade-off between the marginal costs and benefits of debt in the absence of taxation. However, once interest deductibility is allowed, corporate debt ratios will rise above the efficient level, unless the tax advantage of debt finance at the corporate level is fully offset by a tax differential in favour of equity finance at the shareholder level.
An alternative theory of corporate finance is the so-called pecking-order theory originally developed by Myers and Majluf (1984) and Myers (1984). These authors stressed that asymmetric information between managers and outside investors give rise to an adverse selection problem where investors may interpret new issues of shares or debt as a sign that the company is in trouble and in need of liquidity. A company’s use of external finance may thus lead to a fall in its market value. To the extent possible, companies will therefore prefer to finance investment out of retained earnings. If they need additional capital, companies will generally prefer debt over new share issues, because share prices will react more negatively when firms use new equity rather than debt finance, since then investors do not only have to worry about the risk of default, but also about the entire distribution of returns to investment.6 The pecking-order theory only attaches a second-order importance to the tax benefits of debt finance. Further, as noted by Gordon (2010), this theory implies that corporate debt ratios may be inefficiently low due to the adverse selection problem that may lead stock markets to punish the issue of debt.
As Brealy, Myers and Allen (2009) explain, the trade-off theory and the pecking-order theory of corporate finance both have strengths and weaknesses when it comes to explaining the details of corporate financing patterns and their variations across firms and industries. In the present paper I have chosen to work with a version of the trade-off theory because the pecking-order theory does not lead to a well-defined target for a company’s debt-equity mix. However, in so far as adverse selection problems in capital markets would lead to an inoptimally low use of debt finance in the absence of tax, the analysis in the present paper may overstate the benefits of constraints on corporate debt finance and/or interest deductibility.
Moreover, the heterogeneity of firms and industries means that the socially optimal debt ratios of individual firms are likely to differ substantially. For example, within the framework of the trade-off theory of finance, firms that rely more heavily on tangible and relatively safe assets will have higher optimal debt ratios, because their marginal costs of financial distress at any given debt ratio will be lower. The model in the present paper does allow for some heterogeneity across large and small companies, but it clearly does not capture all of the real-world diversity in the capacity for debt finance across firms. This limitation of the model suggests that a general thin capitalization rule applied to all firms (or a general cap on interest deductibility) should be more lenient than the optimal debt ratio derived from the quantitative version of the model presented in this paper.
Technical appendix
1 Approximations to risk premiums
In both sectors of the economy, the private after-tax risk premium included in the cost of corporate finance is
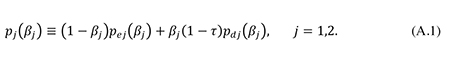
A second-order Taylor approximation of this expression around βj = βj* yields
where
The social risk premiums are
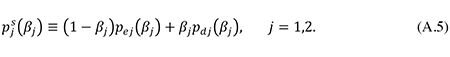
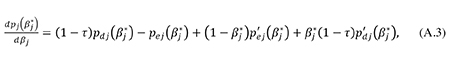
In the absence of tax (τ = 0), private and social risk premiums would coincide, and firms would minimize their cost of finance by minimizing the expression in (A.5), implying the first-order condition
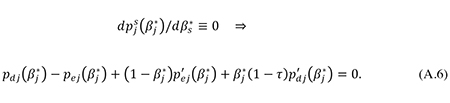
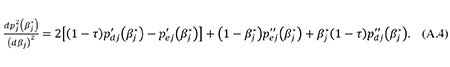
Inserting (A.6) into (A.3), we get
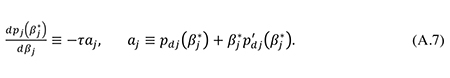
Moreover, defining
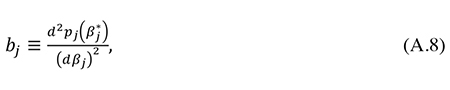
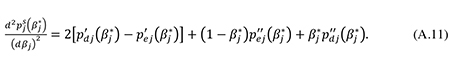
and inserting (A.7) and (A.8) into (A.2), we obtain
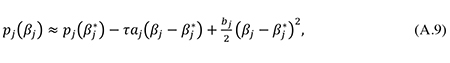
as stated in (6) and (13) in section 2. Further, by using (A.6), we can write the second-order Taylor approximation to the social risk premium (A.5) around βj = βj* as
where
From (A.4), (A.8), and (A.9) it follows that
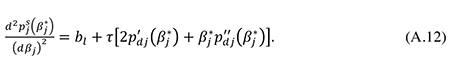
In section 3.4 we introduced the second-order approximation
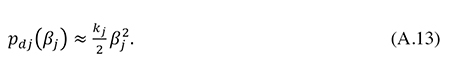
Using (A.12) and (A.13), we may therefore write (A.10) as
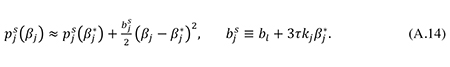
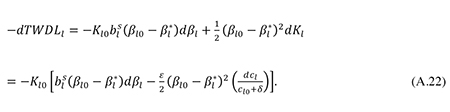
Eq. (A.14) is seen to be identical to eq. (35) in the main text. Note from (A.1), (A.5) and (A.13) that
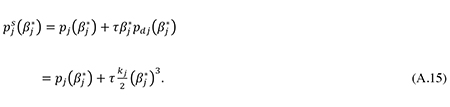
When calibrating the model, I use (A.15) and the specification of bjs stated in (A.14) to ensure consistency between the approximations made in (A.9), (A.13) and (A.14).
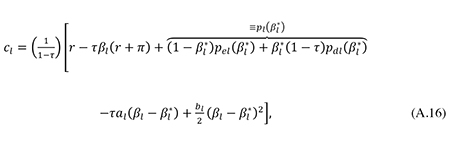
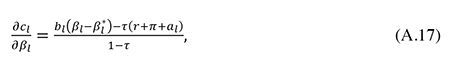
2 The costs of capital and their derivatives
From (4), (6), (8) and (A.13) one finds that
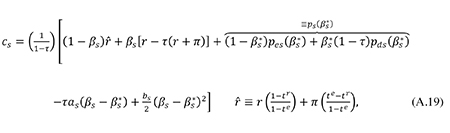
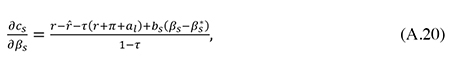
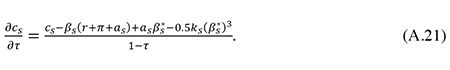
Similarly, we may use (11), (13), (15) and (A.13) to derive
3 The welfare gain from the optimal thin capitalization-rule
The total welfare gain from the imposition of the optimal limit on corporate debt finance is given by the difference between the total welfare gain from lower distortions to corporate financing decisions and the welfare loss from lower corporate investment. A first-order approximation to the welfare gain arising in the sector of large firms may be found by calculating the total differential of equation (20) at the initial equilibrium point, using the approximation of the social risk premium stated in (35). This yields
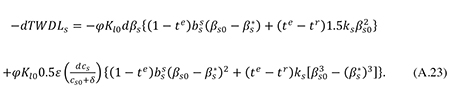
Similarly, the total efficiency gain from lower financing distortions in the sector of small firms may be found by taking total differentials in equation (25) and using (34) and (35) plus the fact that Ks0 ≡ φKl0:
The first-order approximations to the welfare losses from lower investment in the two sectors follow directly from (30) and are given by
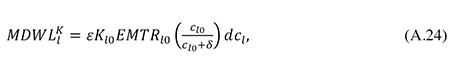
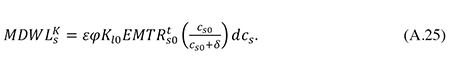
The magnitudes dβj and dcj are the total changes in βj and cj from the initial unconstrained equilibrium point to the new constrained equilibrium where corporate debt ratios are at their second-best optimal level. Measured as a fraction of initial corporate tax revenue, the net welfare gain (WG) from the movement to the new equilibrium is
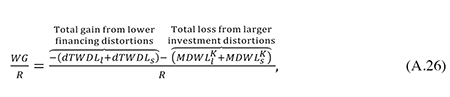
where R is given by (42) (calculated at the initial equilibrium). Note that when (42) and (A.22) through (A.25) are inserted in (A.26), the initial capital stock Kl0 drops out.
4 Calibration methods
4.1 Calibrating the parameters in the risk premium function for small firms
When calibrating the parameters βs*, as and bs, I assume that the semi-elasticity of the debt ratio with respect to the corporate tax rate is the same across small and large firms. From (14) we have
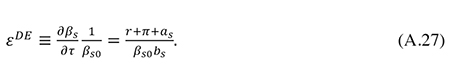
Inserting this into (14), we get
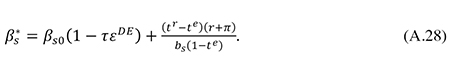
Solving (A.27) for bs, we also have
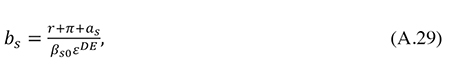
which may be substituted into (A.28) to give
From (34) and the definition of as given in (13) it follows that
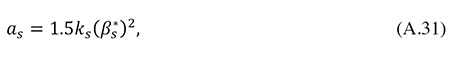
where ks is calibrated to generate the assumed initial risk premium on debt:
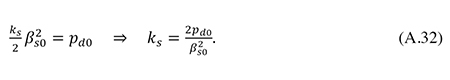
By inserting (A.31) and (A.32) into (A.30), one obtains an equation which may be solved for βs*, using a simple spreadsheet iteration procedure. Once βs* has been determined, the value of as follows from (A.31), and bs may be then be found from (A.29).
4.2 Calibrating rents and economic depreciation
The parameter θ is the ratio of the marginal to the average real pre-tax return to corporate capital and is therefore an (inverse) indicator of the relative importance of rents. I calibrate this parameter in such a way that the model reproduces the observed ratio of total nominal corporate interest payments to the total nominal EBIT (Earnings Before Interest and Tax) generated by the corporate sector. Denoting this ratio by e0, we thus have
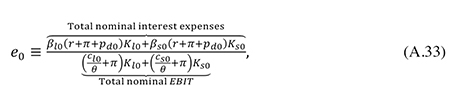
where cl0/θ and cs0/θ are the initial average real rates of return in the two sectors. Recalling that φ ≡ Ks/Kl, eq. (A.33) may be solved for θ to give
Having determined θ in this way, I calibrate the real rate of economic depreciation (δ) to ensure that the model reproduces the observed ratio of total nominal interest expenses to the total nominal EBITDA (Earnings Before Interest, Tax, Depreciation, and Amortization) of the corporate sector, denoted by eda0. Thus I choose δ to satisfy the identity
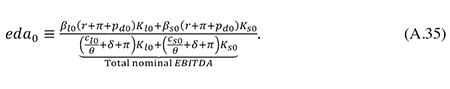
Solving this equation for δ yields
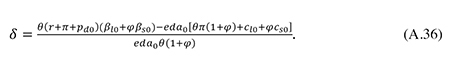
4.3 Calibrating the relative size of the sector for small firms
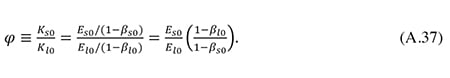
Since the «small firms» in our model are defined as companies whose controlling shareholders are subject to domestic personal income tax, the parameter φ reflects the extent to which the cost of corporate capital is influenced by domestic personal taxes. I assume that this impact is proportional to the fraction of shares in domestic companies held by domestic household investors. Let Es denote the market value of the amount of shares held by these investors, and let El indicate the market value of shares in the «large firms» where the marginal investors do not pay domestic personal income tax. By definition, we then have
There are no available data on the parameter βs0, but the debt-asset ratio of listed companies in Norway was observed to be 0.566 in 2012. I will use this number as a proxy for βl0. Furthermore, it is known that the average debt-asset ratio β0 of all Norwegian non-financial companies was 0.586 in 2012. By definition, the average debt ratio is
Substituting (A.37) into (A.38) and solving for βs0, one gets
With knowledge of β0, βl0, and Es0/El0, we can estimate βs0 from (A.39). The estimate for φ then follows from (A.37).
To estimate Es0/El0, I use the data on the ownership structure in Norwegian companies reported in table A.1, assuming that Es0 corresponds to the amount of equity held directly and indirectly by domestic households. As indicated in the table, this number is given by the sum of the shares held directly by household investors (550) and the estimated household ownership share in the category of industrial owners (304). When estimating the latter number, I assume that household investors control a fraction of the shares issued by industrial owners equal to the fraction of the shares in all private companies held directly by households (cf. the note to table A.1).
Given this estimate of Es0, the estimate for El0 can be calculated in the simple manner indicated in table A.1. According to the table we then get Es0/El0 = 854/4276 = 0.20 which may be inserted in (A.39) and (A.37) to give the estimate for φ reported in table 1 in the main text.
Tabell 3.3 Equity in Norwegian non-financial corportions held by various investor groups (billion NOK, 2012)
Investor group | Listed companies | Unlisted companies | Total |
|---|---|---|---|
Households (H) | 71 | 479 | 550 |
Institutional (I) | 169 | 263 | 432 |
Industrial (Ind) | 206 | 838 | 1 044 |
Foreign (F) | 682 | 383 | 1 065 |
Public sector (P) | 646 | 1 062 | 1 708 |
Other (O) | 68 | 263 | 331 |
H + I + F + O | 990 | 1 388 | 2 378 |
Household share of Ind (HS)* | 15 | 289 | 304 |
Adjusted Ind (AInd = Ind – HS) | 191 | 549 | 740 |
Es = H + HS | 86 | 768 | 854 |
El = I + AInd + F + P + O | 1 756 | 2 520 | 4 276 |
* Estimated as [H/(H + I + F + O)] x Ind.
Kilde: Nærings- og Fiskeridepartementet, Meld. St. 27 (2013–2014).
References
Auerbach, A. J. and L. Kotlikoff (1987). Dynamic Fiscal Policy. Harvard University Press, Cambridge, Massachusetts.
Boadway, R. (1987). The theory and measurement of effective tax rates. In J.M. Mintz and D.D. Purvis, eds., The Impact of Taxation on Business Activity. Kingston, Ontario: John Deutsch Institute for the Study of Economic Policy, pp. 61–98.
Boadway, R., N. Bruce, and J. Mintz (1984). Taxation, inflation, and the marginal tax rate on capital in Canada. Canadian Journal of Economics 15, 278–293.
Brealey, R.A., S.C. Myers, and F. Allen (2009). Principles of Corporate Finance. Concise Edition. McGraw-Hill.
De Mooij, R. A. (2011). The tax elasticity of corporate debt: a synthesis of size and variations. International Monetary Fund, Working Paper no. 11/95.
De Mooij, R.A. (2012). Tax Biases to Debt Finance: Assessing the problem, finding solutions. Fiscal Studies 33, 489--512.
De Mooij, R. A. and S. Ederveen (2008). Corporate tax elasticities: a reader’s guide to empirical findings. Oxford Review of Economic Policy 24, 680--697.
Desai, M.A., C.F. Foley, and J.R. Hines, Jr. (2004). A Multinational Perspective on Capital Structure Choice and Internal Capital Markets. Journal of Finance 59, pp. 2451--88.
Devereux, M.P. (2004). Measuring taxes on income from capital. Chapter 2 in P.B. Sørensen (ed.), Measuring the Tax Burden on Capital and Labor, MIT Press.
Dimson, E., P. Marsh and M. Staunton (2008). The worldwide equity premium – A smaller puzzle. Chapter 11 in Handbook of the Equity Premium, Elsevier.
Egger, P., W. Eggert, C. Keuschnigg, and H. Winner (2010). Corporate taxation, debt financing and foreign plant ownership. European Economic Review 54, 96–107.
Gordon, R. H. (2010). Taxation and corporate use of debt: implications for tax policy. National Tax Journal 63, 151--74.
Griffith, R., J.R. Hines and P.B. Sørensen (2010). International capital taxation. Chapter 10 in The Mirrlees Review: Dimensions of Tax Design, Institute for Fiscal Studies, Oxford University Press.
Hassett, K. and R.G. Hubbard (2002). Tax Policy and Business Investment. In: A.J. Auerbach and M. Feldstein (eds.), Handbook of Public Economics, vol. 3, North-Holland, Amsterdam, pp. 1293–1343.
Huizinga, H., L. Laeven, and G. Nicodème (2008). Capital structure and international debt shifting. Journal of Financial Economics 88, 80–118.
Institute for Fiscal Studies (1991). Equity for Companies: A Corporation Tax for the 1990s, London.
Jensen, M. C. (1986). Agency costs of free cash flow, corporate finance and takeovers. American Economic Review 76, 323–329.
Jensen, M. C. and W.H. Meckling (1976). The theory of the firm: Managerial behavior, agency costs and capital structure. Journal of Financial Economics 3, 305–360.
Keen, M. and R. De Mooij (2012). Debt, taxes and banks. International Monetary Fund (IMF), Working Paper no. 12/48.
King, M.A. and D. Fullerton (1984). The Taxation of Income From Capital: A Comparative Study of the United States, the United Kingdom, Sweden, and West Germany. Chicago: University of Chicago Press.
Mirrlees, J., Adam, S., Besley, T., Blundell, R., Bond, S., Chote, R., Gammie, M., Johnson, P., Myles, G. and Poterba, J. (2011), Tax by Design: The Mirrlees Review. Oxford: Oxford University Press for the Institute for Fiscal Studies
Myers, S.C. and N.S. Majluf (1984). Corporate financing and investment decisions when firms have information that investors do not have. Journal of Financial Economics 32, 1–19.
Myers, S.C. (1984). The capital structure puzzle. Journal of Finance 39, 575–592.
Møen, J., D. Schindler, G. Schjelderup and J. Tropina (2012). International debt shifting: Do multinationals shift internal or external debt? Working paper, March 5, 2012.
Nitter-Hauge, J. and E. Frøyland (2005). Revidert kalkulasjonsrente for statlige tiltak. Økonomisk Forum nr. 7, 2005, 11–17.
Norges offentlige utredninger 2012: 16. Samfunnsøkonomiske analyser. Oslo 2012.
Swedish Corporate Tax Reform Committee (2014). Neutral bolagsskatt -- för ökad effektivitet och stabilitet. SOU 2014:40, Stockholm 2014.
Sørensen, P.B. (2004). Measuring taxes on capital and labor: an overview of methods and issues. Chapter 1 in P.B. Sørensen (ed.), Measuring the Tax Burden on Capital and Labor, MIT Press.
Sørensen, P.B. (2005a). Neutral taxation of shareholder income. International Tax and Public Finance 12, 777–801.
Sørensen, P.B. (2005b). Taxation of shareholder income and the cost of capital in an open economy: theory and applications to the Nordic countries. Danish Journal of Economics (Nationaløkonomisk Tidsskrift) 143, 433–447.
Sørensen, P.B. (2014). Taxation of shareholder income and the cost of capital in a small open economy. Working Paper prepared for the Norwegian Corporate Tax Reform Committee, August 2014.
US Department of the Treasury (1992), Integration of the Individual and Corporate Tax System: Taxing Business Income Once. Washington DC: US Government Printing Office.
Weichenrieder, A.J. and T. Klautke (2008). Taxes and the efficiency costs of capital distortions. CESifo Working No. 2341.
Zangari, E. (2014). Addressing the debt bias: a comparison between the Belgian and the Italian ACE systems. Taxation Papers, Working Paper N. 44–2014, European Commission.
Fotnoter
I wish to thank Guttorm Schjelderup for comments on an earlier version of this paper. Any remaining shortcomings are my own responsibility.
The likely revenue loss has often been overstated in the debate on the ACE. According the estimates by de Mooij (2012), an ACE system would involve a budgetary cost of around 15 per cent of current corporate tax revenue, on average for a selection of advanced economies.
Adding the possibility of internal debt shifting within multinational groups would only stregthen the case for constraints on corporate debt finance. See Egger et al. (2010) for an analysis of internal debt shifting and Møen et al. (2012) for a paper that studies internal as well as external debt shifting.
When deriving (24) I use the facts that (13) and (14) imply [τ + te(1 – τ) – tr](r + τ) = 1 – te)p’s and that (12) and (23) imply p’s = (dpss/dβs) – τ(pds + βsp’ds).
Although a natural specification within the framework of the present model, eq. (44) can at best only capture the effects of the limits on loss offsets in a rough and ready way.
Another way of explaining the firm's preference for debt over new equity is that a manager who believes that the stock market undervalues the company's shares will want to finance new profitable investment by debt rather than new shares to avoid " giving away a free gift" to new investors.